Participatory Evaluation of our 2008 - Action Against Hunger
Participatory Evaluation of our 2008 - Action Against Hunger
Participatory Evaluation of our 2008 - Action Against Hunger

Create successful ePaper yourself
Turn your PDF publications into a flip-book with our unique Google optimized e-Paper software.
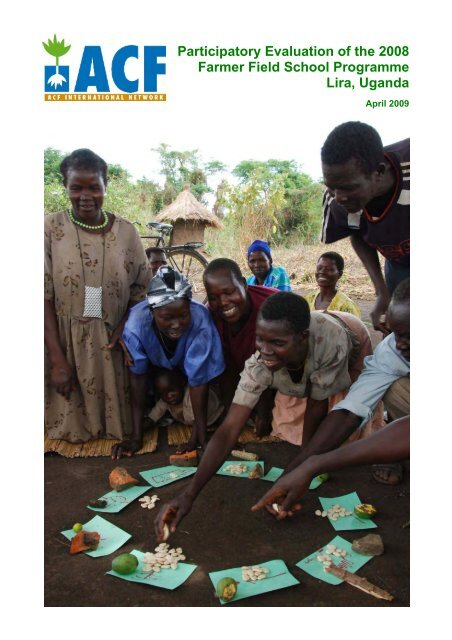
<strong>Participatory</strong> <strong>Evaluation</strong> <strong>of</strong> the <strong>2008</strong><br />
Farmer Field School Programme<br />
Lira, Uganda<br />
April 2009
Acknowledgements<br />
Sincere thanks to the evaluation team members, all <strong>of</strong> whom worked overtime throughout the<br />
process: Atim Betty, Ojara Martin, Otim Tom, Okello Francis, and Jurugo Henry Ali. Additional<br />
programmatic input came from Fatuma Ajwang, Arthur Muteesasira, Molly Alanyo, Mary Obio,<br />
Achora Monica, Akaki Francis, Jacky Kabongo, and Tommy Odida. Onyago Bernard from FAO<br />
and Paul Kabagambe from Fit-Uganda shared useful data, while Bosco Oree, Martin Opiro, and<br />
Olung Nelson supported the team with logistics and transportation. Nikaj van Wees and Silke<br />
Pietzsch critically reviewed the evaluation terms <strong>of</strong> reference and report draft. Special appreciation<br />
to the time and ideas shared graciously by roughly 165 farmer field school focus group participants<br />
consulted during the fieldwork: boma yee!<br />
Pat Foley<br />
patfoley@counterpoint.net<br />
Acronyms<br />
ACF<br />
FAO<br />
FFS<br />
FSL<br />
HDDS<br />
IGA<br />
ILO<br />
LEAD<br />
M&E<br />
MAHFP<br />
NAADS<br />
P4P<br />
RRA<br />
WASH<br />
WFP<br />
<strong>Action</strong> Contre la Faim (<strong>Action</strong> <strong>Against</strong> <strong>Hunger</strong>)<br />
Food and Agriculture Organisation <strong>of</strong> the United Nations<br />
Farmer Field School<br />
Food Security and Livelihoods<br />
Household Dietary Diversity Score<br />
Income Generating Activity<br />
International Lab<strong>our</strong> Organisation<br />
Livelihoods and Enterprises for Agricultural Development<br />
Monitoring and <strong>Evaluation</strong><br />
Months <strong>of</strong> Adequate Household Food Provisioning<br />
National Agriculture Advisory Service<br />
Purchase for Progress<br />
Rapid Rural Appraisal<br />
Water, Sanitation, and Hygiene<br />
United Nations World Food Programme<br />
<strong>Action</strong> <strong>Against</strong> <strong>Hunger</strong> Uganda - 2 - Farmer Field School <strong>Evaluation</strong>
Contents<br />
EXECUTIVE SUMMARY................................................................................................................................... 5<br />
A. SYNTHESIS ................................................................................................................................................................ 5<br />
B. KEY FINDINGS ........................................................................................................................................................... 5<br />
Improved Production Practices........................................................................................................................... 5<br />
Increased Domestic Production.......................................................................................................................... 6<br />
Enhanced Asset Generation and Management Capacity............................................................................... 6<br />
Stronger Household Food Security and Livelihoods ....................................................................................... 6<br />
Farmer Field School Programme Design, Monitoring, and <strong>Evaluation</strong>......................................................... 6<br />
C. CONCLUSIONS........................................................................................................................................................... 7<br />
D. RECOMMENDATIONS................................................................................................................................................. 7<br />
1. BACKGROUND .......................................................................................................................................... 13<br />
1.1 ACF AND THE LANGO SUB-REGION ..................................................................................................................... 13<br />
1.2 THE ACF <strong>2008</strong> FARMER FIELD SCHOOL PROGRAMME ....................................................................................... 13<br />
2. THE ACF FARMER FIELD SCHOOL EVALUATION ................................................................................ 15<br />
2.1 OBJECTIVES .......................................................................................................................................................... 16<br />
2.2 METHODOLOGY ..................................................................................................................................................... 16<br />
2.3 LIMITATIONS .......................................................................................................................................................... 18<br />
3. FARMER FIELD SCHOOL PROGRAMME PERFORMANCE................................................................... 20<br />
3.1 IMPROVED PRODUCTION PRACTICES ................................................................................................................... 20<br />
3.1.1 Participant learning opportunities are appropriate and effective.................................................... 20<br />
3.1.2 Group study plots are focal points for participatory experimentation ............................................ 22<br />
3.1.3 Commercial enterprise selection is participatory and analytical .................................................... 23<br />
3.1.4 Participants demonstrate adoption and transmission <strong>of</strong> practices ................................................ 24<br />
3.1.5 Documentation capacity enhanced at group and individual levels................................................ 25<br />
3.2 INCREASED DOMESTIC PRODUCTION ................................................................................................................... 25<br />
3.2.1 Increased cultivated acreage .............................................................................................................. 26<br />
3.2.2 Increased production............................................................................................................................ 27<br />
3.2.3 Disease resistant cassava is more prevalent ................................................................................... 27<br />
3.3 ENHANCED ASSET GENERATION AND MANAGEMENT CAPACITY......................................................................... 28<br />
3.3.1 Increased marketing capacity <strong>of</strong> own production............................................................................. 29<br />
3.3.2 Strengthened seed multiplication and marketing ............................................................................. 29<br />
3.3.3 Income s<strong>our</strong>ces diversified through value-addition.......................................................................... 30<br />
3.3.4 Increased group and individual savings ............................................................................................ 30<br />
3.3.5 Improved access to and terms <strong>of</strong> credit............................................................................................. 32<br />
4. FARMER FIELD SCHOOL PROGRAMME IMPACT ................................................................................. 33<br />
4.1 STRONGER HOUSEHOLD FOOD SECURITY AND LIVELIHOODS .............................................................. 33<br />
4.2 PARTICIPANT FOOD, INCOME, AND EXPENDITURE PROPORTIONS IMPROVE .......................................... 33<br />
4.3 POSITIVE CHANGES IN GROUP AND HOUSEHOLD ASSETS ...................................................................... 34<br />
4.4 AVERAGE HOUSEHOLD DIETARY DIVERSITY SCORES IMPROVE FROM POOR TO MEDIUM ...................... 35<br />
4.5 REDUCTION IN THE NUMBER OF MONTHS WITH INADEQUATE HOUSEHOLD PROVISIONING OF FOOD .... 36<br />
4.6 IMPROVEMENT IN PARTICIPANT COPING STRATEGY INDEX SCORES ...................................................... 37<br />
4.7 EFFECTIVE ACF FACILITATORS COMMUNICATE PROGRAMME PRACTICES AND ETHOS......................... 38<br />
4.8 PROGRAMME DESIGN AND IMPLEMENTATION REFLECT GENDER ANALYSIS AND DECISION MAKING...... 39<br />
4.9 PROGRAMME ACTIVITIES AND INPUTS ARE SEASONALLY APPROPRIATE AND SYNCHRONISED.............. 40<br />
4.10 PROGRAMME DESIGN IS BASED ON ASSESSMENT AND M&E PLANNING................................................ 41<br />
4.11 GEOGRAPHIC AND HOUSEHOLD TARGETING BASED ON VULNERABILITY AND INTEGRATED CRITERIA... 42<br />
<strong>Action</strong> <strong>Against</strong> <strong>Hunger</strong> Uganda - 3 - Farmer Field School <strong>Evaluation</strong>
Appendices<br />
A. Seasonal Calendar.......................................................................................................................................45<br />
B. Seed Flow Diagram (groundnut) ..................................................................................................................46<br />
C. Matrix Scoring Experiment for Enterprise Selection ....................................................................................47<br />
D. Programme Tools for Targeting and Timing ................................................................................................48<br />
E. <strong>Evaluation</strong> Methodology Diagram ................................................................................................................49<br />
F. <strong>Evaluation</strong> TOR ............................................................................................................................................50<br />
G. Field Tools ...................................................................................................................................................53<br />
H. Fieldwork Images.........................................................................................................................................59<br />
Figures<br />
FIGURE 1. ACF <strong>2008</strong> FFS SITES JUXTAPOSED WITH OTHER ACF PROGRAMME LOCATIONS IN 2007 AND <strong>2008</strong> ........ 12<br />
FIGURE 2. SUMMARY OF FARMER FIELD SCHOOL CORE PRINCIPLES .............................................................................. 14<br />
FIGURE 3. SUMMARY OF FFS GROUPS, ENTERPRISES, AND LOCATIONS ....................................................................... 15<br />
FIGURE 4. ACF FARMER FIELD SCHOOL EVALUATION FRAMEWORK (APRIL 2009) ........................................................ 19<br />
FIGURE 5. COMPARISON OF PREFERRED AND ACTUAL GROUP MEETING TIMES ............................................................. 21<br />
FIGURE 6. SUMMARY OF THE GENDER DIVISION OF LABOUR IN AGRICULTURE............................................................... 22<br />
FIGURE 7. COMPARISON OF ACTUAL AND POTENTIAL GROUNDNUT STUDY PLOT LAYOUTS ........................................... 23<br />
FIGURE 8. PLANTING PRACTICES OF PROGRAMME PARTICIPANTS AND CONTROL GROUP ............................................. 25<br />
FIGURE 9. COMPARISON OF HOUSEHOLD RECORD KEEPING AND QUALITY .................................................................... 25<br />
FIGURE 10. COMPARISON OF A HEALTHY CASSAVA PLANT AND ONE INFECTED WITH CMV .......................................... 28<br />
FIGURE 11. AMOUNT REMAINING IN GROUP BANK ACCOUNT 8 MONTHS AFTER PROGRAMME CLOSURE ....................... 31<br />
FIGURE 12. COMPARED UTILISATION OF COMMERCIAL AND STUDY PLOT PROFITS ........................................................ 32<br />
FIGURE 13. HOUSEHOLD FINANCIAL SITUATION AND ACCESS TO CREDIT....................................................................... 32<br />
FIGURE 14. SUMMARY OF THE HOUSEHOLD ECONOMY................................................................................................... 33<br />
FIGURE 15. AVERAGE NUMBER OF LIVESTOCK PER HOUSEHOLD ................................................................................... 34<br />
FIGURE 16. SUMMARY OF ADDITIONAL PHYSICAL ASSETS RESULTING FROM THE FFS PROGRAMME ........................... 34<br />
FIGURE 17. COMPARISON OF HOUSEHOLD DIETARY DIVERSITY SCORES ....................................................................... 35<br />
FIGURE 18. MONTHS WITH INADEQUATE HOUSEHOLD FOOD PROVISIONING .................................................................. 36<br />
FIGURE 19. COMPUTATION AND COMPARISON OF MIHFP SCORES ............................................................................... 36<br />
FIGURE 20. FREQUENCY OF COPING STRATEGY USE IN ACF FFS PROGRAMME AREAS............................................... 37<br />
FIGURE 21. RELATIVE SEVERITY OF COPING STRATEGIES .............................................................................................. 37<br />
FIGURE 22. RANGES OF COPING STRATEGY INDEX ......................................................................................................... 38<br />
FIGURE 23. SOURCES OF SKILL FOR AGRONOMIC PRACTICES AMONG ACF FFS MEMBERS......................................... 38<br />
FIGURE 24. COMPARISON OF FEMALE AND MALE FFS MEMBERS AND COMMITTEE ROLES............................................ 40<br />
FIGURE 25. COMPARISON OF GENDER ROLE DISCREPANCIES IN FFS COMMITTEES ..................................................... 40<br />
FIGURE 26. WEALTH GROUP ANALYSIS OF FFS MEMBERS AND COMMITTEES ............................................................... 44<br />
<strong>Action</strong> <strong>Against</strong> <strong>Hunger</strong> Uganda - 4 - Farmer Field School <strong>Evaluation</strong>
Executive Summary<br />
A. Synthesis<br />
This is an evaluation <strong>of</strong> the <strong>2008</strong> farmer field school (FFS) programme facilitated by <strong>Action</strong> <strong>Against</strong><br />
<strong>Hunger</strong> (ACF) in Uganda’s Lango sub-region. The programme was implemented from 1 January to<br />
31 July <strong>2008</strong> under a letter <strong>of</strong> agreement with the Food and Agriculture Organisation <strong>of</strong> the United<br />
Nations (FAO), who provided the cash and in-kind programme inputs.<br />
The evaluation brings together information from ACF and FAO, while at the same time <strong>of</strong>fering an<br />
applied learning opportunity to ACF staff participating as team members. It looks at the<br />
performance and impact <strong>of</strong> the FFS programme according to indicators created for the evaluation.<br />
The performance analysis covers production practices, increased production, and capacity for<br />
asset generation and management. The impact analysis investigates whether short term<br />
accomplishments in the programme have influenced the food security and livelihoods <strong>of</strong> participant<br />
groups and their individual households.<br />
Programme performance was good overall, with a range <strong>of</strong> planned and unanticipated<br />
accomplishments in relation to the FFS groups. A longer intervention with better planning and<br />
monitoring would have increased the strength <strong>of</strong> the accomplishments. Not much can be proved at<br />
impact level, however, given the short programme duration. The evaluation team is nonetheless<br />
convinced that benefits will continue accruing to FFS participants even now that the programme is<br />
finished, especially in terms <strong>of</strong> practices affecting production fav<strong>our</strong>ably and increased access to<br />
cash and credit.<br />
This executive summary outlines the key findings <strong>of</strong> the evaluation according to thematic focus.<br />
Conclusions are drawn from the findings, and are followed by a set <strong>of</strong> recommendations with<br />
supporting explanation. The report body begins with a general outline <strong>of</strong> the location and context <strong>of</strong><br />
the <strong>2008</strong> FFS programme. The evaluation objectives, methodology, and limitations are discussed<br />
before the remainder <strong>of</strong> the document addresses each indicator separately.<br />
B. Key Findings<br />
Improved Production Practices<br />
1. Promoted production practices appear to have been widely adopted by individuals convinced <strong>of</strong><br />
the benefits they can bring, and have been transferred from the farmer field school gardens to<br />
individual cultivation. These practices revolve primarily around land preparation, seed selection,<br />
planting, weeding, and pest control – all <strong>of</strong> which were implemented according to the seasonal<br />
calendar.<br />
2. Transmission <strong>of</strong> production practices to neighb<strong>our</strong>s and surrounding communities is reported in<br />
all locations but could not be verified as crops were not standing at the time <strong>of</strong> evaluation.<br />
Greater transmission could nonetheless be fostered through additional community activities at<br />
the commercial and study garden sites.<br />
3. Adoption <strong>of</strong> promoted documentation practices is not nearly as widespread as the production<br />
practices, especially for more complex tools like the pr<strong>of</strong>itability analysis, budget, and work plan<br />
which remain challenging even at group level.<br />
4. Literacy is an obstacle to adopting the documentation practices promoted in the programme,<br />
affecting their feasibility at group and individual levels, especially for women.<br />
5. Study and commercial gardens are appropriate and effective media for achieving programme<br />
objectives and ethos, and help advertise programme messages more widely than among<br />
participants alone.<br />
6. The study gardens nonetheless could be utilised even more effectively to enc<strong>our</strong>age greater<br />
farmer participation and experimentation.<br />
<strong>Action</strong> <strong>Against</strong> <strong>Hunger</strong> Uganda - 5 - Farmer Field School <strong>Evaluation</strong>
Increased Domestic Production<br />
7. ACF is unable to determine FFS impact on increased production due to lack <strong>of</strong> data and<br />
commercial and study crop failures in <strong>2008</strong> resulting from poor climate conditions.<br />
8. Increased production over time attributable to the programme can nonetheless be assumed on<br />
the basis <strong>of</strong> the apparently widespread adoption <strong>of</strong> recommended agronomic practices in FFS<br />
and household gardens.<br />
9. Increased land opening and subsequently higher production could have been achieved if<br />
animal traction inputs and training had taken place according to plan instead <strong>of</strong> late (oxen) or<br />
non- (ploughs) delivery <strong>of</strong> required inputs.<br />
10. Small ruminant restocking was also planned to contribute further to increased household<br />
production but never eventuated and denied participants an additional financial asset.<br />
11. Adding a complementary activity in cassava multiplication, as originally planned, would have<br />
further enhanced participant skills, diversified household food and income s<strong>our</strong>ces, and<br />
enc<strong>our</strong>aged greater availability <strong>of</strong> disease resistant cassava currently scarce in the area.<br />
Enhanced Asset Generation and Management Capacity<br />
12. Not only are all FFS groups still together and active, but all 12 still have active bank accounts –<br />
several with substantial balances remaining.<br />
13. All groups can explain at length the different strategies they have adopted to group<br />
contributions, savings, distributions, and in some cases even interest-based lending with their<br />
collective FFS capital.<br />
Stronger Household Food Security and Livelihoods<br />
14. The FFS was an appropriate intervention at the right time in the process <strong>of</strong> returnee household<br />
livelihood recovery, with sufficient production already underway to provide a programmatic<br />
foundation and focus rather than trying to initiate productive activities.<br />
15. The programme contributes positively to household food s<strong>our</strong>ces, income s<strong>our</strong>ces, and<br />
expenditure patterns, all <strong>of</strong> which over time should increase resilience to livelihood shocks.<br />
16. Whether specifically called ‘farmer field schools’ or whether conceived as part <strong>of</strong> a more<br />
comprehensive community development programme, the approach is both appropriate and<br />
effective for mobilising rural smallholders to identify and solve their own production problems<br />
while enhancing current production capacity.<br />
17. The seasonal timing <strong>of</strong> some activities was inappropriate and in some cases reduced potential<br />
programme impact, particularly in-kind distribution <strong>of</strong> oxen, ploughs, and cassava cuttings.<br />
18. Many people listen to radio programmes, including last year’s production-based and seasonally<br />
timed broadcasts aired during implementation.<br />
19. The inability to include post-harvest practices, loss reduction, and the nurturing <strong>of</strong> direct market<br />
linkages in the FFS programme lessened its potential impact on household food security and<br />
livelihoods.<br />
Farmer Field School Programme Design, Monitoring, and <strong>Evaluation</strong><br />
20. Increased impact on production and income (and ultimately on food security and livelihoods)<br />
could have been achieved through a longer programme that embraced at least one complete<br />
production cycle.<br />
21. ACF farmer field school facilitators display knowledgeable aptitude in working with their<br />
respective groups, all <strong>of</strong> which demonstrate genuine mobilisation and solidarity.<br />
22. The ACF facilitators also displayed an impressive command <strong>of</strong> gender issues in programme<br />
communities that could be better utilised in future design, implementation, and analysis.<br />
23. Rapid rural appraisal (RRA) tools have proven effective in opening group discussion to greater<br />
and more balanced participation, while at the same time enc<strong>our</strong>aging collective analysis that<br />
does not depend on respondent literacy. Continued experimentation may lead to RRA<br />
alternatives to some <strong>of</strong> the more complex group tools, particularly pr<strong>of</strong>itability analysis, and<br />
overcome some <strong>of</strong> the challenges imposed by illiteracy – particularly with female participants.<br />
<strong>Action</strong> <strong>Against</strong> <strong>Hunger</strong> Uganda - 6 - Farmer Field School <strong>Evaluation</strong>
24. FAO cannot be relied upon for seasonally appropriate delivery <strong>of</strong> in-kind programme inputs, but<br />
alternatives are available through increased collaboration with other farmer field school<br />
networks and NGOs who could <strong>of</strong>fer the same inputs with less delay.<br />
25. Donor funding cycles and procurement procedures have proven counterproductive to<br />
maximising seasonally strategic implementation.<br />
C. Conclusions<br />
1. Farmer field schools were an appropriate intervention within ACF’s <strong>2008</strong> Uganda country<br />
strategy and its food security and livelihoods programming therein.<br />
2. The programme was similarly appropriate for participating returnee households with respect to<br />
their already having re-established production and shifted away from livelihood strategies<br />
based on camp provisions affecting food, income, and expenditure.<br />
3. The ACF FFS groups were well mobilised and appeared to have embraced practices promoted<br />
through the programme, but information management was weak throughout, from monitoring<br />
and reporting to record keeping and photography.<br />
4. Programme impact on household food security and livelihoods cannot be proven but<br />
nonetheless appears evident on the basis <strong>of</strong> qualitative analysis and triangulated proxy<br />
indicators.<br />
5. Future FFS programme impact could be increased through a longer programme working with<br />
full production cycles, increased emphasis on complementary activities, and enhanced<br />
participation and experimentation.<br />
6. Opejal parish in Okwang sub-county (Lira) appears to have the worst food security and<br />
livelihood situation among the three programme areas. They have less savings in their group<br />
bank account, the fewest additional physical assets created during the programme, and<br />
directed a greater proportion <strong>of</strong> their expenditure to household items and food and debt loan<br />
payments compared with the groups in Aceno and Oyoro. Their crop production and<br />
subsequent income was similarly less, although their proportion <strong>of</strong> income from own livestock is<br />
higher.<br />
D. Recommendations<br />
1. The framework used to structure this evaluation should be utilised as a foundation to<br />
developing a logframe for the next programme cycle. The evaluation framework provides a<br />
structure for improved programme design and planning based on a logframe. Revision will be<br />
necessary at all levels (goal, objective, outputs), but the indicators will require particular<br />
attention. With a more strategic planning process, programme data could achieve a better<br />
balance <strong>of</strong> quantitative and qualitative analysis than what has been possible to date. Fewer<br />
indicators will also help streamline future M&E. This will be preferable to the abundance <strong>of</strong><br />
indicators used to triangulate findings in this evaluation. Regarding behavi<strong>our</strong> change, FFS<br />
groups themselves should be consulted to identify indicators that will be more revealing <strong>of</strong><br />
programme impact than the more standard (but less informative) aggregates like ‘number <strong>of</strong><br />
groups formed’ or ‘number <strong>of</strong> participants trained’.<br />
2. Baseline data collection must precede programme implementation so that monitoring<br />
and evaluation can be more strategically focused, ensuring that data collection fulfils<br />
specific information and reporting needs. Baseline data collection should be undertaken<br />
once facilitators have completed their FFS training, participant selection has concluded, and<br />
groups have been established. Data should be limited to the strategic minimum required to<br />
fulfil all programme indicators and any other specific information needs (for internal/external<br />
reporting).<br />
3. Baseline data collection must include production levels for study/commercial crops<br />
specific to each season and location, even if based on participant estimates <strong>of</strong> the<br />
previous year or expectations based on typical seed rate and acreage. Without such data<br />
<strong>Action</strong> <strong>Against</strong> <strong>Hunger</strong> Uganda - 7 - Farmer Field School <strong>Evaluation</strong>
it will not be possible to assess the extent to which the programme contributes to increased<br />
production, as is the case for the current evaluation.<br />
4. Better documentary evidence is required to retain organisational memory <strong>of</strong> programme<br />
groups, locations, and activities. Facilitators should photograph key programmatic<br />
milestones for improved documentation and reporting. GPS coordinates should also be<br />
included for all FFS groups in future to support ACF’s already strong mapping capacity and<br />
ensure that groups can be located in the future (the central meeting point, typically a shade<br />
tree, should be used). Without these there is little or no documentary evidence to support<br />
future follow-up or evaluation. Greater document record keeping is also needed at base level<br />
so that group decisions and activities can be better understood for future evaluations.<br />
5. The farmer field school programme should be one year in duration, from 1 February to<br />
31 January. This should help align it to donor disbursement timing and, more critically, allow<br />
the programme to include an entire first season production cycle and most <strong>of</strong> the second. The<br />
additional time will create more opportunities for reinforced programme messages,<br />
complementarity with other ACF activities, and increased impact.<br />
6. Farmer field schools should where possible build on existing community groups<br />
already galvanised for a specific purpose. Other ACF programmes, for example, centre on<br />
water user committees, village health teams, or income generation groups. Working with<br />
existing groups could strengthen them further and enc<strong>our</strong>age the sustainability <strong>of</strong> both<br />
endeav<strong>our</strong>s. Similarly, the possibility <strong>of</strong> FFS participation could be attractive to participants<br />
seeking incentives for their currently voluntary contributions, such as the village health teams.<br />
7. Farmer field school groups should be constituted from within single communities, not<br />
patched together with individuals from several separate communities. Groups composed<br />
<strong>of</strong> different village members find it more difficult to share common programme assets like<br />
draught animals and spray cans, and must travel further for meetings which can disc<strong>our</strong>age<br />
their attendance. Distance between participants could also limit potential for collective bulking,<br />
storage, processing, or marketing. Arguably it is also possible that a more community focused<br />
approach can help increase local availability <strong>of</strong> food. Even coping strategies might be<br />
supported through this approach, increasing the likelihood that relatives and neighb<strong>our</strong>s have<br />
seed/food to share or loan when necessary. Skill transfer might also be facilitated better this<br />
way, with more people in a concentrated area exposed to particular practices than when<br />
participants are dispersed throughout the area. Initial mobilisation <strong>of</strong> sub-county and parish<br />
leaders might therefore also need to include this consideration to avoid situations like Aceno in<br />
<strong>2008</strong> where the sub-county dictated how groups would be constituted and from where.<br />
8. Communities with FFS groups should be formed with distance between them, instead <strong>of</strong><br />
closely clustered villages. This applied only in Minakulu sub-county. Although groups should<br />
be concentrated in single communities (per preceding recommendation), greater spread <strong>of</strong><br />
practices could over time be achieved with pragmatic spacing <strong>of</strong> participating communities.<br />
Neighb<strong>our</strong>s can nonetheless be included in complementary inputs like cassava multiplication<br />
and goat restocking. It might even be possible to include neighb<strong>our</strong>s in commercial seed<br />
multiplication, depending on the crop and its skill level requirements. Access to traction also<br />
could increase, as could inclusion in bulking, storing, and marketing. Spreading FFS groups<br />
more widely apart therefore would help enc<strong>our</strong>age them to develop as lead farmers in their<br />
immediate areas.<br />
9. Although FFS groups should lead their own decision making, ACF should consider<br />
enc<strong>our</strong>aging a greater number female <strong>of</strong> committee members. FFS groups tend to have<br />
more female members, and staff concur that female participants in general are more effective<br />
than their male counterparts. Conversely, committee membership tends to be overwhelmingly<br />
male, especially the more senior positions <strong>of</strong> secretary and chair. This raises the issue whether<br />
group leadership reflects gender and power dynamics more than it represents group<br />
composition.<br />
<strong>Action</strong> <strong>Against</strong> <strong>Hunger</strong> Uganda - 8 - Farmer Field School <strong>Evaluation</strong>
10. FFS group meeting locations could be better utilised to increase programmatic scope<br />
through demonstration <strong>of</strong> complementary initiatives. The <strong>2008</strong> programme successfully<br />
included secondary priorities such as stoves, latrines, drying racks, etc. New ACF<br />
programming in Karamoja is also planning this approach for all <strong>of</strong> its activities, building on<br />
existing nutrition sites and already captive audiences to launch a range <strong>of</strong> activities. By the<br />
time another FFS programme is ready to commence there should already be lessons from<br />
Karamoja on how best to utilise existing community focal points.<br />
11. A more participatory and contextually appropriate tool is required to facilitate<br />
pr<strong>of</strong>itability analysis and enterprise selection. Last year’s approach to pr<strong>of</strong>itability analysis<br />
and enterprise selection was complicated. Even if participants understood at the time, there is<br />
no evidence that they can now replicate the process independently. A more participatory<br />
approach such as matrix scoring or proportional piling could prove easier to understand and<br />
apply without FFS facilitator support. More accessible tools could also provide a basis for<br />
articulating more participatory indicators and monitoring approaches that reflect greater<br />
emphasis on farmer experimentation.<br />
12. Study plots could be more strategic and participatory in their design and development<br />
to maximise the comparative experimental possibilities they <strong>of</strong>fer. Although some<br />
evaluation team members were split on this issue, the majority felt that study plots could be<br />
more rigorous in the number and type <strong>of</strong> production problems explored – instead <strong>of</strong> limiting to<br />
a single problem only. Greater experimentation and participatory design could also increase<br />
the study plot potential to stimulate non-participating neighb<strong>our</strong>s to consider the practices<br />
promoted in the FFSs.<br />
13. Key events in the study plot cycle should include neighb<strong>our</strong>s and community members<br />
not participating in the farmer field school. These events could include preparation,<br />
planting, pest control, weeding, harvest, etc. Creating opportunities for non-participants to see<br />
techniques and benefits first hand could increase the transmission and adaptation <strong>of</strong> promoted<br />
practices. This could also increase legitimacy <strong>of</strong> the FFS group as potential lead farmers.<br />
14. The strategic relationship between food and cash crops (and between first and second<br />
cultivation seasons) should be explored further to determine how best to engage with<br />
and improve the results <strong>of</strong> the process. Complicated decisions are made about what to<br />
grow, when, whether it is stored, which commodities are sold at what times, etc. Individual<br />
ACF FFS staff are knowledgeable in these dynamics but neither programme design nor related<br />
M&E identify how activities influence these strategies, to what extent, or whether they even<br />
should.<br />
15. Increased linkages should be facilitated to connect FFS groups directly with market<br />
opportunities. Immediate possibilities already on the ACF radar but requiring further<br />
development are continued (but improved) collaboration with Victoria Seeds, nascent contact<br />
with USAID’s livelihoods and enterprises for agricultural development (LEAD) programme, and<br />
interest in WFP’s emerging Purchase for Progress strategy. An effective combination <strong>of</strong> some<br />
or all <strong>of</strong> these in concert with farmer field schools could create multiple new opportunities for<br />
complementary activities throughout the programme cycle that ultimately would increase<br />
impact on household food security and livelihoods.<br />
16. Future plans to provide processing equipment at FFS network level should be<br />
reconsidered in light <strong>of</strong> the prohibitive distance between intended user groups. It is<br />
unrealistic to expect that farmers will travel to other communities in order to shell their<br />
groundnut, for example, when similar equipment is also available in market centres that may in<br />
fact be easier to reach. While the concept <strong>of</strong> an area network is attractive, more locally<br />
dispersed processing and storage, for example, could increase participant benefits at group<br />
and individual levels.<br />
<strong>Action</strong> <strong>Against</strong> <strong>Hunger</strong> Uganda - 9 - Farmer Field School <strong>Evaluation</strong>
17. ACF FFS programme planning should include greater engagement with the sub-county<br />
level FFS network for increased linkages and experience sharing. Even if network level<br />
processing equipment is unrealistic in practice, the FFS network could still <strong>of</strong>fer tangible<br />
benefits such as networking related to complementary activities, marketing opportunities, new<br />
ideas, etc. FAO will continue to enc<strong>our</strong>age FFS networks, so engagement can only be to group<br />
advantage. Otherwise, some groups may feel marginalised from the network and some<br />
activities, as reported in Minakulu.<br />
18. Cassava multiplication and transfer should be included in future FFS activities and<br />
curricula as a complementary initiative that increases food access and availability. The<br />
FFS group can be used as a locus for cassava distribution and practices, further strengthening<br />
the group as a local s<strong>our</strong>ce <strong>of</strong> innovative practices and varieties. This would also create an<br />
additional opportunity for non-FFS participants to see what the groups are doing and learn<br />
from their experience, ultimately benefiting from increased access to disease resistant<br />
cassava. ACF first should confirm which variety is most appropriate. The <strong>2008</strong> programme<br />
promoted akena, which reportedly has been replaced by MH97 as the recommended choice<br />
for its greater resistance. This should be verified.<br />
19. Goat restocking should continue to be included in future FFS design, including<br />
neighb<strong>our</strong>s not participating directly in the programme. Animals are key financial assets<br />
and any opportunity to diversify income and food s<strong>our</strong>ces will benefit households over time.<br />
Including neighb<strong>our</strong>s could help reduce resentment about not receiving other programme<br />
inputs while at the same time spreading benefits more widely (either receiving their own animal<br />
at the same time as participants or receiving the first kid). Planning should ensure inclusion <strong>of</strong><br />
activities and costs associated with animal treatment, not only procurement and distribution.<br />
20. Future FFS programming should explore how income generating opportunities could be<br />
increased without distracting from core activities. The emphasis here is with increasing<br />
income opportunities. Stand alone IGA initiatives like those facilitated in other ACF Uganda<br />
programmes could prove too demanding in terms <strong>of</strong> participant time and could distract from<br />
the programmatic focus <strong>of</strong> FFSs. Nonetheless, at individual and group level there are<br />
possibilities to increase income s<strong>our</strong>ces and levels. Possibilities include processing, value<br />
addition, direct market linkages, product bulking and sale, etc. All such activities could be<br />
linked with the commercial and study plot production, ideally extended to household level for<br />
particularly active participants.<br />
21. Future ACF monitoring and surveillance should explore the correlation <strong>of</strong> high market<br />
prices, months with inadequate household food provisioning, feeding centre<br />
admissions, and possibly even groundwater levels. 1 The seasonality <strong>of</strong> programming<br />
should also be considered alongside the seasonality <strong>of</strong> household shocks and stresses.<br />
Identifying and understanding such linkages might lead to programmatic approaches to<br />
prevent or minimise their effect on household food security and livelihoods. Greater seasonal<br />
analysis can also guide the timing <strong>of</strong> activities and inputs. This type <strong>of</strong> cross-referencing would<br />
also strengthen departmental integration, or at least coordination, while increasing the<br />
relevance <strong>of</strong> ACF monitoring and surveillance. Complementarity <strong>of</strong> methods within the FSL<br />
unit might also be improved in the process, such as how approaches to farmer<br />
experimentation and cash transfers might overlap and when they should be done.<br />
22. Alternatives to depending on FAO procurement are required to ensure seasonally<br />
appropriate timing <strong>of</strong> inputs and related activities. Rather than depending on FAO<br />
procurement and release <strong>of</strong> in-kind programme inputs, other farmer groups such as those in<br />
the FFS network or those working with other NGOs in the North could be viable s<strong>our</strong>ces <strong>of</strong><br />
seed, livestock, or cassava cuttings. Victoria Seeds could also be a s<strong>our</strong>ce <strong>of</strong> seeds, <strong>of</strong>fering<br />
ACF FFS participants the additional income opportunity <strong>of</strong> direct access to commercial<br />
1 Anticipating this discussion, the evaluator sought nutrition programme enrolment data for the 2007-<strong>2008</strong> period so that<br />
the annual trend could be compared with others like market prices and MIHFP. Price data ultimately were incomplete<br />
and could not be used.<br />
<strong>Action</strong> <strong>Against</strong> <strong>Hunger</strong> Uganda - 10 - Farmer Field School <strong>Evaluation</strong>
purchasing <strong>of</strong> their harvest. Another possibility would be to increase the cash component paid<br />
to groups so that they can be empowered to organise their own purchase <strong>of</strong> programme<br />
inputs. This approach would align with that already underway in an ACF direct cash transfer<br />
programme in Lira, wherein groups and individuals are backstopped in managing their own<br />
enterprise planning, savings, and expenditure.<br />
23. ACF should formally request FAO to fulfil its pending <strong>2008</strong> commitments to provide a<br />
plough to each group and a goat to every participant. These were important shortcomings<br />
<strong>of</strong> the <strong>2008</strong> programme that diminished ACF’s legitimacy in participants’ eyes as an effective<br />
implementing agency and weakened potential programmatic impact on household production,<br />
food s<strong>our</strong>ces, income s<strong>our</strong>ces, and resilience.<br />
24. Donors supporting household food security and livelihoods through production should<br />
ensure that cash and kind inputs are available early enough in the calendar year to<br />
ensure NGO programming can capitalise on first season. In practice, due to funding, most<br />
activities did not start until late February and March. Although this still enabled ACF to work<br />
with participants from early in their production cycle, an earlier start to activities would allow<br />
more effective FFS engagement by beginning before land preparation commences. This<br />
approach would increase the benefits <strong>of</strong> working through an entire production cycle. In-kind<br />
contributions to support production have seasonal constraints that determine periods for<br />
delivery, training, preparation, etc.<br />
25. Future FAO data collection <strong>of</strong> NGO farmer field school programmes for both monitoring<br />
and evaluation should be shared routinely with each agency to support their own<br />
internal monitoring. Most <strong>of</strong> the time and energy invested by ACF in FFS monitoring was for<br />
the crop data required by FAO. Data were collected and entered by ACF staff then forwarded<br />
to FAO in Kampala without internal summary or analysis. Nor were there any summary or<br />
analysis fed back from FAO. ACF (and presumably other agencies) would benefit from better<br />
access and use <strong>of</strong> this same information as a complement to its internal M&E. The process<br />
within FAO <strong>of</strong> institutionalising this approach would strengthen their own M&E capacity in the<br />
process, and give further value to the financial and technical support they <strong>of</strong>fer.<br />
<strong>Action</strong> <strong>Against</strong> <strong>Hunger</strong> Uganda - 11 - Farmer Field School <strong>Evaluation</strong>
Figure 1. ACF <strong>2008</strong> FFS sites juxtaposed with other ACF programme locations in 2007 and <strong>2008</strong><br />
<strong>Action</strong> <strong>Against</strong> <strong>Hunger</strong> Uganda - 12 - Farmer Field School <strong>Evaluation</strong>
1. Background<br />
1.1 ACF and the Lango Sub-Region<br />
ACF has worked in the Lango sub-region since 2004 with a combination <strong>of</strong> food security,<br />
livelihoods, nutrition, and water/sanitation programmes in an overall integrated approach to prevent<br />
and treat malnutrition. Initial work was in the internally displaced person camps scattered<br />
throughout the North but then shifted gradually to rural homesteads as security improved and<br />
households returned. The ACF food security and livelihood programme throughout this period has<br />
tried to support household recovery through increased access to productive assets like agricultural<br />
inputs, extension, diversified income s<strong>our</strong>ces, and knowledge. Means toward these ends have<br />
evolved alongside changing household priorities as rural livelihoods grow increasingly<br />
(re)established through consecutive production cycles. Programming has shifted away from<br />
broadcast activities like seed fairs for thousands <strong>of</strong> households to more targeted interventions to<br />
strengthen household resilience while seeking greater integration with nutrition and WASH.<br />
Security has improved greatly in the Lango sub-region since the middle <strong>of</strong> 2006 after a cessation <strong>of</strong><br />
hostilities between the Uganda government and the Lord’s Resistance Army. Voluntary<br />
resettlement has been a promising progression from an emergency situation, with the return<br />
process now <strong>of</strong>ficially complete in Lango. However, return and recovery have been followed by<br />
reductions in the number <strong>of</strong> donors supporting the area and the amount <strong>of</strong> funding currently<br />
available during this transition between so-called emergency and development phases. Food<br />
security nonetheless remains a priority, with ongoing integrated phase classifications ranking the<br />
Lango sub-region as a Phase 2 area with moderate/borderline food insecurity (see map, Figure 1).<br />
Food insecurity in Lango results primarily from insufficient production at the household level. Land<br />
access has improved since return commenced in 2006, with households accessing up to 5.5 acres<br />
according to ACF monitoring. Nevertheless, increases in production have not followed suit. The<br />
main constraints to increased production are with household access to productive inputs like<br />
seeds, tools, and animal traction. Low crop production also contributes to households lacking<br />
sufficient food for consumption, sale, or seed stocks. This is exacerbated by inefficient farming<br />
practices and inferior crop/seed storage practices, the combination <strong>of</strong> which decreases seed<br />
security and further undermines the household economy.<br />
Newly resettled households require several consistently successful harvests before agricultural<br />
efficiency can be discussed. To support return and recovery they therefore needed some form <strong>of</strong><br />
assistance for at least a year and half after their resettlement. Estimates for <strong>2008</strong> harvests were<br />
initially good but below average rainfall ultimately proved counterproductive as the year<br />
progressed. Such conditions could have potential long term effects on household resilience and<br />
food security into 2009.<br />
Local markets are functioning and usually have food available (although less in Otuke), but they<br />
are poor in quantity and diversity <strong>of</strong> foods because <strong>of</strong> low local production. Household cash access<br />
is poor and multiple forms <strong>of</strong> income are needed to ensure basic needs can be met. Formal credit<br />
is almost entirely lacking. Livestock resurgence has also been slow due to limited household<br />
capital, relatively few animals in the area, and sharp price increases for both fuel and staple foods<br />
that have doubled or in some cases tripled since 2005.<br />
1.2 The ACF <strong>2008</strong> Farmer Field School Programme<br />
Farmer Field Schools (FFS) comprise a group <strong>of</strong> rural smallholders who unite around a common<br />
production interest and problem that they explore together in the c<strong>our</strong>se <strong>of</strong> the programme, with<br />
facilitated external guidance and support throughout. Groups <strong>of</strong> 25-30 members elect <strong>of</strong>ficers,<br />
develop a constitution, and open a shared bank account before receiving a cash grant and ongoing<br />
training in production practices related to their unique production problem. Members meet weekly<br />
to analyse the “how and why” <strong>of</strong> their production with additional training from the external facilitator<br />
(with one facilitator responsible for f<strong>our</strong> separate FFS groups). On the basis <strong>of</strong> collective analysis<br />
<strong>Action</strong> <strong>Against</strong> <strong>Hunger</strong> Uganda - 13 - Farmer Field School <strong>Evaluation</strong>
and decision making (discussed further below), every FFS group selects both a study enterprise<br />
and a commercial enterprise. The study enterprise concentrates on one or more specific<br />
production problems and through farmer experimentation identifies contextually appropriate means<br />
<strong>of</strong> solution or mitigation. The commercial enterprise is dedicated to a group pr<strong>of</strong>it making venture<br />
but nonetheless also includes strong elements <strong>of</strong> promoting improved production practices. Groups<br />
can select the enterprises <strong>of</strong> their choice, based on a facilitated and analytical decision making<br />
process that enc<strong>our</strong>ages members to isolate critical production issues for improvement. With the<br />
study and commercial enterprises, farmers make ongoing field observations and relate these to<br />
their past experience in order to make decisions about how to improve production and pr<strong>of</strong>itability<br />
in the future. Participants should transplant what is learned through the group approach to their<br />
individual households and, ideally, transmit their experience and practice more widely in the<br />
surrounding community.<br />
Beyond the experimentation and learning opportunities afforded by the programme, each FFS<br />
group also receives a cash grant <strong>of</strong> Ugx 800,000 (approximately $400) to establish its bank<br />
account with capital to purchase production inputs required for their two enterprises. The group<br />
experience therefore extends beyond production alone to encompass a range <strong>of</strong> complementary<br />
support in practices for both improved production and asset management alike.<br />
ACF, in partnership with the Food and Agriculture Organisation (FAO), 2 facilitated formation <strong>of</strong><br />
twelve farmer field school groups in 3 parishes <strong>of</strong> Lira (Opejal) and Oyam (Aceno, Oyoro) districts<br />
<strong>of</strong> the Lango sub-region. The programme ran from early January to the end <strong>of</strong> July <strong>2008</strong>, and<br />
coincided with two larger 12-month FSL programmes in the North. ACF’s FFS approach sought to<br />
facilitate experiential learning for empowered decision making on improved production, along the<br />
following set <strong>of</strong> core principles:<br />
Figure 2. Summary <strong>of</strong> farmer field school core principles 3<br />
Institutional<br />
Community<br />
• FFS shorten the times it takes to get research from • Empower farmers with knowledge and skills in farming<br />
station to adoption in farmer fields by involving farmers • Sharpen farmer ability in making logical decisions on<br />
in their own experimentation<br />
what works best for them, based on their own<br />
• Enhance the capacity <strong>of</strong> extension workers to serve as observations <strong>of</strong> experimental and validation plots<br />
technically skilled and group sensitive facilitators <strong>of</strong> • Promote group initiatives that are able to solve own<br />
farmer’s experiential learning.<br />
community problems and facilitate the work <strong>of</strong> other<br />
• Increase the competency <strong>of</strong> extension services to<br />
development players by providing a demand driven<br />
provide farmer education that responds more effectively system<br />
to local res<strong>our</strong>ces and conditions<br />
• Establish high level <strong>of</strong> networking by groups to handle<br />
• Contribute information on the replicability and<br />
emerging follow up with community activities [marketing,<br />
effectiveness <strong>of</strong> FFSs as an alternative and sustainable res<strong>our</strong>ce mobilization processing, contract farming, etc]<br />
mechanism for extension service delivery<br />
The twelve groups contained a total <strong>of</strong> 320 members. All groups concentrated on agricultural<br />
production for both their commercial and study enterprises (although one initially wanted to<br />
establish a piggery for their commercial enterprise before realising that the programme grant<br />
component would be insufficient). Interestingly, not only did all twelve groups ultimately pursue<br />
crop production, but most concentrated on crops preferred for sale (groundnut and soy) more than<br />
consumption (pigeon pea):<br />
2 FAO letter <strong>of</strong> agreement 062/07; ACF reference D6C.<br />
3 FAO Uganda (2007) Trainer’s Guide for Farmer Field School Facilitators (draft).<br />
<strong>Action</strong> <strong>Against</strong> <strong>Hunger</strong> Uganda - 14 - Farmer Field School <strong>Evaluation</strong>
Figure 3. Summary <strong>of</strong> FFS groups, enterprises, and locations<br />
FFS<br />
Group<br />
Location<br />
Study<br />
Enterprise<br />
Composition<br />
Commercial<br />
Enterprise F M Total<br />
District<br />
Sub-<br />
County<br />
Parish Village<br />
1. Pur En Lonyo Lira Okwang Opejal Otikori Pigeon Pea Groundnut 11 14 25<br />
2. Too Ipur Lira Okwang Opejal Ogoro ‘A’ Pigeon Pea Groundnut 11 14 25<br />
3. Adag Ajonga Lira Okwang Opejal Otikori Groundnut Pigeon Pea 14 11 25<br />
4. Kok Can Ikweri Lira Okwang Opejal Goi ‘A’ Groundnut* Groundnut 18 7 25<br />
5. Can Opwonya Oyam Minakulu Aceno MTI Groundnut Groundnut 18 12 30<br />
6. Apit Pe Ool Oyam Minakulu Aceno Akuki East Groundnut Soy 16 14 30<br />
7. Odiro Oyam Minakulu Aceno Odiro Groundnut Soy 16 14 30<br />
8. Acan Dano Oyam Minakulu Aceno Coo Pe Bwone ‘B’ Groundnut Soy 12 18 30<br />
9. Ocan Mito Kony Oyam Minakulu Oyoro Abalo Koti Groundnut Soy 16 9 25<br />
10. Acan Pe Nino Oyam Minakulu Oyoro Palwo Groundnut Groundnut 19 6 25<br />
11. Can Coa Oyam Minakulu Oyoro Pede Groundnut Groundnut 12 13 25<br />
12. Acan Kwette Oyam Minakulu Oyoro Opur Groundnut Groundnut 10 15 25<br />
Total 173 147 320<br />
*Plus pigeon pea, millet, green gram, and cow pea<br />
The ACF programme worked with the farmer field school groups until the FAO letter <strong>of</strong> agreement<br />
expired on 31 July <strong>2008</strong>, unable to remain engaged for a complete production cycle. All groups<br />
had crops standing at the time, and practices related to post-harvest handling were discussed but<br />
not implemented with facilitators. Production practices promoted during the programme covered<br />
land preparation, seed selection, planting, weeding, and pest control – after which more general<br />
discussions were held on post-harvest practices all the way to storage and sale. Participant<br />
training also included a range <strong>of</strong> documentation practices like financial bookkeeping, group<br />
constitutions and meeting minutes, enterprise pr<strong>of</strong>itability and risk analysis, and work plans.<br />
Members <strong>of</strong> the FAO Emergency Relief and Rehabilitation Coordination Unit have commended<br />
ACF on the quality <strong>of</strong> its FFS programme and the unspecified “something different” they saw in the<br />
ACF groups when visiting a range <strong>of</strong> FFS sites supported by various NGOs. 4<br />
Continued programming based on the farmer field school approach remains a high priority for ACF<br />
Uganda. It is anticipated that continued mobilisation <strong>of</strong> groups around shared enterprises will<br />
continue on a larger and longer scale. Such programming might integrate not only with other ACF<br />
malnutrition, water, sanitation, and hygiene activities but also with complementary approaches<br />
from other ACF FSL programming and monitoring in Uganda. An internally-funded evaluation <strong>of</strong> its<br />
<strong>2008</strong> FFS programme therefore <strong>of</strong>fers ACF an opportunity to capitalise on its experience to date<br />
and determine how best to increase quality and impact in subsequent programmes.<br />
2. The ACF Farmer Field School <strong>Evaluation</strong><br />
Based on enc<strong>our</strong>aging participant feedback and positive reports from FAO on the relative strengths<br />
<strong>of</strong> the ACF farmer field schools, ACF plans to expand the approach in Lango sub-region during<br />
2009 and to pilot the initiative in Acholi sub-region (probably coinciding with the first agricultural<br />
season <strong>of</strong> 2010 but potentially early enough for the second season <strong>of</strong> 2009). Before scaling up,<br />
however, an evaluation is beneficial to review achievement and refine the approach.<br />
Increased programmatic quality and impact also require strengthened field staff capacity, an<br />
ongoing priority for the FSL unit. The evaluation is as much about staff capacity building as it is<br />
programme development, and builds upon internal training completed throughout the second half<br />
<strong>of</strong> <strong>2008</strong> and a two-week workshop that involved all Uganda FSL staff in February 2009.<br />
4 Personal communication with several members <strong>of</strong> the FAO Emergency Relief and Rehabilitation Coordination Unit,<br />
March 2009.<br />
<strong>Action</strong> <strong>Against</strong> <strong>Hunger</strong> Uganda - 15 - Farmer Field School <strong>Evaluation</strong>
2.1 Objectives<br />
The farmer field school evaluation seeks to achieve the following objectives:<br />
1. To evaluate the FFS methodology and process for 12 groups in Minakulu and Okwang subcounties.<br />
2. To evaluate FFS impact on household food security and livelihoods, according to qualitative<br />
and quantitative data analysis generated through questionnaires, focus groups, and interviews.<br />
3. To identify existing strengths and weaknesses in ACF FFS implementation and M&E.<br />
4. To involve ACF staff in an applied learning opportunity and identify training needs for improved<br />
FFS implementation and M&E.<br />
5. To develop specific recommendations for improved FFS programming in 2009.<br />
The evaluation analyses the FFS programme according to its core components: changes in<br />
practices, production, and assets – and whether combined these have contributed to strengthened<br />
participant household food security and livelihoods. However there are very little data available to<br />
correspond with this level <strong>of</strong> specificity, as no logical framework was prepared for the programme<br />
as a management or monitoring tool, primarily because it was not required by FAO. Monitoring<br />
concentrated primarily on crop growth, and all data were forwarded to FAO for aggregation. Most<br />
<strong>of</strong> the indicator analysis – and therefore the evaluation itself – is based on qualitative assessment<br />
conducted during fieldwork and on a framework designed specifically for the evaluation. The<br />
discussion therefore also emphasises how future FFS programmes can be monitored and<br />
evaluated. FAO was however able to fill part the quantitative data gap, providing ACF with all data<br />
pertaining to its FFS participants (and a control group <strong>of</strong> non-participants in the same<br />
communities). 5 ACF was able to build on these data through primary data collection during<br />
fieldwork to increase the evaluation scope. 6<br />
Considering the breadth <strong>of</strong> data available but never strategically utilised, the evaluation has tried to<br />
compile the most salient (primary and secondary) data to ensure it remains consistently accessible<br />
and on the programmatic radar. Otherwise, more longitudinal evaluation <strong>of</strong> the farmer field school<br />
programme over several years could lose the benefit <strong>of</strong> comparative analysis and iterative<br />
learning. Now that this information is more consolidated than previously, everything can be<br />
revisited in subsequent programme planning to focus on which specific data, ideas,<br />
recommendations deserve greater attention and which can be discarded.<br />
2.2 Methodology<br />
Although ACF intended from the onset to evaluate its <strong>2008</strong> farmer field school programme, its<br />
methodology did not begin to form until several months after the programme concluded. This<br />
meant that data collection during implementation was not focused toward a specific analytical<br />
purpose. That the evaluation would be an applied learning opportunity for FSL field staff was clear,<br />
as was the broad intent to utilise rapid rural appraisal (RRA) tools. The evaluation terms <strong>of</strong><br />
reference (Appendix 5) ultimately centred on trying to consolidate a range <strong>of</strong> FAO and ACF data<br />
with a better qualitative understanding <strong>of</strong> the dynamics behind the numbers so that lessons could<br />
be learned and recommendations articulated. There were flaws in the datasets, but they<br />
nonetheless provided direction for the evaluation fieldwork and staff discussions that coincided.<br />
A flow diagram synthesises the evaluation approach (Appendix 6). After analysing the quantitative<br />
data available from the FAO FFS evaluation and, to a lesser extent, from ACF programme<br />
monitoring, information needs began to emerge. A decision was made to minimise the amount <strong>of</strong><br />
5 FAO Uganda (<strong>2008</strong>) <strong>Evaluation</strong> <strong>of</strong> the Farmer Field School Approach in Uganda. Their data collection and analysis<br />
covers all implementing NGOs and includes FFS participants and an equal number <strong>of</strong> non-participant counterparts in<br />
Kaberamaido, Amuria, Lira, Gulu, Amuru, and Kitgum districts.<br />
6 All <strong>of</strong> the FAO data reported here were obtained directly from their monitoring unit. The data were part <strong>of</strong> FAO’s <strong>2008</strong><br />
evaluation <strong>of</strong> the FFS approach in Uganda, but are disaggregated for the 12 groups facilitated by ACF. In the few cases<br />
where specific data are reproduced from the FAO <strong>2008</strong> FFS evaluation report (see previous footnote), the specific table<br />
and page numbers are provided.<br />
<strong>Action</strong> <strong>Against</strong> <strong>Hunger</strong> Uganda - 16 - Farmer Field School <strong>Evaluation</strong>
new data collected and instead to try making better sense and use <strong>of</strong> existing data. Identifying<br />
gaps and excesses itself is part <strong>of</strong> the evaluation so that subsequent design, monitoring, and<br />
evaluation can capitalise on experience. With the staff capacity building objective in mind, the<br />
evaluator developed a semi-structured discussion guide as the primary field tool to counteract the<br />
habit <strong>of</strong> closed formats and limited qualitative probing (Appendix G). Ongoing ACF workshops with<br />
FSL staff in <strong>2008</strong> were reinforced by including in the evaluation fieldwork RRA tools relatively well<br />
practiced but never applied. Another decision was made to visit all twelve <strong>of</strong> the FFS groups rather<br />
than sample across or within them. And because the twelve groups are clustered in three separate<br />
parishes (<strong>of</strong> two sub-counties), it seemed that each bunch could <strong>of</strong>fer its own subset <strong>of</strong> perspective<br />
within the whole. By the end <strong>of</strong> fieldwork the team had spoken with approximately 165 members<br />
from a total 320 (half <strong>of</strong> all programme participants) and all but one <strong>of</strong> the implementing FFS ACF<br />
FSL staff.<br />
On this basis the 12 groups were divided according to their three parishes, f<strong>our</strong> per parish cluster.<br />
One <strong>of</strong> the total f<strong>our</strong> RRA tools was used with each group in the cluster, until all f<strong>our</strong> groups in the<br />
parish were met and discussion around all f<strong>our</strong> tools completed. The same process was repeated<br />
with the other two parish clusters <strong>of</strong> f<strong>our</strong> FFS groups each. The discussion guide was used<br />
throughout as the backbone for each <strong>of</strong> the twelve focus groups convened – usually two per day<br />
for at least two h<strong>our</strong>s or more. The RRA tools were sequenced:<br />
• Wealth ranking to understand perceptions <strong>of</strong> relative wealth and how they might have been<br />
reflected in programme targeting<br />
• Seasonal calendar to see production cycles and input needs and judge how well programming<br />
aligned<br />
• Proportional piling to investigate household food, income, and expenditure and suggest what<br />
types <strong>of</strong> changes might be expected from effective FFS programming<br />
• Pairwise ranking to explore relative severity <strong>of</strong> coping strategies and try to link these ideas<br />
with those about vulnerability and seasonality<br />
Two <strong>of</strong> the three ACF FFS facilitators <strong>of</strong> <strong>2008</strong> were available to participate in the evaluation, but<br />
neither able to remain for its duration. One FSL <strong>of</strong>ficer and one field monitor joined the team for the<br />
entire period for greater consistency, and were joined by a counterpart FSL Officer from the ACF<br />
South Sudan programme to add a regional dimension to the capacity building aspect. Significant<br />
exchange <strong>of</strong> ideas occurred within the team, with daily vehicle time spent debating gender roles<br />
and mobilisation dynamics in Uganda and Sudan. The visiting FSL Officer left with a wealth <strong>of</strong><br />
insight for FFS design and implementation planned for the immediate future.<br />
Full day workshops were convened with all team members both before and after the fieldwork. The<br />
first introduced the methodology, reviewed the tools, and finalised the discussion guide and work<br />
plan with team input on prepared drafts. The final workshop assembled the team’s collective<br />
conclusions and recommendations while trying to consolidate the entire learning process. The<br />
workshop was structured according to the sections <strong>of</strong> the discussion guide, which themselves were<br />
the same structure as the evaluation framework indicators. This evaluation report too is structured<br />
according to the newly designed evaluation framework. The report begins with output (programme<br />
performance) then objective (programme impact) level indicators. Findings are listed thematically<br />
in the Executive Summary, followed by conclusions and recommendations. The evaluation has<br />
deliberately adhered throughout to its structured framework and fieldwork methodology to reinforce<br />
within the team and ACF FSL unit in general the message <strong>of</strong> good indicators and a premeditated<br />
approach to data collection and use. This document illustrates how a planning tool and final report<br />
can share the same structure, and how better monitoring can help improve the link. The report tries<br />
to consolidate learning and planning processes at field and <strong>of</strong>fice levels. It is ambitious, intending<br />
to provide a critical review <strong>of</strong> the <strong>2008</strong> FFS programme with both baseline and guidance for future<br />
FSL programming. Final analysis and writing were completed by the evaluator without the team for<br />
shortage <strong>of</strong> time; responsibility for content and quality is his.<br />
<strong>Action</strong> <strong>Against</strong> <strong>Hunger</strong> Uganda - 17 - Farmer Field School <strong>Evaluation</strong>
2.3 Limitations<br />
A range <strong>of</strong> limiting factors has influenced the evaluation and its final product, but not to the point <strong>of</strong><br />
undermining the team’s confidence in its findings. The entire evaluation (from design to report<br />
writing) was conducted in 26 days, resulting in a demanding pace throughout. The team usually felt<br />
rushed, constantly trying not to fall behind schedule. That said, there were numerous logistic<br />
delays coupled with routine waits as focus groups accumulated a quorum <strong>of</strong> more than half its total<br />
members. Although trained previously in the RRA tools (except wealth ranking), staff never had<br />
opportunity to apply them, resulting in periodic uncertainty or conversational drift away from the<br />
session objectives during some focus groups. Participants too were busy as first season rains<br />
commenced on the same day as the team’s preparatory workshop, meaning that many were<br />
preoccupied with opening land (typically by hand) and preparing to plant. Translation between<br />
participants and the evaluator added time and complexity to the discussions. Behind all <strong>of</strong> this, the<br />
quantitative secondary data from FAO and ACF both had inconsistencies and gaps that sometimes<br />
raised as many questions as they answered. Internally there is a dearth <strong>of</strong> programmatic<br />
documentation available for review, with all <strong>of</strong> the Lira Base <strong>2008</strong> hard copy FFS programme files<br />
already in storage. It similarly appears that no photographs <strong>of</strong> <strong>2008</strong> FFS programme participants,<br />
locations, or activities were taken for visual documentation. More time for methodological<br />
documentation <strong>of</strong> the RRA tool processes and lessons would also have been constructive for other<br />
practitioners.<br />
Despite these considerations the team remains confident in the validity <strong>of</strong> its analysis, and the<br />
evaluator in its process. The quantitative data by necessity were assumed to be reliable. The<br />
analysis remains largely concentrated at the FFS group level rather than with participant<br />
households, the result <strong>of</strong> both basing the fieldwork entirely around focus groups and timing it while<br />
no crops were standing meant individual gardens could not be visited to witness the extent to<br />
which particular practices have been applied and transferred since the programme concluded last<br />
year. In retrospect more time was needed for consulting team members directly as key informants<br />
and engaging them with the secondary data. More time with the team also would have enhanced<br />
the learning opportunity futher. A shorter report would have increased its programmatic relevance<br />
and accessibility to a wider range <strong>of</strong> staff and stakeholders.<br />
<strong>Action</strong> <strong>Against</strong> <strong>Hunger</strong> Uganda - 18 - Farmer Field School <strong>Evaluation</strong>
In the absence <strong>of</strong> a logframe for the FFS programme, the following framework was developed to<br />
structure data collection and analysis for the evaluation:<br />
Figure 4. ACF farmer field school evaluation framework (April 2009)<br />
Impact<br />
Performance<br />
Goal<br />
Objective<br />
Outputs<br />
Strategy<br />
To prevent<br />
malnutrition<br />
through an<br />
integrated<br />
community<br />
based approach<br />
to ACF Uganda<br />
programming<br />
To strengthen<br />
returnee<br />
household food<br />
security and<br />
livelihoods<br />
1. Improved<br />
production<br />
practices<br />
2. Increased<br />
domestic<br />
production<br />
3. Enhanced<br />
income<br />
generation<br />
and<br />
management<br />
capacity<br />
Indicator<br />
• Geographic and household targeting based on<br />
vulnerability analysis and integrated ACF criteria<br />
Report<br />
Section<br />
4.11<br />
• Participant food, income, and expenditure patterns<br />
improve<br />
4.2<br />
• Positive changes in group and household assets 4.3<br />
• Average household dietary diversity scores improve 4.4<br />
• Reduced number <strong>of</strong> months with inadequate household<br />
provisioning <strong>of</strong> food<br />
4.5<br />
• Improved coping strategy index scores 4.6<br />
• Effective ACF facilitators communicate programme<br />
practices and ethos<br />
4.7<br />
• Programme design and implementation reflect gender<br />
analysis<br />
4.8<br />
• Programme activities and inputs are seasonally<br />
appropriate<br />
4.9<br />
• Programme design is based on assessment and M&E<br />
planning<br />
4.10<br />
• Participant learning opportunities are appropriate and<br />
effective<br />
3.1.1<br />
• Group study plots are focal points for participatory<br />
experimentation and problem solving<br />
3.1.2<br />
• Commercial enterprise selection is based on a<br />
participatory and analytical process<br />
3.1.3<br />
• Participants demonstrate adoption and transmission <strong>of</strong><br />
production promoted practices<br />
3.1.4<br />
• Participant documentation capacity enhanced at group<br />
and individual levels<br />
3.1.5<br />
• Increased cultivated acreage increases 3.2.1<br />
• Increased production 3.2.2<br />
• Disease resistant cassava more prevalent in programme<br />
areas<br />
3.2.3<br />
• Increased marketing capacity <strong>of</strong> own production 3.3.1<br />
• Strengthened seed multiplication and marketing 3.3.2<br />
• Income s<strong>our</strong>ces diversified through value-addition 3.3.3<br />
• Increased group and individual savings 3.3.4<br />
• Improved access to and terms <strong>of</strong> credit 3.3.5<br />
<strong>Action</strong> <strong>Against</strong> <strong>Hunger</strong> Uganda - 19 - Farmer Field School <strong>Evaluation</strong>
3. Farmer Field School Programme Performance<br />
The evaluation <strong>of</strong> programme performance concentrates on indicators at output level in the logical<br />
framework, each <strong>of</strong> which is discussed separately in Sections 3.1 – 3.3 below.<br />
3.1 Improved Production Practices<br />
Improved practices are an essential component <strong>of</strong> the farmer field school approach. The ACF<br />
programme focused on agricultural practices relating to the study/commercial enterprises identified<br />
by participants. Promoted practices reflected the programme message that better land opening<br />
followed by improved crop management techniques (from planting through post-harvest handling)<br />
can increase yields, pr<strong>of</strong>its, and food/seed reserves. Improved practices were arguably the most<br />
important programme output, as the other outputs (improved production and asset management)<br />
depended first on the agronomic practices required to achieve them.<br />
Practices are difficult to quantify, however, particularly without crops standing at the time <strong>of</strong><br />
evaluation. That would have enabled the team to observe directly whether practices promoted<br />
during the FFS programme have transferred to individual gardens and whether they are still<br />
applied almost one year after the programme concluded. Better initial indicators about the outcome<br />
<strong>of</strong> training rather than simply the number <strong>of</strong> members trained also would have helped analyse<br />
changes more effectively. Many <strong>of</strong> these practices are overlapping or complementary (like<br />
documenting the specific planting quantities, techniques, and anticipated yields), but are discussed<br />
separately to try capturing issues and ideas unique to each. Literacy is also an important<br />
consideration for distinguishing between agronomic practices and documentation practices.<br />
The team concludes that the promoted practices were appropriate to the production context and<br />
programme ethos, and that most appear to have been embraced by participants to the point <strong>of</strong><br />
transferring them to individual household cultivation. Transmission <strong>of</strong> some practices, especially<br />
rows and spacing, also appears to be spreading to others who did not participate in the<br />
programme. But again, all <strong>of</strong> these conclusions have been drawn on the basis <strong>of</strong> discussion rather<br />
than direct observation or data. The greatest limitations in practice adoption are those dependent<br />
on literacy skills, namely record keeping and documentation. This will prove prohibitive toward the<br />
sustainability <strong>of</strong> these practices, and in some cases might even limit retention at the group level if<br />
some approaches are not improved in the future.<br />
3.1.1 Participant learning opportunities are appropriate and effective<br />
More use needs to be made <strong>of</strong> the group study plots and how participants themselves should lead<br />
the analytical learning process. All participants appreciate the value <strong>of</strong> the plots and how they are<br />
meant to test and promote particular practices. The ethos <strong>of</strong> farmer experimentation is not obvious,<br />
however, and appears to have been subsumed by the more general intention to increase<br />
participation (see Section 3.1.2 below for more specific points on study plot design). But more<br />
important is creating opportunities for participants (and non-participants alike) to identify and<br />
explore their own learning needs rather than being included in those specified and led by ACF<br />
staff. Participants appear to have been more involved in the study enterprise activities more than<br />
they designed or led them.<br />
Some <strong>of</strong> the documentation practices promoted in the programme are inaccessible to a probable<br />
majority <strong>of</strong> participants based on the literacy implicitly assumed by some <strong>of</strong> the tools. The<br />
pr<strong>of</strong>itability analysis and group business plan, for example, were the most regularly cited examples<br />
<strong>of</strong> tools participants were unable to use independently since the FFS programme concluded. The<br />
pr<strong>of</strong>itability analysis is in fact quite sophisticated and includes gross margin analysis (production<br />
costs, marketable yields, selling price, expected revenue, etc) and risk analysis (yield fluctuations,<br />
production cost changes, etc) – despite that these both require good numeracy skills. Participants<br />
suggested repeatedly that more refresher training is required, with more opportunities to reinforce<br />
messages and skills. Pr<strong>of</strong>itability analysis or enterprise selection could first be introduced to full<br />
groups so that everybody understands the purpose and content <strong>of</strong> the tool, but a smaller sub-group<br />
<strong>Action</strong> <strong>Against</strong> <strong>Hunger</strong> Uganda - 20 - Farmer Field School <strong>Evaluation</strong>
<strong>of</strong> participants could be the ones actually trained in using the tool. At the same time, the tools used<br />
for pr<strong>of</strong>itability analysis and enterprise selection need to be revisited to determine whether more<br />
accessible approaches are possible. Toward this, at the end <strong>of</strong> the final workshop, the evaluation<br />
team experimented on itself by trying two approaches to study crop selection using matrix scoring<br />
as a possible alternative to the more complex approach promoted by FAO (see Appendix 3). A<br />
final conclusion was not reached on the best tool or approach, but the team was convinced that the<br />
experiment <strong>of</strong>fered a good model for how enterprise selection could be more participatory and<br />
methodologically accessible in the future. The team is also convinced that more participatory<br />
approaches to analytical decision making will help ensure that similarly accessible approaches<br />
have a better chance <strong>of</strong> being replicated independently in the future. One group (Acan Dano) even<br />
said that they cannot remember the specific measurement required for groundnut rows and<br />
spaces. This sounded exaggerated at the time, but led the team to question whether more<br />
emphasis could be given to ‘local’ measurements in the future (steps, hands, arm lengths, etc)<br />
alongside the usual ‘scientific’ units like centimetres and kilograms.<br />
The timing <strong>of</strong> group meetings and training is also an important factor influencing the impact <strong>of</strong><br />
intended learning opportunities. Stated female/male preferences for meeting/training times reflect<br />
gender divisions <strong>of</strong> lab<strong>our</strong>, with women usually indicating that afternoons were better (between<br />
digging in their garden and preparing household food) and men generally suggesting that mornings<br />
were better. The rationale for these preferences was not explored for lack <strong>of</strong> time, but would be<br />
interesting to understand for future planning. Figure 5 summarises the preferred versus actual<br />
meeting times for the 12 FFS groups, suggesting that women’s preferences were met more than<br />
men’s.<br />
Figure 5. Comparison <strong>of</strong> preferred and actual group meeting times<br />
Group Female Preference Male Preference Actual Meeting Time<br />
Pur En Lonyo 11:00 – 14.00 10:00 – 14:00 10:00 – 13:30<br />
Too Ipur 07:00 – 09:00 08:30 – 10:00 10:00 – 12:00<br />
Adag Ajonga 14:00 – 15:00 11:00 – 12:00 12:00 – 13:00<br />
Kok Can Ikweri 14:00 – 16:00 10:00 – 13:00 14:00 – 16:00<br />
Can Opwonya 14:00 – 15:00 10:00 – 11:00 11:00 – 12:00<br />
Apit Pe Ool 11:00 – 12:00 11:00 – 12:00 11:00 – 12:00<br />
Odiro 14:00 – 16:00 14:00 – 17:00 14:00 – 16:00<br />
Acan Dano 14:00 – 16:00 10:00 – 12:00 14:00 – 16:00<br />
Ocan Mito Kony 14:00 – 16:00 13:00 – 16:00 14:00 – 17:00<br />
Acan Pe Nino 13:00 – 15:00 11:00 – 13:00 14:00 – 17:00<br />
Can Coa 14:00 – 15:00 12:00 – 13:00 14:00 – 15:00<br />
Acan Kwette 14:00 – 15:00 11:00 – 12:00 14:00 – 15:00<br />
In addition to meetings tending toward preferred female times, staff all agree that male participants<br />
had poorer attendance than female, regardless whether the group was predominantly male or<br />
female. (The team was unable to locate the group attendance reports to validate this assumption).<br />
Staff and participants alike agree that women are in general more reliable, to which staff add that<br />
the more female members a group has the better its chances <strong>of</strong> success. Based on reports <strong>of</strong><br />
better female attendance than men, women had more opportunities to engage with the programme<br />
and its opportunities for facilitated learning. Women nonetheless agreed that all participants should<br />
be involved in all training components without trying to specify which are more appropriate to which<br />
sex, despite that most activities are typically divided along predictable gender lines. The team<br />
explored this theme in greater detail during its final workshop and established the following<br />
summary <strong>of</strong> gendered roles in agriculture:<br />
<strong>Action</strong> <strong>Against</strong> <strong>Hunger</strong> Uganda - 21 - Farmer Field School <strong>Evaluation</strong>
Figure 6. Summary <strong>of</strong> the gender division <strong>of</strong> lab<strong>our</strong> in agriculture<br />
Activity<br />
Land preparation by hand<br />
Both<br />
Land preparation with traction<br />
Men<br />
Seed sorting<br />
Women<br />
Planting<br />
Women<br />
Weeding<br />
Women<br />
Pest control with spray<br />
Both, more men<br />
Harvest<br />
Women<br />
Drying<br />
Women<br />
Winnowing<br />
Women<br />
Packing and storage<br />
Women<br />
Marketing<br />
Men<br />
Typically Responsible<br />
These are generalisations, but nonetheless informative when considering how training and related<br />
messages will be applied in daily life once the programme concludes. There is also the obvious<br />
point that men tend to be more involved when the task becomes more techno-physical (such as<br />
traction or spraying) or more directly related to cash (such as marketing). More female contribution<br />
to marketing could suggest greater programme impact on women, but this has not yet been<br />
explored. Along these lines, in Opejal, the Pur En Lonyo group told how weeding used to be an<br />
exclusively female role. But now that row planting has made weeding easier, men have become<br />
more involved in weeding. More investigation would help draw a more concrete conclusion, but the<br />
FFS group specifically suggested that the production practice promoted in the programme (in this<br />
case row planting) had a direct effect on the gender division <strong>of</strong> lab<strong>our</strong> now that men contributed<br />
more to weeding. More investigation would also help determine whether this change affected<br />
women’s ability to identify or address other gender needs.<br />
Aside from the above considerations, more specific indicators are required for demonstrating the<br />
effectiveness <strong>of</strong> skill training or transfer. Monitoring efforts to date only capture the number <strong>of</strong><br />
people present at a session, without <strong>of</strong>fering any insight into the subsequent engagement or effect<br />
<strong>of</strong> participation. Future training and its evaluation will need to consider anticipated outcomes more<br />
specifically, and how these can be measured.<br />
3.1.2 Group study plots are focal points for participatory experimentation<br />
The study plots tend to focus on a single production issue identified by participants, usually<br />
comparing differences between only one to three variables. All but one team members agree,<br />
however, that farmers have the interest and capacity for additional comparisons. The groundnut<br />
plots, for example, were usually divided into three sections to compare different approaches to pest<br />
control: chemical spraying, onion intercropping, and no pest management inputs. In all cases,<br />
however, the plots were planted entirely in properly spaced rows without any comparison <strong>of</strong> how<br />
row planting can increase yields limited by broadcasting. That is, even though the study plot focus<br />
was on pest control, additional comparison <strong>of</strong> planting techniques could have been included to<br />
reinforce the benefits that are promoted but never ‘proven’ through direct farmer experimentation.<br />
Participants have in fact embraced row planting as a direct result <strong>of</strong> the programme (and claim to<br />
use it in their individual gardens as well), and all agree that the benefits were obvious from both the<br />
study and commercial plots. Nonetheless the study plots could also be used to help quantify yield<br />
differences based on planting techniques without compromising the primary objective <strong>of</strong> comparing<br />
pest control techniques. Figure 7 compares groundnut study plot possibilities:<br />
<strong>Action</strong> <strong>Against</strong> <strong>Hunger</strong> Uganda - 22 - Farmer Field School <strong>Evaluation</strong>
Figure 7. Comparison <strong>of</strong> actual and potential groundnut study plot layouts<br />
Standard programme groundnut study plot design<br />
Possible groundnut study plot design<br />
Planting with scattered seed<br />
Chemical<br />
spray<br />
Intercropped<br />
onion<br />
Control<br />
(no inputs)<br />
Chemical<br />
spray<br />
Intercropped<br />
onion<br />
Control<br />
(no inputs)<br />
Planting in rows with spacing<br />
Entire study plot area planted with proper rows<br />
and spacing<br />
Same three pest control methods compared, but<br />
with additional comparative analysis <strong>of</strong> the<br />
different effects <strong>of</strong> spacing and rows<br />
Despite inability to verify, the team has no doubt that the practices promoted through the study<br />
(and commercial) plots for rows and spacing have enjoyed widespread adoption in the individual<br />
household gardens <strong>of</strong> participants. Everybody was convinced <strong>of</strong> the benefits, even if they did not<br />
have programmatic opportunities to quantify or compare differences in yield, for example between<br />
scattered and spaced seed.<br />
This is only one example. The study plot ultimately should reflect specific problems identified by<br />
each FFS group, and therefore its design cannot be prescribed here for all possibilities. In other<br />
locations, for example, the groundnut study plot compared only the difference between scattered<br />
and spaced planting, without any investigation into pest control. Another group, for reasons that<br />
were not entirely clear during fieldwork, subdivided their study plot by five to compare performance<br />
<strong>of</strong> three groundnut varieties and two pigeon pea varieties, without any analysis <strong>of</strong> planting<br />
techniques or pest control. The point is that experimentation itself appears lower than what could<br />
be possible, and therefore needs to be improved. Depending on the type <strong>of</strong> crop and problem,<br />
other study plot combinations could include land preparation (hand hoes versus traction), seed<br />
varieties, fertilisation – or different combinations <strong>of</strong> the above. Increased experimentation will<br />
however require increased facilitation to ensure that participants do not lose track <strong>of</strong> causality and<br />
which variables are being tested.<br />
3.1.3 Commercial enterprise selection is participatory and analytical<br />
Like the development <strong>of</strong> group study plots, the degree <strong>of</strong> member participation and leadership in<br />
selecting the commercial enterprise should be an indicator <strong>of</strong> whether the FFS programme<br />
achieved the participatory and sustainable practices it promotes. It was telling, however, that none<br />
<strong>of</strong> the groups was able to produce its business plan or pr<strong>of</strong>itability analysis for review during the<br />
evaluation. There is no doubt that participants can select a commercial enterprise on the basis <strong>of</strong><br />
considering a range <strong>of</strong> criteria, as they do every year when determining which crops and varieties<br />
to cultivate. However it appears that the programme has had limited influence on strengthening the<br />
commercial enterprise selection process or the criteria used therein. Focus group respondents<br />
could explain the decision making process they employed during the <strong>2008</strong> second season (after<br />
the FFS programme had concluded) and the considerations they were currently weighing as 2009<br />
first season planting approached, such as cost, sale value, and climatic risk. Such decisions were<br />
made on knowledge and experience, even if less methodical than the pr<strong>of</strong>itability and business<br />
plan promoted in the programme. But if by using the FAO pr<strong>of</strong>itability analysis model ACF is<br />
promoting a tool that will not be adopted by the group, then the approach should be reconsidered.<br />
The fact that so few could explain the pr<strong>of</strong>itability analysis in detail also suggests that they might<br />
not have been thoroughly engaged in the process, or more generally that they did not consider it<br />
meaningful enough to remember or replicate. It was for this reason that the evaluation team began<br />
to explore a possible matrix scoring approach to pr<strong>of</strong>itability analysis (discussed above in Section<br />
3.1.1), given the apparent success <strong>of</strong> the RRA tools to include all interested members in discussion<br />
<strong>Action</strong> <strong>Against</strong> <strong>Hunger</strong> Uganda - 23 - Farmer Field School <strong>Evaluation</strong>
without excluding on the basis <strong>of</strong> literacy. As stated, a final decision was not reached about how<br />
best to improve the accessibility and replicability <strong>of</strong> pr<strong>of</strong>itability analysis, but it was clear that the<br />
<strong>2008</strong> approach was not entirely appropriate in that nobody met during fieldwork was able to<br />
summarise the process or verify that anybody in their group could lead it independently in the<br />
future. The ACF facilitators endeav<strong>our</strong>ed to make it as participatory as possible but were perhaps<br />
constrained by the inherent limitations <strong>of</strong> the approach. The lack <strong>of</strong> available programme<br />
documentation further challenged the ability to understand in detail what happened and what was<br />
recorded. Regardless whether matrix scoring or another approach is used, participants should be<br />
able to identify collective ventures through participatory and transparent processes, and should be<br />
able to document their investment, pr<strong>of</strong>it, loss, etc. Success in this direction will also enc<strong>our</strong>age<br />
greater gender equity in the process through more conversational inclusion and less literacy<br />
exclusion.<br />
But aside from the identification process, the commercial enterprises themselves provided an<br />
important contribution to the programme. For one, all utilised the full scope <strong>of</strong> agronomic practices<br />
promoted in the programme. While there were no commercial control plots against which practices<br />
could be compared, facilitators nonetheless worked with participants to identify the apparent<br />
differences in pest control effectiveness, ease <strong>of</strong> weeding, informal growth monitoring, and<br />
anticipated yield. The commercial plot also provided additional incentive to mobilise the group<br />
around a shared purpose. The plots additionally contributed to reinforcing use <strong>of</strong> the group bank<br />
account and to distributing cash and seed pr<strong>of</strong>its among the group for household use.<br />
3.1.4 Participants demonstrate adoption and transmission <strong>of</strong> practices<br />
Like the impact <strong>of</strong> training, this indicator is difficult to quantify and evaluate – especially since the<br />
evaluation was conducted without benefit <strong>of</strong> standing crops. Without the benefit <strong>of</strong> direct<br />
observation the team was forced to challenge participants with specific questions about practices<br />
promoted during the FFS programme and gauge their response. This was by no means ideal.<br />
Nonetheless there were consistently correct responses and usually unanimous agreement about<br />
what people claimed they learned and subsequently applied as a result <strong>of</strong> the programme. The<br />
main practices promoted during the programme and discussed during the evaluation were land<br />
preparation by traction, planting with rows and spacing, number <strong>of</strong> seeds per hole, pest control,<br />
and weeding.<br />
Even during the second season <strong>of</strong> <strong>2008</strong>, most participants claimed to have applied the promoted<br />
practices in their home gardens despite that the FFS facilitator was no longer active in their area.<br />
Interestingly, the only exception identified during the fieldwork was a man from the Pur En Lonyo<br />
group who explained that he was convinced <strong>of</strong> the benefits <strong>of</strong> rows and spacing but has had to<br />
continue scattering seed because he cannot afford to pay the additional lab<strong>our</strong> requirements <strong>of</strong><br />
promoted planting techniques. This corroborates the prevailing FSL team understanding that lack<br />
<strong>of</strong> available lab<strong>our</strong> in the household (available without fee) can increase vulnerability to food<br />
insecurity. It is nonetheless possible that a cost benefit analysis <strong>of</strong> scattered seeding versus proper<br />
rows and spacing could assist farmers make decisions in the future, or that other FFS participants<br />
could assist such farmers in need <strong>of</strong> lab<strong>our</strong>.<br />
Transmission <strong>of</strong> these same practices to non-participants was also reported throughout the<br />
evaluation but could not be proved. Many <strong>of</strong> the groups described how they invited neighb<strong>our</strong>s to<br />
visit the study plot, how they shared their experience with the new techniques, and in some cases<br />
even invited others on harvest day so that they could witness the results for themselves. An easy<br />
solution could be to rely on easier output indicators on the number <strong>of</strong> neighb<strong>our</strong> visits, open days,<br />
etc. However this would not answer the more seminal question <strong>of</strong> whether these formal or informal<br />
exchanges are enc<strong>our</strong>aging others to modify production behavi<strong>our</strong>.<br />
On the whole, however, comparing ACF FFS participants with non-participants in the same<br />
locations indicates that the programme succeeded in promoting two <strong>of</strong> its central practices, proper<br />
spacing and row planting:<br />
<strong>Action</strong> <strong>Against</strong> <strong>Hunger</strong> Uganda - 24 - Farmer Field School <strong>Evaluation</strong>
Figure 8. Planting practices <strong>of</strong> programme participants and control group<br />
Practice ACF FFS Participant (%) Control Group (%)<br />
Row planting 92 67<br />
Proper spacing 92 8<br />
S<strong>our</strong>ce: FAO evaluation data<br />
3.1.5 Documentation capacity enhanced at group and individual levels<br />
Literacy is a key issue in relation to documentation capacity, as is the distinction between group<br />
and individual level practices. All <strong>of</strong> the groups were requested to bring their full set <strong>of</strong> FFS<br />
documentation to the focus group but only half complied, so not all records could be reviewed<br />
during the fieldwork. Of the group documents reviewed during the evaluation (usually cash<br />
contributions, meeting attendance and minutes, constitutions, member lists, and visitor books), all<br />
were organised, clearly written, and in good physical condition. In most cases, the meeting and<br />
cash records were still being maintained by the group, even though the FFS programme concluded<br />
eight months ago (although perhaps only half <strong>of</strong> the individuals directly asked knew the current<br />
balance <strong>of</strong> their group’s bank account). The continued prevalence <strong>of</strong> cash flow record keeping<br />
nonetheless makes sense when considering how clear financial records can help maintain group<br />
cohesion by increasing transparency and reducing suspicion. These are not concerns for an<br />
individual farmer at household level, however, and probably explain in part the very low quality <strong>of</strong><br />
individual records reported by FAO (factoring too for literacy).<br />
According to the FAO data summarised in Figure 9 below, an approximately equal percentage <strong>of</strong><br />
ACF FFS group members maintain household level records compared with the national FFS<br />
average. Two prominent differences are however apparent from the data. The first is that despite<br />
the inherently equal incidence <strong>of</strong> record keeping, the quality <strong>of</strong> ACF FFS participant records<br />
appears below the national averages. More significant, perhaps, is that record keeping appears to<br />
be far less common for non-participants in the ACF areas than for the national average reported by<br />
FAO. If record keeping is so uncommon in the ACF areas, then even the reported 94 percent <strong>of</strong><br />
ACF participant records determined ‘partial/incomplete’ might nonetheless suggest a programme<br />
accomplishment. In the control group, for example, only 5 percent <strong>of</strong> households keep records.<br />
Participant records may have been equally absent prior to the FFS programme, and partial records<br />
are an improvement over no records. In fact, the ACF sample reports that the main reason given<br />
by participants for lack <strong>of</strong> records or poor quality was that they were ‘too complicated’; most nonparticipants<br />
by comparison responded that they were ‘not trained’ in record keeping or that there is<br />
‘no need’ (the possible responses did not, however, include ‘not literate’ or ‘unable’).<br />
Figure 9. Comparison <strong>of</strong> household record keeping and quality<br />
ACF (%) FAO (%)<br />
Participants Control Participants Control<br />
Proportion <strong>of</strong> HHs that keep records 72 5 70 31<br />
Scanty 6 * 41 58<br />
Quality <strong>of</strong> those<br />
Partial/incomplete 94 * 38 33<br />
records<br />
Comprehensive 0 * 21 9<br />
*Incomplete data<br />
S<strong>our</strong>ce: FAO (<strong>2008</strong>) Table 20, pg 23<br />
Despite the generally good quality <strong>of</strong> FFS group records discussed above, this conclusion is limited<br />
to the more straightforward documents like cash flows and meetings. Only one group was able to<br />
show the team their pr<strong>of</strong>itability analysis from last year, for example, or to produce their business<br />
plan, sub-county registration certificate, programme budget, or in some cases even the specific<br />
amount <strong>of</strong> seed they planted and harvested. This surely influences the transparency <strong>of</strong> group<br />
documentation, which in turn is likely to contribute to less household level adoption as well.<br />
3.2 Increased Domestic Production<br />
Alongside improved practices throughout the production cycle is the guiding intent that these<br />
contribute directly to increased yields and, by extension, pr<strong>of</strong>its and stores. Households are by no<br />
<strong>Action</strong> <strong>Against</strong> <strong>Hunger</strong> Uganda - 25 - Farmer Field School <strong>Evaluation</strong>
means subsistence producers, nor are they apparently striving for this. Households in the<br />
programme areas are integrated with local markets and demonstrate complex approaches to<br />
juggling production, consumption, and sale. This is best exemplified by the fact that almost all FFS<br />
group activities in <strong>2008</strong> (the commercial and study enterprises) were dedicated to crops that<br />
generally are sold to purchase food. Increased production therefore does not in itself mean<br />
increased food security because <strong>of</strong> more food grown. Rather, increased production supports<br />
increased access to food through both own production and market purchase alike.<br />
Like the practices discussed in Section 3.1, quantification for evaluation is hampered by insufficient<br />
or inadequate baseline data. Analysis here therefore is more qualitative than preferred, but<br />
nonetheless provides guidance for subsequent programme design and more refined indicators in<br />
the future. The team’s conclusions on improved production are in cases entirely by proxy, the<br />
assumption that the new practices adopted will lead to commensurate production gains. And even<br />
if there were baseline data available to compare production differences <strong>of</strong>, for example, broadcast<br />
versus spaced planting, all <strong>of</strong> the groups experienced various degrees <strong>of</strong> crop failure from their<br />
commercial and study plots due to climatic factors beyond programmatic influence. Agriculturally,<br />
the team therefore concludes that production increases can be expected – but not proved – as a<br />
result <strong>of</strong> the apparently widespread adoption <strong>of</strong> improved practices. Other shortcomings were also<br />
identified in the programme’s influence on improved production. One example is that the<br />
incomplete alignment between the production cycle and the programme cycle left farmers with<br />
crops standing and insufficient guidance on post-harvest handling. Complementary opportunities to<br />
increase production further through cassava and goat multiplication were also missed. The<br />
planned combination <strong>of</strong> traction, training, cassava, and goats ultimately would have increased<br />
programme impact at household level more than what was achieved in <strong>2008</strong>.<br />
3.2.1 Increased cultivated acreage<br />
The prevailing wisdom about northern Uganda is that returnee households still cultivate less land<br />
than the total they have available to them due to insufficient capital or inputs. ACF Uganda has<br />
included acreage in its monitoring <strong>of</strong> several FSL programmes over the last few years, however<br />
there is no known s<strong>our</strong>ce <strong>of</strong> both baseline and final acreage available for any programme,<br />
including the farmer field schools, upon which conclusive statements can be drawn. For the FFSs,<br />
the only ACF data available for acreage is that the average land opened for household cropping (in<br />
first season <strong>2008</strong>) was 2.27 acres. Unfortunately there are no known data available to compare<br />
this average with the preceding or subsequent year in order to extrapolate a trend.<br />
There are nonetheless indications that the FFS programme has supported acreage increases. The<br />
study and commercial plots <strong>of</strong> all 12 groups were on previously unopened land prepared<br />
specifically for the programme. Study plots were only half an acre, but commercial plots were<br />
between 1.5 and 4 acres. These amounts are comparatively small when considering a total 320<br />
participants, but are increases nevertheless.<br />
The programme facilitated less <strong>of</strong> an acreage increase than it could have if implemented fully to<br />
plan, in that none <strong>of</strong> the groups was able to utilise animal traction to open their group or individual<br />
plots (discussed further alongside other seasonality issues in Section 4.9). Every group should<br />
have received a pair <strong>of</strong> oxen and a plough. The oxen were delivered after planting had concluded,<br />
too late for study/commercial plot land opening; the ploughs to date have not yet been received<br />
from FAO. More groups would have been able to open more land if both bulls and ploughs had<br />
been delivered on time for first season land preparation typically done between January and March<br />
(depending on rain and intended crop). Oxen were received in May, however, so even if ploughs<br />
had been included it would have been too late to influence programme performance. With greater<br />
access to animal traction through the FFS programme, increased acreage would probably have<br />
included individual gardens as well, particularly if delivered and trained early in the year. In fact,<br />
other ACF programming with traction in the North has found that groups generally rent their<br />
animals to other households in the community in exchange for cash (based on land area). Not only<br />
does this further increase the amount <strong>of</strong> land opened, but also creates a new income s<strong>our</strong>ce for<br />
<strong>Action</strong> <strong>Against</strong> <strong>Hunger</strong> Uganda - 26 - Farmer Field School <strong>Evaluation</strong>
group members. Such benefits may accrue to the <strong>2008</strong> FFS members in time, but realistically<br />
could have been achieved during the programme period.<br />
The ACF FAO data shed contradictory light on the question <strong>of</strong> whether increased acreage was<br />
achieved through the programme. Their aggregated data suggest that 95 percent <strong>of</strong> FFS<br />
participants enjoyed an increase in cultivated acreage, compared with merely 8 percent <strong>of</strong><br />
households among the non-participant control group. If true, this suggests significant<br />
accomplishment toward the indicator. Unfortunately, the ACF-specific data from FAO paint a<br />
contradictory picture than the larger average: these data suggest that non-participants are<br />
cultivating a greater percentage <strong>of</strong> their land than FFS participants, 67 versus 49 percent,<br />
respectively. Although this does not address fully the question <strong>of</strong> changes in acreage it<br />
nonetheless highlights the fact that a greater understanding <strong>of</strong> land access and utilisation is<br />
required before programming can reflect specific strategies to improve this ratio or before data<br />
collection can verify it.<br />
3.2.2 Increased production<br />
This indicator too is another mainstay <strong>of</strong> monitoring production based approaches to enhancing<br />
food security. However, there are no baseline or final data with which to determine or measure<br />
changes in production levels resulting from the <strong>2008</strong> FFS programme. Although changes cannot<br />
be evaluated directly, only a little rationalisation is required to assume programme achievement in<br />
this regard.<br />
The practices promoted through the FFS programme for planting, weeding, and pest control are<br />
reported by staff and respondents to have improved the initial performance <strong>of</strong> <strong>2008</strong> first season<br />
crops in the commercial and study plots. Staff and participants alike attested that <strong>2008</strong> study and<br />
commercial crop performance was recognised by all as superior to previous years, but that poor<br />
climatic performance in the second half <strong>of</strong> the season undermined most groups’ crops. In fact<br />
many <strong>of</strong> the groups did not realise a harvest from either their commercial or study plot – in some<br />
cases neither – due to prolonged sunshine. Presently it is only possible to assume that the<br />
apparently high prevalence <strong>of</strong> adopted practices and initial transmission to others will result over<br />
time in greater agricultural production (assuming fav<strong>our</strong>able climatic conditions).<br />
A farmer field school programme does not have to concentrate only on crop production. Animal<br />
production also should have increased through the ACF FFS programme but was hindered by two<br />
factors. The Acan Dano group, for example, resolved to develop a piggery for their commercial<br />
enterprise but ultimately had to abandon this for soy bean cultivation because the programme<br />
grant amount proved too low (unfortunately the team lacked time to research the actual numbers<br />
involved in this decision). Much more significant, however, was the complete failure to deliver one<br />
female goat to each participating FFS household through the in-kind contribution <strong>of</strong> animals from<br />
FAO. According to respondents, goats are financial assets that generally contribute more toward<br />
household income s<strong>our</strong>ces than to food s<strong>our</strong>ces; increased income nonetheless contributes<br />
directly to increased access to food from market purchase (which all households demonstrate, see<br />
Section 4.2). Animals, especially goats, also enable households to sell them to meet other cash<br />
needs, especially unexpected expenditure on healthcare, funerals, or school fees. Access to such<br />
financial assets supports household resilience, presumably reducing the likelihood <strong>of</strong> turning to<br />
more corrosive coping strategies (discussed further in Section 4.6). During the evaluation<br />
fieldwork, each <strong>of</strong> the groups questioned whether their goats (and ploughs) were forthcoming, to<br />
which the team could only respond that it would follow up with FAO again to determine what might<br />
still be possible. (Quarantines against foot and mouth disease apparently have disrupted large<br />
scale procurement <strong>of</strong> animals, which may have contributed to the fact that the goats were not<br />
delivered by FAO to the FFS participants.)<br />
3.2.3 Disease resistant cassava is more prevalent<br />
Multiplication <strong>of</strong> disease resistant cassava represents another missed opportunity to increase<br />
household production through the FFS programme. At the same time, multiplication also would<br />
<strong>Action</strong> <strong>Against</strong> <strong>Hunger</strong> Uganda - 27 - Farmer Field School <strong>Evaluation</strong>
have enhanced the complementarity <strong>of</strong> FFS inputs contributing to the household economy and<br />
increased the already limited local access to disease resistant cassava cuttings.<br />
The causes behind the missed opportunity are admittedly vague, but it appears that ACF intended<br />
for all 320 FFS members to receive cassava cuttings. Despite this plan, actual date <strong>of</strong> receiving the<br />
cuttings came unexpectedly as a result <strong>of</strong> reportedly poor coordination with FAO who supplied<br />
them. Participant land had not yet been prepared as a result, but many <strong>of</strong> the cuttings were<br />
becoming too dry for planting to be delayed. Therefore the entire consignment was distributed to<br />
households engaged in other activities in the North (also funded by FAO under the same<br />
agreement but not participating in the FFSs) who were able to plant the cuttings immediately.<br />
Despite cassava multiplication initiated with these other groups, the participants and benefits were<br />
outside the FFS programme and represent another missed opportunity for complementary inputs<br />
and impact.<br />
Including cassava in the FFS programme would have contributed to household food s<strong>our</strong>ces and,<br />
to a lesser extent, income s<strong>our</strong>ces. Once plants matured, new cuttings also could have been<br />
circulated and sold by members, further increasing the programmatic benefits <strong>of</strong> cassava while<br />
facilitating increased local access to disease resistant varieties. Cassava cultivation could even<br />
help create possibilities for value addition activities like chip production and sale. The following<br />
photograph illustrates the difference in quality and resilience between two cassava stands planted<br />
at approximately the same time. 7 The leaves on left are infected with cassava mosaic virus (CMV),<br />
a plant pathogenic begomovirus transmitted by white flies that feed on the plant, 8 and has<br />
consequently stunted development compared with the large green leaves <strong>of</strong> the resistant variety<br />
(akena) on the right disseminated by ACF through FAO.<br />
Figure 10. Comparison <strong>of</strong> a healthy cassava plant and one infected with CMV<br />
3.3 Enhanced Asset Generation and Management Capacity<br />
Asset generation and management have become an increasingly prominent objectives <strong>of</strong> ACF FSL<br />
programming in Uganda over the last two years. Although not an explicit objective <strong>of</strong> the <strong>2008</strong><br />
farmer field schools, a range <strong>of</strong> income generating activities has been undertaken under different<br />
programmes throughout the North with corresponding training in entrepreneurialism, bookkeeping,<br />
and small business management. Interestingly, evaluation <strong>of</strong> this output <strong>of</strong>fers some <strong>of</strong> the best<br />
7 Photograph taken in Koch Goma sub-county, Gulu, in October <strong>2008</strong> (not an ACF FFS area), but depicts the same stock<br />
<strong>of</strong> cassava cuttings received from FAO and originally intended for FFS members.<br />
8 See http://www.bspp.org.uk/publications/new-disease-reports/ndr.php?id=011052 and<br />
http://www.tropicalwhiteflyipmproject.cgiar.org/docs/PDF-book-wf/5.3.pdf<br />
<strong>Action</strong> <strong>Against</strong> <strong>Hunger</strong> Uganda - 28 - Farmer Field School <strong>Evaluation</strong>
indications <strong>of</strong> positive FFS performance, while at the same time highlighting missed opportunities<br />
that could have been capitalised more effectively. Much <strong>of</strong> the structure and discussion <strong>of</strong> this<br />
section is structured in a way that <strong>of</strong>fers alignment with other ACF FSL monitoring indicators,<br />
including both Karamoja and the North (especially questions <strong>of</strong> cash, savings, and credit) without<br />
detracting from the focus here <strong>of</strong> evaluating <strong>2008</strong> FFS performance.<br />
In short, all twelve FFS groups demonstrated greater asset generation and management capacity<br />
than anticipated either in programme design or in the subjective expectations <strong>of</strong> the ACF<br />
facilitators. All group bank accounts are still open, are still being augmented through group<br />
contributions, and still <strong>of</strong>fer a range <strong>of</strong> asset possibilities like input expenditure or access to credit.<br />
Despite these meaningful outcomes, more could have been achieved through the programme to<br />
support marketing skills and opportunities that would have contributed further to increased<br />
household access to food. These missed opportunities were however the result <strong>of</strong> the short<br />
programme period, not poor performance in implementation.<br />
3.3.1 Increased marketing capacity <strong>of</strong> own production<br />
Marketing capacity could not be included in the original FFS programme design due to the limited<br />
number <strong>of</strong> months available for implementation and the subsequent inability to engage with an<br />
entire crop cycle (from land preparation to final consumption or sale). There are indications<br />
nonetheless that gains have been made and that there is an excellent foundation now in place as a<br />
result <strong>of</strong> the programme for future improvement <strong>of</strong> marketing capacity.<br />
The group solidarity witnessed so far will facilitate the collaboration required for a range <strong>of</strong> activities<br />
that could increase marketing capacity and pr<strong>of</strong>itability. Increased marketing capacity could for<br />
example have been supported through the programme by including post-harvest handling<br />
practices, especially packing and storage which have direct effects on quantity and quality <strong>of</strong> sale.<br />
Better storage facilities combined with good group dynamics and business planning could also<br />
enable more households to make more fav<strong>our</strong>able decisions about how much <strong>of</strong> their production<br />
they sell in order to buy food (or other services) at particular times <strong>of</strong> year, ideally avoiding<br />
seasonal fluctuations like low prices immediately after harvest or high food prices during the dry<br />
season. Improved storage also would minimise the notoriously high rate <strong>of</strong> post-harvest losses<br />
(about which one usually hears <strong>of</strong> an average 25% in Uganda). Equal production with less loss<br />
could increase household sale and consumption.<br />
Group bulking and transportation <strong>of</strong> their production could <strong>of</strong>fer another means <strong>of</strong> increasing<br />
pr<strong>of</strong>its, as larger quantities sold in trading centres fetch better prices than smaller quantities sold at<br />
the farm gate. The Acan Kwette group illustrates this point in detail, using the example <strong>of</strong> their<br />
study crop, the red beauty variety <strong>of</strong> groundnut. They explained how at the time <strong>of</strong> harvest one kilo<br />
<strong>of</strong> shelled groundnut was worth roughly Ugx 1,400 at the farm gate but at the same time Ugx 1,600<br />
at the Minakulu trading centre and Ugx 1,800 at the Gulu central market – 29 percent higher than<br />
the original farm gate price. Transportation costs make this unrealistic for an individual smallholder,<br />
but are worth the investment if a group can organise itself and absorb the costs. The Acan Kwette<br />
respondents reported that last year five <strong>of</strong> their members did this for the first time to sell their<br />
individual groundnut harvests at a better price in Gulu (why only five members instead <strong>of</strong> all 25 was<br />
not established). If more such collective action can be mobilised in the future, then the pr<strong>of</strong>itability<br />
<strong>of</strong> group cohesion can be increased. Even the improved group record keeping skills developed in<br />
the programme can support group marketing, helping both to organise the process and to ensure<br />
transparency in individual contributions and payments. On the possible programmatic horizon for<br />
ACF is working with WFP, wherein smallholders can organise to sell through the Purchase for<br />
Progress programme. Aside from the coordination issues, group solidarity, record keeping,<br />
storage, and bulking will all be necessary for this to be a feasible consideration.<br />
3.3.2 Strengthened seed multiplication and marketing<br />
This is the best example <strong>of</strong> an attempt made to build on the foundation <strong>of</strong> group mobilisation and<br />
solidarity for increased market engagement, in this case working with ACF partner Victoria Seeds.<br />
<strong>Action</strong> <strong>Against</strong> <strong>Hunger</strong> Uganda - 29 - Farmer Field School <strong>Evaluation</strong>
The collaboration was actually initiated after the FFS programme concluded, but nonetheless<br />
worked with the FFS groups to try linking them directly to a commercial seed s<strong>our</strong>ce within a<br />
structured buyback programme that would increase crop quality and household income<br />
simultaneously. This marketing venture is therefore included in the evaluation because the initiative<br />
was exclusively with the FFS groups who were accepted by Victoria Seeds as potential<br />
commercial growers because <strong>of</strong> their graduation from the FFS programme and because it <strong>of</strong>fers an<br />
example <strong>of</strong> future marketing possibilities, even though the end results were below expectations for<br />
all concerned.<br />
The intention was excellent and all participants indicated that they would continue working with<br />
Victoria Seeds in the future if possible. Unfortunately, the idea was born late into the second<br />
season planting season. Despite mobilisation and subsequent FFS group expressions <strong>of</strong> interest in<br />
the activity, tripartite agreements between FFS groups, Victoria Seeds, and ACF were slow to<br />
finalise. This caused some groups to cease waiting and proceed with their own independent<br />
planting, for fear <strong>of</strong> missing the season completely. Some groups even rejected seeds because<br />
they were too late. (It is nonetheless enc<strong>our</strong>aging to see that groups are not afraid to decline<br />
inputs.) As a final blow to the <strong>2008</strong> marketing venture with Victoria Seeds, most crops suffered<br />
from an unusual dry spell which undermined much <strong>of</strong> the anticipated soy and groundnut harvests.<br />
Also similar to the FFS programme, data collection with the Victoria Seeds groups has been<br />
ineffective. Even at the time <strong>of</strong> writing, collated data from the <strong>2008</strong> second season attempt at<br />
commercial growing partnership with Victoria Seeds are not available. But despite all <strong>of</strong> these<br />
limitations, the FFS groups demonstrated sufficient organisation and market savvy to engage with<br />
the seed multiplication venture in light <strong>of</strong> its potential pr<strong>of</strong>its.<br />
3.3.3 Income s<strong>our</strong>ces diversified through value-addition<br />
Value addition activities were not included in the farmer field school programme design, another<br />
missed opportunity symptomatic <strong>of</strong> the short implementation schedule – but equally another<br />
opportunity for more effective design in subsequent programmes. FSL staff meetings for strategic<br />
planning, for example, regularly touched the need for value addition activities to increase<br />
household income.<br />
For example lowland rice could have been an option for the Okwang groups last year. It is typically<br />
sold for Ugx 800/kg (at the farm gate) in the husk because hullers apparently are not available.<br />
Hulled rice, by comparison, could sell for Ugx 1,500/kg even during harvest, when prices are<br />
lowest – almost double the unhulled farm gate price. Groundnut <strong>of</strong>fers other possibilities for<br />
shelling and sale at a higher price. This practice is in fact more standard, because manual shellers<br />
are accessible for hire and <strong>of</strong>fer growers a higher price for their product. Shared group ownership<br />
<strong>of</strong> a sheller nonetheless could increase pr<strong>of</strong>it further by eliminating expenditure on renting the<br />
machine. Paste is another regularly mentioned possibility for groundnut value addition, as are<br />
cassava chips. These are only the more obvious and most mentioned possibilities that arose<br />
during the evaluation, but further probing would probably identify others and suggest how to initiate<br />
such activities more effectively and for greater pr<strong>of</strong>its than in <strong>2008</strong>.<br />
3.3.4 Increased group and individual savings<br />
Of the 12 groups established for the farmer field school programme, every one <strong>of</strong> them still has an<br />
active savings account with funds deposited. This is an excellent validation <strong>of</strong> both the programme<br />
and the group approach it utilises, as the groups presumably would have dissolved their<br />
memberships and liquidated their bank accounts now that the programme has finished if they no<br />
longer perceived them relevant. It is important that all groups are in fact still together and still<br />
managing active bank accounts, <strong>of</strong> which the current balances are summarised below:<br />
<strong>Action</strong> <strong>Against</strong> <strong>Hunger</strong> Uganda - 30 - Farmer Field School <strong>Evaluation</strong>
Figure 11. Amount remaining in group bank account 8 months after programme closure<br />
300,000<br />
250,000<br />
200,000<br />
Ugx<br />
150,000<br />
100,000<br />
50,000<br />
0<br />
1 2 3 4 5 6 7 8 9 10 11 12<br />
Opejal Aceno Oyoro<br />
This vindicates the FFS programme and aspects <strong>of</strong> ACF’s 2009 FSL strategy to nurture household<br />
linkages with formal financial institutions. It is also interesting to notice that with the exception <strong>of</strong><br />
two groups in Opejal, the remaining balances within each geographic cluster are roughly<br />
equivalent. This probably reflects the individual influence <strong>of</strong> each <strong>of</strong> the three ACF facilitators<br />
toward how groups managed their contributions, expenditure, and savings (although all accounts<br />
require three separate signatures to ensure protection and transparency).<br />
Participant cash contributions and savings are another positive outcome <strong>of</strong> the FFS programme.<br />
Although the individual method varied between groups, all utilised some form <strong>of</strong> group asset<br />
building through membership and registration fees. All groups also supported individual savings by<br />
tracking and managing the contributions <strong>of</strong> each member (usually agreed amounts at agreed<br />
intervals, but otherwise based on ability to pay). Illustrative examples <strong>of</strong> member contribution<br />
schedules are useful:<br />
• Ugx 300/month/member (Kok Can Ikweri)<br />
• Ugx 200/week/member (Apit Pe Ool)<br />
• Minimum Ugx 500/week/member but maximum Ugx 1,000/week/member (Acan Dano), based<br />
on individual ability<br />
These are examples <strong>of</strong> a common collective practice called bole cap in Langi, wherein group<br />
members each contribute savings and maintain a shared ledger. The scheme <strong>of</strong>ten pays out at the<br />
end <strong>of</strong> the year (before Christmas), with each member receiving the total sum <strong>of</strong> their contributions.<br />
The bole cap can also be used for immediate cash needs, not solely for annual disbursements.<br />
The prevalence <strong>of</strong> FFS group bole cap saving schemes represents a significant accomplishment<br />
for the FFS programme that can also help inform other ACF programming in the North. It illustrates<br />
how a new initiative can integrate existing practices, perhaps even increasing their viability through<br />
improved record keeping skills or the collectively perceived benefits <strong>of</strong> working as a production<br />
group. It also demonstrates that access to savings is an important social and financial asset valued<br />
by returnee households.<br />
Analysis <strong>of</strong> how groups utilised the ‘pr<strong>of</strong>its’ <strong>of</strong> their commercial and study plots also illustrates the<br />
ability <strong>of</strong> programme activities to support livelihood strategies. The categories used for analysis are<br />
based on those developed by FAO, although they have been adapted because FAO used slightly<br />
different categories for the commercial and study plots whereas for this evaluation ACF wanted<br />
greater comparability by using the same criteria for both plots: 9<br />
9 See FAO Tables 24 and 28 for comparison.<br />
<strong>Action</strong> <strong>Against</strong> <strong>Hunger</strong> Uganda - 31 - Farmer Field School <strong>Evaluation</strong>
Figure 12. Compared utilisation <strong>of</strong> commercial and study plot pr<strong>of</strong>its<br />
8%<br />
Commercial Plot<br />
8%<br />
17%<br />
17%<br />
Study Plot<br />
8%<br />
To expand enterprise<br />
To start another enterprise<br />
0%<br />
8%<br />
17%<br />
Distributed to members<br />
17%<br />
50%<br />
8%<br />
42%<br />
Deposited in the group bank<br />
account<br />
To buy inputs and distribute to<br />
members<br />
Other<br />
Not all <strong>of</strong> the responses were as clear as they appear here in summary, in that some groups would<br />
for example immediately deposit commercial plot sale pr<strong>of</strong>its in the group account, then distribute it<br />
to members so that they could purchase inputs (typically seed) for individual or collective<br />
cultivation (i.e. another ‘enterprise’). The responses indicated here try to capture the bottom line <strong>of</strong><br />
how the pr<strong>of</strong>its ultimately were used, although this was not easy given the multiple uses reported<br />
for pr<strong>of</strong>its. More generally, all <strong>of</strong> the reported utilisation <strong>of</strong> commercial and study enterprise pr<strong>of</strong>its<br />
was constructive; even the ambiguous (and most commonly reported) ‘distributed to members’ in<br />
practice meant that either cash or seeds went directly to individual member households. Only in<br />
three cases did groups identify an ‘other’ use for their pr<strong>of</strong>its. For the commercial plot the one<br />
exception was to contribute all <strong>of</strong> the proceeds to the group’s bole cap savings; for the study plot<br />
one group reported ‘other’ because they stored all <strong>of</strong> their harvested seed (pigeon pea), whereas<br />
another group reported no pr<strong>of</strong>its due to seasonal irregularities. But again, all uses are constructive<br />
and all can be attributed to the FFS programme.<br />
3.3.5 Improved access to and terms <strong>of</strong> credit<br />
This section builds on the preceding analysis <strong>of</strong> how the FFSs strengthened group savings, but is<br />
sufficiently distinctive to be a separate indicator <strong>of</strong> programme performance. Several <strong>of</strong> the FFS<br />
groups reported using their collective savings to <strong>of</strong>fer loans to members, even charging 10%<br />
interest to help augment group equity. Where they are used, these group based loans are the only<br />
formal credit s<strong>our</strong>ce available to participants; not even their non-member neighb<strong>our</strong>s can access<br />
such loans from the FFS group or elsewhere. Community based lending outside FFSs in the<br />
programme areas usually comprises seeds or food, but not cash – and none <strong>of</strong> the three is<br />
available from shops in any <strong>of</strong> the respective trading centres. Utilising the newly established group<br />
savings, FFS loans are now possible. These typically are used, in no particular order, for school<br />
fees or materials, seeds, food, or sudden cash needs like household illness or death. The<br />
additional information necessary to analyse better the impact <strong>of</strong> this increased access to credit<br />
would be to understand how households managed before this credit s<strong>our</strong>ce emerged from the FFS<br />
programme.<br />
Figure 13. Household financial situation and access to credit<br />
ACF<br />
FAO<br />
Participant Control Participant Control<br />
Households using credit facilities (%) 77 40 60 64<br />
Average credit/loan amount taken (Ugx) 77,414 99,359 34,554 118,654<br />
Households with debt 3% 6% 25% 22%<br />
S<strong>our</strong>ce: FAO (<strong>2008</strong>) Tables 14 & 18, pp 20-21<br />
The FAO evaluation data <strong>of</strong>fer an interesting look at credit. Among ACF participants nearly twice<br />
as many households are using credit. This differs from the question <strong>of</strong> access to credit but<br />
nonetheless suggests that this results from FFS programme participation. It is unclear, however,<br />
why a roughly equal percentage <strong>of</strong> households in the full FAO dataset use credit (although this<br />
<strong>Action</strong> <strong>Against</strong> <strong>Hunger</strong> Uganda - 32 - Farmer Field School <strong>Evaluation</strong>
might simply reflect the effect <strong>of</strong> averaging data). FAO adds that among the households not<br />
accessing credit, 43 percent said this was because no s<strong>our</strong>ces were available in their area. FFS<br />
participants in both examples appear to have smaller loans than their non-participant neighb<strong>our</strong>s:<br />
This might be attributable to the programme and the inputs it brings, perhaps to the group savings,<br />
the commercial or study plot pr<strong>of</strong>its, or even the increased production resulting from improved<br />
practices. Even if the cause is unclear, FFS participants appear to have better access to credit.<br />
4. Farmer Field School Programme Impact<br />
4.1 Stronger Household Food Security and Livelihoods<br />
The farmer field school programme is one <strong>of</strong> the approaches employed by ACF Uganda toward<br />
stronger household food security and livelihoods and, ultimately, reduction <strong>of</strong> the root causes for<br />
malnutrition. At this level, impact is not simply about accomplishment <strong>of</strong> any particular indicator or<br />
output, but about the combined effects from all outputs and how sustainable these might be over<br />
time.<br />
The evaluation <strong>of</strong> programme impact concentrates on indicators at objective and goal level in the<br />
logical framework. The impact analysis tries to utilise a range <strong>of</strong> data from both FAO and ACF.<br />
Considering that the FFS programme lasted only seven months, however, pr<strong>of</strong>ound impact at<br />
either group or household level cannot be expected. The discussion below therefore concentrates<br />
on how the FFS approach can be expected to contribute toward the programme objective.<br />
Similarly, some <strong>of</strong> the indicators are used despite the lack <strong>of</strong> corresponding baseline data in order<br />
to illustrate how programme evaluation could have been anticipated more effectively, to suggest<br />
how future ACF FSL initiatives can utilise the same indicators and to <strong>of</strong>fer a FFS baseline for future<br />
programme cycles. <strong>Evaluation</strong> at impact level is here more by proxy, and is not as rigorous as that<br />
for FFS programme performance.<br />
4.2 Participant food, income, and expenditure proportions improve<br />
The <strong>2008</strong> programme design does not demonstrate any explicit strategy for how it will influence<br />
particular elements <strong>of</strong> the household economy or what specific changes might therefore be<br />
expected. Proportional piling with one FFS group in each parish cluster was used to generate<br />
indicative (as opposed to representative) trends <strong>of</strong> how households apportion their assets and how<br />
future programming might align more directly with these strategies:<br />
Figure 14. Summary <strong>of</strong> the household economy<br />
Food<br />
Other<br />
Income<br />
Other<br />
Expenditure<br />
Other<br />
100%<br />
90%<br />
80%<br />
70%<br />
60%<br />
50%<br />
40%<br />
30%<br />
20%<br />
10%<br />
0%<br />
Opejal Aceno Oyoro<br />
Loans<br />
Gifts/begging<br />
Casual lab<strong>our</strong><br />
Food aid<br />
Wild foods &<br />
animals<br />
Market<br />
purchase<br />
Own animals<br />
Own crops<br />
100%<br />
90%<br />
80%<br />
70%<br />
60%<br />
50%<br />
40%<br />
30%<br />
20%<br />
10%<br />
0%<br />
Opejal Aceno Oyoro<br />
Loans<br />
Gifts/begging<br />
Bush<br />
products<br />
Petty trade<br />
Artisan<br />
Casual<br />
lab<strong>our</strong><br />
Own animals<br />
Own crops<br />
100%<br />
90%<br />
80%<br />
70%<br />
60%<br />
50%<br />
40%<br />
30%<br />
20%<br />
10%<br />
0%<br />
Opejal Aceno Oyoro<br />
Cigarettes and<br />
alcohol<br />
Education<br />
Health<br />
Debt/loan<br />
payments<br />
Household<br />
items<br />
Transportation<br />
Ag/vet inputs<br />
Food<br />
More food comes from own crops than from own animals. Even though most groups concentrate<br />
on cash crops for their study and commercial enterprises, the promoted practices are relevant well<br />
beyond these particular crops and should contribute over time to increases in own crop production<br />
as a food s<strong>our</strong>ce as well. It is interesting to note that among the participating groups ‘own animals’<br />
tend to be less a food s<strong>our</strong>ce and more an income s<strong>our</strong>ce, a financial asset. Animals, particularly<br />
shoats, are sold to meet cash needs; poultry, however, are usually consumed more than sold. As<br />
with s<strong>our</strong>ces <strong>of</strong> food, the increases expected from FFS practices that increase production quality<br />
and quantity should translate into greater household income, but not necessarily the diversity <strong>of</strong><br />
<strong>Action</strong> <strong>Against</strong> <strong>Hunger</strong> Uganda - 33 - Farmer Field School <strong>Evaluation</strong>
income s<strong>our</strong>ces. The <strong>2008</strong> ACF programme nonetheless missed its opportunity to diversify and<br />
strengthen income s<strong>our</strong>ces by distributing goats to participants. The same applies to the missed<br />
impact potential from storage and marketing practices that would have influenced food, income<br />
and expenditure. Cassava also would have <strong>of</strong>fered an additional s<strong>our</strong>ce <strong>of</strong> food and occasional<br />
income. In fact, these gaps all highlight how the programme could be redesigned in the future to<br />
identify more specifically its expected influence on aspects <strong>of</strong> the household economy. The idea<br />
that the FFS programme contributed more to income than food s<strong>our</strong>ces (because groups<br />
predominantly select cash crops) would not be entirely accurate, as increased cash ultimately<br />
meant increased food and greater access to seed stocks for participating members.<br />
ACF Uganda FSL documentation <strong>of</strong>ten mentions ‘a return to self-sufficiency’ in the c<strong>our</strong>se <strong>of</strong> postdisplacement<br />
recovery. However as illustrated in Figure 14 above, these households are all market<br />
actors. This suggests that a successful FFS programme should increase household capacity to<br />
meet food needs regardless whether participants consume the food they grow or whether they sell<br />
one commodity in order to purchase another. Reductions in household expenditure on food<br />
therefore will not necessarily indicate programme impact as much as would changes in<br />
expenditure and their underlying reasons.<br />
4.3 Positive changes in group and household assets<br />
Figure 15. Average number <strong>of</strong> livestock per household<br />
Animal<br />
ACF<br />
FAO<br />
Participant Control Participant Control<br />
Cattle 1.6 2.4 2.7 2.5<br />
Shoats 1.7 1.4 3.2 3.2<br />
Pigs 1.5 1.0 2.0 2.3<br />
Poultry 4.3 3.8 7.9 6.1<br />
S<strong>our</strong>ce: FAO (<strong>2008</strong>) Table 19, pg 21<br />
The FAO evaluation data suggest that animal ownership (key financial assets for rural households)<br />
is lower among the ACF groups than in the larger population <strong>of</strong> FFS participants. The letter <strong>of</strong><br />
agreement with FAO included plans to distribute one female goat to every ACF participant in order<br />
to bolster household livestock recovery. Without receiving goats, however, the <strong>2008</strong> programme<br />
missed opportunities to strengthen household financial assets through goat restocking. Goats are<br />
<strong>of</strong>ten sold to meet immediate cash needs, such as healthcare or education, or to purchase food.<br />
The terms <strong>of</strong> trade between goats and maize meal (posho, the primary staple purchased) are<br />
therefore illustrative <strong>of</strong> the additional purchasing power that could have been given to households<br />
(without even considering the reproductive capacity <strong>of</strong> the animals). A mature female goat is<br />
currently worth Ugx 45,000 while a kilogram <strong>of</strong> posho is Ugx 1,200. Goats distributed in the <strong>2008</strong><br />
FFS programme would now be mature and able to fetch competitive prices, with which a<br />
household could exchange one goat for roughly 35-40 kilograms <strong>of</strong> food. By now these goats<br />
would also be producing kids and thereby increasing household financial assets further still.<br />
A significant but unanticipated accomplishment <strong>of</strong> the FFS programme was the number <strong>of</strong><br />
additional physical household assets constructed by members throughout each different location,<br />
reflecting both the mobilisation skills <strong>of</strong> the ACF facilitators and the productive solidarity<br />
demonstrated by the groups. One group, Can Opwonya, mandated that all members would<br />
construct these household structures in order to increase the collective wellbeing <strong>of</strong> the group:<br />
Figure 16. Summary <strong>of</strong> additional physical assets resulting from the FFS programme<br />
Asset Opejal Aceno Oyoro Total<br />
Rocket lorena stove 4 4 4 12<br />
Pit latrine 30 60 48 138<br />
Drying rack 95 120 56 271<br />
Kitchen 75 100 100 275<br />
Bathing shelter 80 100 101 281<br />
Rubbish pit 80 120 100 300<br />
Total 364 504 409 1,277<br />
<strong>Action</strong> <strong>Against</strong> <strong>Hunger</strong> Uganda - 34 - Farmer Field School <strong>Evaluation</strong>
Although these additional household assets were an unexpected achievement, it is nonetheless<br />
unfortunate that comparatively few fuel efficient stoves were established – especially as this was a<br />
core activity in its 2006-2007 FSL programming. Improved stoves can reduce the time and money<br />
women spend collecting or purchasing firewood (used more than charcoal in the rural North) and<br />
help increase the positive environmental impact <strong>of</strong> ACF programmes. (One explanation might be<br />
that most households had stoves already from the previous ACF programming, although this cold<br />
not be verified).<br />
FAO in their <strong>2008</strong> evaluation also tried to assess possible changes in symbolic assets that can<br />
contribute to household livelihood activities (bicycles, radios, mobile phones, motorbikes). Although<br />
many participants owned a combination <strong>of</strong> some <strong>of</strong> these assets, almost all <strong>of</strong> them (97%) were<br />
acquired before joining the FFS programme. Previous ACF FSL monitoring in the North attempted<br />
a similar analysis <strong>of</strong> changes in these same assets, however there are no known examples <strong>of</strong> both<br />
baseline and final data for the same groups, locations, or programmes. Analysis therefore has<br />
never been possible, but nonetheless remains on the ACF radar as it continues to explore how<br />
best to track and attribute changes in productive assets.<br />
4.4 Average household dietary diversity scores improve from poor to medium<br />
According to the FAO ACF data, household dietary diversity scores 10 are remarkably low, between<br />
1-4 from a maximum possible score <strong>of</strong> 12. Nobody in the ACF group scored above 4 in either the<br />
programme population or control group, without a single household scoring in the higher quartiles.<br />
This is unfortunately difficult to see in Figure 17, however, because <strong>of</strong> how the score ranges have<br />
been grouped:<br />
Figure 17. Comparison <strong>of</strong> household dietary diversity scores<br />
100%<br />
90%<br />
80%<br />
70%<br />
60%<br />
50%<br />
40%<br />
30%<br />
20%<br />
10%<br />
0%<br />
Participant Control Participant Control<br />
10-12<br />
7-9<br />
4-6<br />
1-3<br />
ACF<br />
FAO<br />
S<strong>our</strong>ce: FAO (<strong>2008</strong>) Table 10, pg 18<br />
On the one hand it is obvious from these data that although dietary diversity is low throughout the<br />
ACF FFS programme area, there is nonetheless a small difference between participants and nonparticipants.<br />
This difference cannot however be attributed to the FFS programme itself. It could<br />
reflect, for example, the possibility that participants represent slightly stronger households who are<br />
able to mobilise around a collective activity and budget the time necessary to fulfil the subsequent<br />
obligations, and that such households have slightly better access to a wider variety <strong>of</strong> food.<br />
Future dietary diversity monitoring will need not only better baseline and final data, but will require<br />
an understanding <strong>of</strong> household food preferences and habits. It may not be realistic, for example, to<br />
expect households to reach a score <strong>of</strong> 10-12 because <strong>of</strong> prevailing food preferences. That is, no<br />
matter how much improvement is achieved programmatically to household access to food, this<br />
may not be entirely captured by the dietary diversity score. Changes should nonetheless be<br />
anticipated, and the possibility <strong>of</strong> comparing these with a control group would be ideal. For the<br />
<strong>2008</strong> FFS participants, scores are slightly better than the non-participants, but this cannot be<br />
10 Swindale, Anne & Bilinsky, Paula (2006) Household Dietary Diversity Score (HDDS) for Measurement <strong>of</strong> Household<br />
Food Access: Indicator Guide (Version 2). Food and Nutrition Technical Assistance Project: Washington, DC.<br />
<strong>Action</strong> <strong>Against</strong> <strong>Hunger</strong> Uganda - 35 - Farmer Field School <strong>Evaluation</strong>
attributed directly to ACF or the programme – only assumed (perhaps indirectly resulting from the<br />
increased access to savings or credit, or increased production accomplished through improved<br />
practices).<br />
4.5 Reduction in the number <strong>of</strong> months with inadequate household provisioning <strong>of</strong> food<br />
The number <strong>of</strong> months with adequate provisioning <strong>of</strong> food is another useful indicator for assessing<br />
changes in household access to food. 11 According to the FAO data, 93 percent <strong>of</strong> the ACF<br />
participants report a food gap, compared with 97 percent in the control group. These are generally<br />
equal when considering the precision error <strong>of</strong> sampling. 12 Both <strong>of</strong> these figures are also essentially<br />
equal to the national averages FAO reports (within a percentage or two).<br />
Figure 18. Months with inadequate household food provisioning<br />
100%<br />
80%<br />
60%<br />
40%<br />
20%<br />
Participant<br />
Non-Participant<br />
TREND<br />
0%<br />
Jan Feb Mar Apr May Jun Jul Aug Sep Oct Nov Dec<br />
S<strong>our</strong>ce: FAO evaluation data<br />
Adding the total number <strong>of</strong> inadequate provisioning months per household and dividing by the<br />
number <strong>of</strong> respondent households provides a score useful for comparison or tracking. The ACF<br />
and FAO averages are similar only in that there is no real difference in MIHFP scores between the<br />
FFS participants and the control groups. Comparing the ACF and FAO scores, however, shows<br />
that the ACF groups score twice as high as the FAO averages:<br />
Figure 19. Computation and comparison <strong>of</strong> MIHFP scores<br />
ACF<br />
FAO<br />
Participant Control Participant Control<br />
Sum (MIHFP) 574 619 2,848 2,342<br />
Number <strong>of</strong> households 96 97 951 768<br />
Average MIHFP 5.98 6.38 2.99 3.02<br />
S<strong>our</strong>ce: FAO (<strong>2008</strong>) Table 12 pg 19<br />
<strong>Evaluation</strong> respondents generalised the MIHFP period as shorter than what is reported here,<br />
usually indicating May and June when market prices peak. The FFS programme therefore might<br />
have addressed the apparently high ACF participant MIHFP scores by increasing household ability<br />
to purchase food during periods <strong>of</strong> high market prices or, even better, pre-empt the need for<br />
purchase at this time through increased storage capacity. The team thinks that household access<br />
to food has increased through the programme, however it is not yet possible to conclude whether<br />
the timing <strong>of</strong> this increase aligns with the most critical period <strong>of</strong> the year. Continued tracking <strong>of</strong> this<br />
indicator might also guide future implementation to determine whether particular inputs or activities<br />
can be more effectively timed to influence a reduction in MIHFP scores.<br />
11 Bilinsky, Paula & Swindale, Anne (2007) Months <strong>of</strong> Adequate Household Food Provisioning (MAHFP) for<br />
Measurement <strong>of</strong> Household Food Access: Indicator Guide. Food and Nutrition Technical Assistance Project:<br />
Washington, DC.<br />
12 Assumed to be ±5% but not indicated in the FAO report.<br />
<strong>Action</strong> <strong>Against</strong> <strong>Hunger</strong> Uganda - 36 - Farmer Field School <strong>Evaluation</strong>
4.6 Improvement in participant coping strategy index scores<br />
The short duration <strong>of</strong> the FFS programme and its partial production cycle mean that significant<br />
changes to the type, frequency, or severity <strong>of</strong> household coping strategies cannot be expected.<br />
The FAO data nonetheless suggest which coping strategies are more expected among the ACF<br />
groups, which in turn can support more informed future programme design that includes<br />
anticipated changes in coping strategies: 13<br />
Figure 20. Frequency <strong>of</strong> coping strategy use in ACF FFS programme areas 14<br />
4<br />
Participant<br />
Non-Participant<br />
3<br />
2<br />
1<br />
0<br />
Rely on less<br />
perferred/expensive<br />
food<br />
Borrow food, rely on<br />
friend/relative<br />
Purchase food on<br />
credit<br />
Gather wild fruit,<br />
hunt<br />
Harvest immature<br />
crops<br />
Consume seed<br />
stock for next<br />
season<br />
Send children to eat<br />
with neighb<strong>our</strong>s<br />
Send HH members<br />
to beg<br />
Limit portion size<br />
per meal<br />
Restrict<br />
consumption by<br />
adults for children<br />
Feed working HH<br />
members at<br />
expense <strong>of</strong> nonworking<br />
Ration money to buy<br />
prepared food<br />
Reduce number <strong>of</strong><br />
meals/day<br />
Skip entire days<br />
without meals<br />
S<strong>our</strong>ce: FAO evaluation data<br />
The list <strong>of</strong> coping strategies is not exhaustive and is in fact concentrated specifically around food<br />
shortages. This is a narrowly conceived picture <strong>of</strong> coping that does not include, for example,<br />
(productive and non-productive) asset sales for meeting food or cash needs. There is no significant<br />
difference between the frequency <strong>of</strong> coping strategies reported by ACF participants or the control<br />
group. In fact, for most <strong>of</strong> the nine strategies the ACF average score is essentially equal to the<br />
control. This suggests that the FFS programme did not influence household resilience against<br />
particular coping strategies, otherwise a greater difference would be expected between the ACF<br />
participant and control scores in Figure 20 above.<br />
To begin understanding and evaluating programme-related coping strategies, the evaluation tried<br />
to establish relative degrees <strong>of</strong> severity by using pairwise ranking, the results <strong>of</strong> which are<br />
summarised below:<br />
Figure 21. Relative severity <strong>of</strong> coping strategies 15 Opejal Aceno Oyoro<br />
Coping Strategy<br />
Score Rank Score Rank Score Rank<br />
Rely on less preferred, less expensive food 0 0 1 4 0 7<br />
Borrow food from friend or relative 4 3 3 3 5 2<br />
Purchase food on credit 2 4 4 2 4 3<br />
Consume wild foods and animals 6 1 3 3 3 4<br />
Reduce the portion size <strong>of</strong> meals 1 5 1 4 1 6<br />
Reduce the number <strong>of</strong> meals per day 2 4 3 3 2 5<br />
Skip entire days without meals 5 2 6 1 6 1<br />
Unfortunately the discussions around the ranking lacked sufficient time to probe further into the<br />
rationale behind the ranking or to elaborate specifically what types <strong>of</strong> households employ which <strong>of</strong><br />
the strategies at what time <strong>of</strong> year. The ranking nonetheless suggests how ACF might weigh<br />
coping strategies for its planned surveillance activities and future monitoring. These data could<br />
13 CARE/WFP (2003) The Coping Strategies Index: Field Methods Manual.<br />
14 FAO used the following weighted scale: 0 = never, 1 = hardly at all (less than once/week), 2 = once in a while (oncetwice/week),<br />
3 = very <strong>of</strong>ten (1-6 times/week), 4 = all the time (every day).<br />
15 The evaluation team neglected to complete the ranking process in Aceno for lack <strong>of</strong> time, resulting in a three-way tie<br />
for third and a two-way tie for f<strong>our</strong>th. These should have been resolved through additional rounds <strong>of</strong> pairwise ranking to<br />
produce a clear hierarchy like those completed in Opejal and Oyoro parishes.<br />
<strong>Action</strong> <strong>Against</strong> <strong>Hunger</strong> Uganda - 37 - Farmer Field School <strong>Evaluation</strong>
also be used for future evaluation to suggest whether programming has affected the range,<br />
number, or frequency <strong>of</strong> coping strategies. Toward this, the FAO data are slightly more illustrative:<br />
Figure 22. Ranges <strong>of</strong> coping strategy index<br />
Weighted Sum <strong>of</strong><br />
ACF (%) FAO (%)<br />
Coping Strategies Participant Control Participant Control<br />
0 – 5 28 33 * *<br />
6 – 10 43 47 * *<br />
11 – 15 29 20 * *<br />
* Comparison here with the FAO averages was not possible as their data were grouped into different ranges than those used for ACF.<br />
S<strong>our</strong>ce: FAO (<strong>2008</strong>) Table 13, pg 19<br />
If the programme aim is to reduce coping strategy indices for participating households (i.e. reduce<br />
the frequency <strong>of</strong> using these coping strategies), then a higher percentage would be expected from<br />
the first group with scores between ‘0’ and ‘5’ (only 28% for the ACF FFS participants). Another<br />
quarter <strong>of</strong> the ACF respondents are in the highest group <strong>of</strong> scores, which should also decrease as<br />
programmes improve household food security and livelihoods.<br />
4.7 Effective ACF facilitators communicate programme practices and ethos<br />
The ACF FFS facilitators (and implicitly their parish based field assistants) were reported to be the<br />
primary s<strong>our</strong>ce <strong>of</strong> information about production practices. Participants everywhere were<br />
additionally aware and enthusiastic about the seasonally contextual radio programmes that ACF<br />
broadcast in <strong>2008</strong>, some <strong>of</strong> which were included in the same FAO-funded agreement as the farmer<br />
field schools. According to the FAO data, the FFS programme achieved meaningful impact as the<br />
predominant s<strong>our</strong>ce <strong>of</strong> agronomic skills:<br />
Figure 23. S<strong>our</strong>ces <strong>of</strong> skill for agronomic practices among ACF FFS members<br />
FFS<br />
Other<br />
NAADS<br />
Practice<br />
Facilitator Farmer<br />
(%)<br />
(%)<br />
(%)<br />
Other<br />
Extension<br />
Service (%)<br />
Tradition<br />
(%)<br />
Zero/minimum tillage 100 0 0 0 0<br />
Proper spacing 96 2 2 0 0<br />
Row planting 71 2 26 1 1<br />
Bunding/grass strips 100 0 0 0 0<br />
Relay cropping 50 0 50 0 0<br />
Crop rotation 43 0 57 0 0<br />
Mulching 100 0 0 0 0<br />
Thinning 88 0 12 0 0<br />
Pruning 100 0 0 0 0<br />
S<strong>our</strong>ce: FAO evaluation data<br />
None <strong>of</strong> the information listed above should originate only from FFS facilitators. One would expect<br />
households with greater human assets (such as knowledge and access to information) to display a<br />
greater variety <strong>of</strong> skill s<strong>our</strong>ces than citing only external facilitators. This is one reason why ACF<br />
facilitators also promoted the onward transmission and exchange <strong>of</strong> information and practices<br />
across FFS groups and (perhaps even more importantly) non-participants alike through activities<br />
such as field days and exchange visits. The groups absorbed this ethos, many <strong>of</strong> which<br />
independently invited neighb<strong>our</strong>s to compare study plot harvest results for example, or tried to<br />
convince others <strong>of</strong> the value <strong>of</strong> production practices promoted during the programme. This is<br />
another reason why facilitators in future programming should increase farmer experimentation (see<br />
Section 3.1.2) so that participant mobilisation is greater and the likelihood <strong>of</strong> perpetually<br />
transmitted messages higher.<br />
Even though the radio programming was not specifically focused on the FFS programme, it <strong>of</strong>fered<br />
an effective complement that has been commented on by respondents throughout the North, not<br />
only those in the FFSs. It is unfortunate that the FAO data do not include radio as a possible<br />
response for information s<strong>our</strong>ce (despite that their focus is more on skills than information). In an<br />
impact assessment on the role <strong>of</strong> radio in delivering food security information (currently in its<br />
second draft), the Uganda <strong>of</strong>fice <strong>of</strong> the International Lab<strong>our</strong> Organisation (ILO) also tries to identify<br />
different s<strong>our</strong>ces <strong>of</strong> information on agriculture and animal husbandry messages. For Lira district<br />
<strong>Action</strong> <strong>Against</strong> <strong>Hunger</strong> Uganda - 38 - Farmer Field School <strong>Evaluation</strong>
they report that 97 percent <strong>of</strong> respondents receive information on practices through radio, a<br />
medium not included in the FAO analysis <strong>of</strong> s<strong>our</strong>ces outlined in Figure 23 above. ILO similarly<br />
reports that 46 percent receive information from NGOs, 26 percent from friends/neighb<strong>our</strong>s, and<br />
only 17 percent from agricultural <strong>of</strong>ficers (in addition to a range <strong>of</strong> other s<strong>our</strong>ces). In fact, ILO then<br />
suggests that 87 percent <strong>of</strong> respondents say radio is their most credible s<strong>our</strong>ce <strong>of</strong> information on<br />
agriculture and husbandry, compared with only 2 percent accorded to agricultural <strong>of</strong>ficers.<br />
(Conversely, ten percent <strong>of</strong> respondents identified NGOs as the least credible s<strong>our</strong>ce <strong>of</strong><br />
information; six percent said the same about agricultural <strong>of</strong>ficers.) 16 In short, there are many valid<br />
s<strong>our</strong>ces <strong>of</strong> information available to rural producers, and ACF should not necessarily try to be the<br />
most significant. Rather, ACF should endeav<strong>our</strong> to provide the most appropriate and effective<br />
support it can while facilitating access to other complementary information s<strong>our</strong>ces at the same<br />
time. 17 The <strong>2008</strong> farmer field school programme appears to have achieved this.<br />
More generally in the discussion <strong>of</strong> facilitator effectives, two <strong>of</strong> the three FFS facilitators<br />
participated in the evaluation, consistently demonstrating familiarity with the <strong>2008</strong> programme<br />
precepts to involve farmers in analysis <strong>of</strong> their own situations while facilitating improved practices<br />
and production. The facilitators demonstrate excellent rapport with participant groups and know<br />
everybody by name. Even while preparing for the evaluation fieldwork, over eight months after the<br />
programme, facilitators still had participant phone numbers and were easily able to reach members<br />
and agree on meeting times. Staff even report that some have maintained informal FFS group<br />
contact since the programme, and that groups have periodically called with questions. It was<br />
obvious during fieldwork that participants were genuinely engaged with the programme through the<br />
mobilisation efforts <strong>of</strong> the facilitators – further evidenced by the time they were willing to engage<br />
with the evaluation to improve the programme for other participants elsewhere in the future, without<br />
any further benefit to themselves.<br />
Despite these strengths there are opportunities for improved staff capacity to facilitate farmer<br />
experimentation and analysis. The way participants are trained in particular practices also needs to<br />
be revisited so that a ‘training <strong>of</strong> trainers’ can be conducted for better group facilitation and<br />
communication skills. Facilitation and adult learning are in fact part <strong>of</strong> the FAO FFS facilitator<br />
training in which the three ACF facilitators participated, but these are complex topics that require<br />
ongoing development. Key skill areas for review include focus group facilitation, gender and power<br />
analysis, more confident use <strong>of</strong> rapid appraisal tools, and greater qualitative probing. Further time<br />
invested in facilitator skills could also be extended to a review <strong>of</strong> how participants are mobilised<br />
and trained, and how they are supported in their own experimentation.<br />
4.8 Programme design and implementation reflect gender analysis and decision making<br />
We already saw in Figure 6 above how much more consuming female agricultural roles tend to be<br />
than male. To extend this idea further the evaluation team confirmed the sex <strong>of</strong> all group<br />
committee members, on the hypothesis that women’s disproportionate role in agriculture would not<br />
be reflected in the group committee membership. The results are summarised below:<br />
16 All statistics from ILO Small Enterprise Media in Africa Project, The Effectiveness <strong>of</strong> Radio in Delivering Food Security<br />
and Agribusiness Information in Northern Uganda (unpublished draft 2, March 2009), pg 18.<br />
17 This example also demonstrates that data collection tools can be biased toward the type <strong>of</strong> results sought: The FAO<br />
data prove that FFS facilitators are the prevailing s<strong>our</strong>ce <strong>of</strong> agricultural information, just as the ILO data prove that radio<br />
is the primary s<strong>our</strong>ce. Respondent bias could also be an issue.<br />
<strong>Action</strong> <strong>Against</strong> <strong>Hunger</strong> Uganda - 39 - Farmer Field School <strong>Evaluation</strong>
Figure 24. Comparison <strong>of</strong> female and male FFS members and committee roles<br />
Group Membership<br />
by Sex<br />
Committee Membership<br />
by Sex<br />
Women<br />
54%<br />
Men<br />
46%<br />
Women<br />
23%<br />
Men<br />
77%<br />
The discrepancies are obvious, but run even deeper when looking at the level <strong>of</strong> leadership and<br />
prestige <strong>of</strong> committee roles and who tends to fill them:<br />
Figure 25. Comparison <strong>of</strong> gender role discrepancies in FFS committees 18<br />
Position Female (%) Male (%) Total (%)<br />
Chair 0 100 100<br />
Secretary 8 92 100<br />
Treasurer 75 25 100<br />
Coordinator 8 92 100<br />
Mobiliser 33 67 100<br />
Network Representative 0 100 100<br />
Production Leader 0 100 100<br />
Advisor 17 83 100<br />
The team expected that all or most <strong>of</strong> the chairs and secretaries would be men, but did not<br />
anticipate that most treasurers would be women. All respondents agreed that this reflects the fact<br />
that women are more reliable than men and less likely to misappropriate group funds. This is<br />
particularly interesting when considering that all bank accounts require two additional signatures in<br />
addition to the treasurer’s (usually the chair and secretary), meaning that a female treasurer does<br />
not in itself eliminate opportunities for graft or increase the transparency <strong>of</strong> collective financial<br />
records.<br />
Looking at the combined gender analyses <strong>of</strong> lab<strong>our</strong> division, meeting times, and committee<br />
membership we see that the FFS programme did not respond specifically to the different roles and<br />
responsibilities <strong>of</strong> women and men. Nor did it intend to. In the future, however, it may be possible<br />
for a more extended and inclusive design and planning process to spend more time looking at not<br />
only the different roles but also the different priorities <strong>of</strong> women and men in relation to managing<br />
household assets and production. In practice this could have translated into specific training<br />
sessions conducted separately and in plenary, or at different times <strong>of</strong> day to try meeting the needs<br />
<strong>of</strong> both. Despite the previously mentioned participant suggestion that all activities continue to be<br />
conducted for women and men alike (Section 3.1.1), it is nonetheless possible that after more<br />
meaningful discussion on the issue a different conclusion could result.<br />
4.9 Programme activities and inputs are seasonally appropriate and synchronised<br />
The short duration <strong>of</strong> the <strong>2008</strong> FFS programme is perhaps its single greatest limitation, echoed<br />
repeatedly by participants and staff throughout the evaluation. Beyond the questions <strong>of</strong> programme<br />
implementation dates or seasonally appropriate activities and inputs is that regardless how<br />
effective these might have been, they did not include the full range <strong>of</strong> activities undertaken in a<br />
single production cycle. In short, when the programme concluded on 31 July <strong>2008</strong> all group study<br />
and commercial crops were still standing. Practical sessions with FFS participants and ACF<br />
18 The FFS groups were free to establish their own committee structures. All groups had a chair, secretary, treasurer,<br />
coordinator, and mobiliser – but only some had different combinations <strong>of</strong> network representative, production leader, and<br />
advisor.<br />
<strong>Action</strong> <strong>Against</strong> <strong>Hunger</strong> Uganda - 40 - Farmer Field School <strong>Evaluation</strong>
facilitators on improved production techniques therefore only extended from land preparation to<br />
weeding, without any hands-on engagement with harvest or post-harvest practices. 19<br />
Even FAO reaches the same conclusion in its evaluation, suggesting that programme support and<br />
facilitation should be extended to “at least two crop cycles” if res<strong>our</strong>ces permit. 20 Two full cycles<br />
would in fact extend beyond a twelve month programme, given that second season harvest is<br />
generally not finished until December/January, in which case a one year programme would still not<br />
be able to engage with the second season post-harvest period. A full one year programme<br />
nonetheless could cover post-harvest practices with participants during first season in an approach<br />
that anticipates them working without facilitator backstopping during the second season.<br />
In addition to the <strong>2008</strong> missed opportunities for post-harvest practices, the short duration similarly<br />
prevented the programme from engaging with additional possibilities to contribute to household<br />
income (and therefore food) s<strong>our</strong>ces through group marketing for higher prices or possibly even<br />
value addition activities. Some <strong>of</strong> these were discussed with facilitators during the <strong>2008</strong><br />
programme, but like the post-harvest practices they were not put into practice. At least with the<br />
crop management practices covered during the FFSs the team has been able to conclude they<br />
were sufficiently practiced during the programme itself for participants to perpetuate them.<br />
More generally, the short period <strong>of</strong> implementation and input delays helped weaken programme<br />
impact. The most significant issues have already been introduced, namely that oxen, ploughs,<br />
goats, and cassava cuttings either did not arrive or were received too late. Reasons behind each <strong>of</strong><br />
these were not sought during the evaluation, but the key issues appear to be (the seasonal<br />
calendar in Appendix 1 helps contextualise these points):<br />
• Implementation commenced in practical terms in February rather than January as planned, but<br />
with land preparation also beginning in January it is advantageous to mobilise groups as early<br />
as possible in the year so that the programme can meaningfully engage with the complete<br />
production process.<br />
• Draught oxen were received by the groups in the second half <strong>of</strong> May, without an accompanying<br />
plough, after planting had been completed. Participants say that these inputs must be in hand<br />
by February at the latest if intended to contribute to first season production.<br />
• The cash grant should also be disbursed earlier than late March, when they were received in<br />
<strong>2008</strong>. Earlier disbursement ensures that groups can open their bank account more readily,<br />
begin additional contributions sooner, and purchase first season seeds and inputs without rush.<br />
• Assuming normal rainfall, the ideal time to plant cassava is between March and April. Cuttings<br />
intended for FFS groups were not received until May and subsequently were all redirected to<br />
unrelated groups in other ACF FSL programmes in Lango and Acholi.<br />
Additional guidance from participants and staff on the seasonal timing <strong>of</strong> implementation is<br />
summarised in the seasonal calendar (Appendix 1).<br />
4.10 Programme design is based on assessment and M&E planning<br />
That much <strong>of</strong> the data used in this evaluation are from FAO rather than ACF is revealing, as is the<br />
fact that the evaluation is structured according to a indicators and framework developed after the<br />
programme finished. This should no longer be possible as ACF Uganda has since agreed that all<br />
programmes should be designed and monitored according to a logical framework, regardless<br />
whether donors require one or not (which was the case for FAO).<br />
The ACF FFS proposal and inception report both include the planned development <strong>of</strong> a<br />
participatory M&E system, but this never happened. The reports similarly discuss how the<br />
programme will increase access to productive assets and strengthen household purchasing power,<br />
19 The <strong>of</strong>t-cited statistic from an (unidentified) FAO Uganda report is that preventable post-harvest losses can reach up to<br />
25% due largely to poor storage.<br />
20 FAO Uganda (<strong>2008</strong>) <strong>Evaluation</strong> <strong>of</strong> the Farmer Field School Approach in Uganda (pg 1).<br />
<strong>Action</strong> <strong>Against</strong> <strong>Hunger</strong> Uganda - 41 - Farmer Field School <strong>Evaluation</strong>
ut none <strong>of</strong> the monitoring conducted in <strong>2008</strong> included data necessary for reporting or analysis.<br />
Most <strong>of</strong> the programme monitoring was in fact conducted on behalf <strong>of</strong> FAO, concentrating on crop<br />
growth, with data collection and entry completed in the field and a spreadsheet emailed to FAO<br />
(unfortunately this did not include yield data). ACF also monitored the programme, concentrating<br />
entirely on quantitative cumulative progress <strong>of</strong> for example number <strong>of</strong> groups formed and bank<br />
accounts opened, types <strong>of</strong> enterprises selected, acres planted, number <strong>of</strong> people trained,<br />
additional assets constructed, number <strong>of</strong> household animals and symbolic assets, etc. Some <strong>of</strong> the<br />
above might have contributed to an evaluation, but certainly not to analysing changes in<br />
purchasing power, for example, which was the strongest statement <strong>of</strong> impact forecast in the<br />
proposal and inception report. Conducting this evaluation closer to the programme conclusion may<br />
have facilitated greater access to some <strong>of</strong> these data, but this proved to be surprisingly difficult.<br />
Aside from the fact that hard copy files had been stored already, there appeared little staff<br />
knowledge about what might be found in the files – such as whether they contained copies <strong>of</strong><br />
group pr<strong>of</strong>itability analyses or work plans. Some <strong>of</strong> the electronic data were found, but it was<br />
evident that – like the monitoring system on the whole – it was not stored in a manner that reflected<br />
its anticipated access or use. Nor were there final data against which the baseline could be<br />
contrasted. For these reasons the evaluation had to be based on predominantly external data and<br />
a retr<strong>of</strong>it framework. This made the exercise possible but has compromised its quality and<br />
relevance in that there are very few conclusions that can be drawn on the basis <strong>of</strong> FFS programme<br />
monitoring in <strong>2008</strong>.<br />
Greater investment in initial assessment for design followed by a more strategic commitment to<br />
baseline data collection and monitoring will ensure that information can be utilised more effectively<br />
during implementation and evaluation. This can ensure a more efficient use <strong>of</strong> staff time in the<br />
field, reduction in the costs associated with monitoring (like additional photocopying, vehicle travel,<br />
data entry, etc), and ultimately better reporting. Planning for M&E also helps field staff understand<br />
the content, purpose, and use <strong>of</strong> the information they are collecting. Recent ACF experience<br />
following the FFS programme suggests that greater field staff involvement in all aspects <strong>of</strong><br />
monitoring has improved the accuracy and reliability <strong>of</strong> their data collection. Greater foresight in<br />
data collection, management, and use will also help support ACF’s planned surveillance activities<br />
and enc<strong>our</strong>age greater comparability <strong>of</strong> data within and across departments.<br />
The method <strong>of</strong> initial assessment and baseline data collection, depending on how approached,<br />
might even be able to contribute to the originally intended participatory nature <strong>of</strong> FFS M&E. Any<br />
one <strong>of</strong> the RRA tools used during the evaluation fieldwork could generate participant perspectives<br />
on a range <strong>of</strong> issues pertaining to practices, production, gender, assets, transmission, etc. The<br />
specific criteria they use, the amounts they indicate, the priorities they establish could all be<br />
channelled into more meaningful indicators and monitoring. The same could prove true for a<br />
modified version <strong>of</strong> matrix scoring for pr<strong>of</strong>itability analysis and enterprise selection, as the tool by<br />
necessity would establish a range <strong>of</strong> criteria and preferences that could be evaluated for<br />
achievement at the end <strong>of</strong> the programme.<br />
4.11 Targeting based on vulnerability and integrated criteria<br />
It is difficult to establish precisely how the three programme parishes were selected, or how the<br />
participating communities therein were identified. At household level the process and criteria<br />
become clearer and more effective.<br />
Geographic priorities were established partly on the basis <strong>of</strong> FSL field staff experience and where<br />
they ‘knew’ vulnerability to food insecurity to be higher. As the programme map illustrates (Figure<br />
1), there was geographic overlap between the FFS parishes and other ACF activities in nutrition<br />
and WASH. Of particular interest are water user committees and village health teams, as they too<br />
reflect elements <strong>of</strong> group approaches to management and problem solving. The FFS programme<br />
locations were also all within the catchment area <strong>of</strong> ACF feeding centres. The evaluation team<br />
therefore expected more apparent connections between the FFS groups and those from WASH<br />
and nutrition, however in practice these were surprisingly few. Although not explored in depth<br />
during each focus group session, there was always a question or two about other ACF activities or<br />
<strong>Action</strong> <strong>Against</strong> <strong>Hunger</strong> Uganda - 42 - Farmer Field School <strong>Evaluation</strong>
groups in the area, about which many participants seemed to know surprisingly little. It was also<br />
expected that there might be some overlap between committee memberships, with the same<br />
person representing both a water group and a FFS group, for example. However in practice the<br />
evaluation team knowingly met only one water committee member and none <strong>of</strong> the village health<br />
team volunteers.<br />
The intended overlap <strong>of</strong> integrated programming was appropriate but would have benefited from<br />
additional rigor along the lines <strong>of</strong> what has since been developed by the Lango FSL team for 2009<br />
(see Appendix 4). New programming in the sub-region has commenced with analysis <strong>of</strong> the<br />
feeding centre data to identify priority parishes and, if possible, specific communities therein as the<br />
basis for geographic targeting. In addition to the geographic focus, the feeding centres <strong>of</strong>fer<br />
possible priorities for household targeting among those with children admitted or discharged from<br />
the centre.<br />
Household targeting in <strong>2008</strong> prioritised res<strong>our</strong>ce poor households, defined by FSL staff as<br />
disabled, female-headed, child-headed, elderly, HIV/AIDS affected, and disaster affected.<br />
Households should have been displaced then returned to what were the geographic priority areas.<br />
Households should have the ability and willingness to participate fully in programme activities and<br />
have access to arable land. Aside from the question <strong>of</strong> subjective interpretations <strong>of</strong> relative<br />
vulnerability, there appears to be nothing to document how specific locations or households were<br />
identified, vetted, or finalised. Similarly there are no data to synthesise pr<strong>of</strong>iles <strong>of</strong> participating<br />
households.<br />
Conversations with local authorities were also an important part <strong>of</strong> the FFS participant selection<br />
process. Building on district-level memoranda <strong>of</strong> understanding with ACF, parish level leaders are<br />
considered knowledgeable s<strong>our</strong>ces <strong>of</strong> information on ‘vulnerable’ locations and households. But<br />
again, there is no documentation into how these consultations were conducted or vulnerability<br />
defined. Large meetings were convened in the parish centre to advertise the programme and<br />
enc<strong>our</strong>age interested individuals to participate. Actually, the facilitators say that interest was<br />
usually so high at such meetings that the focus was more about trying to disc<strong>our</strong>age overly<br />
opportunistic participation. That is, the facilitators emphasised the work involved, the financial and<br />
temporal contributions required, and the levels <strong>of</strong> participation and transparency expected. All <strong>of</strong><br />
this helped some opt not to participate because they did not meet the criteria or because they<br />
could not commit to so much. In Minakulu the parish level consultations resulted in FFS groups<br />
composed <strong>of</strong> several individuals from up to five or six communities that together comprise a zone.<br />
Although the political advantages <strong>of</strong> equally distributing programme participation across a zone are<br />
obvious, this could over time weaken the solidarity or feasibility <strong>of</strong> the FFS groups. These groups,<br />
for example, were the only ones who indicated that a single pair <strong>of</strong> draught animals would be<br />
difficult to share. The same presumably would also apply in a more comprehensive FFS<br />
programme to collective bulking and sale. Even the onward transmission <strong>of</strong> FFS messages might<br />
be watered down by distributing the membership across too wide an area, rather than<br />
concentrating impact in strategic centres while striving to include satellite communities in activities<br />
like open days, exchange visits, or harvest comparisons.<br />
As a final test <strong>of</strong> the effectiveness <strong>of</strong> FFS household targeting, the team conducted a wealth<br />
ranking exercise with one group from each <strong>of</strong> the three parishes. The exercise (and related probing<br />
into relative wealth and vulnerability) helped determine what kinds <strong>of</strong> households comprise a FFS<br />
group and whether or not these are homogeneous. There was insufficient time to probe more<br />
deeply into what types <strong>of</strong> changes might be expected within particular types <strong>of</strong> households, but by<br />
cross-checking the <strong>2008</strong> participant lists with the wealth ranking results and sex composition <strong>of</strong><br />
group committees it was possible to compare wealth group results for both plenary groups and<br />
committee members: 21<br />
21 Each <strong>of</strong> the focus groups defined wealth differently but with team guidance all adhered to three categories to ensure<br />
comparability. Criteria were in all cases a combination <strong>of</strong> land, animals, household members, house and ro<strong>of</strong> type, etc.<br />
<strong>Action</strong> <strong>Against</strong> <strong>Hunger</strong> Uganda - 43 - Farmer Field School <strong>Evaluation</strong>
Figure 26. Wealth group analysis <strong>of</strong> FFS members and committees<br />
100%<br />
90%<br />
80%<br />
70%<br />
60%<br />
50%<br />
40%<br />
30%<br />
20%<br />
10%<br />
0%<br />
Opejal Aceno Oyoro Opejal Aceno Oyoro<br />
Better<br />
Middle<br />
Poor<br />
All Members<br />
Committee Members<br />
The wealth ranking results are enc<strong>our</strong>aging for the effectiveness <strong>of</strong> FFS household targeting,<br />
especially in Opejal and Aceno. Although there is not (yet) a specific target dictating what<br />
proportion <strong>of</strong> participants should be ‘poor’ we would nonetheless expect that most participants<br />
should fall into this category. At the same time, it may not be reasonable to expect that all<br />
households are poor, as the programmatic requirements for land, lab<strong>our</strong>, time, and finance may<br />
prohibit some <strong>of</strong> the poorest households while increasing the likelihood that more ‘middle’<br />
households join instead. The Opejal and Aceno results match this expectation, but the high<br />
proportion <strong>of</strong> middle households in Oyoro is difficult to explain.<br />
The wealth group composition <strong>of</strong> the group committees is also enc<strong>our</strong>aging, especially if compared<br />
with the preceding analysis <strong>of</strong> gender roles. The proportions within committee members are almost<br />
equal to those <strong>of</strong> the full group, but with an apparently slight bias toward the higher group (i.e.<br />
when compared with the corresponding plenary the committee members are more middle than<br />
poor, more rich than middle).<br />
As a final review <strong>of</strong> the analytical process behind geographic and household targeting, the map<br />
(Figure 1) includes a layer <strong>of</strong> col<strong>our</strong> indicating the integrated food security phase classification<br />
(IPC) at the time <strong>of</strong> programming. 22 Although the FFS groups are all in the lower Phase II area<br />
(compared with Phase III in Gulu and Amuru), this was a more appropriate place for<br />
implementation than the Phase III areas. Household returns were <strong>of</strong>ficially over in Lango, with<br />
households already in the process <strong>of</strong> re-establishing and recreating livelihood activities, which in<br />
turn allow greater FS engagement than displaced households or those in the process <strong>of</strong> return.<br />
22 www.ipcinfo.org<br />
<strong>Action</strong> <strong>Against</strong> <strong>Hunger</strong> Uganda - 44 - Farmer Field School <strong>Evaluation</strong>
Appendix A. Seasonal and programmatic calendar<br />
SEASONALITY<br />
First rain<br />
Second rain<br />
Land preparation<br />
Planting<br />
Weeding<br />
Harvest<br />
Dry period<br />
Flood risk<br />
Hail risk<br />
School fees<br />
High prices <strong>of</strong> staple foods<br />
Household food gap (MIHFP)<br />
High OTP admissions<br />
Low groundwater levels<br />
PROGRAMMING<br />
Facilitator FFS training<br />
Facilitator TOT and RRA training<br />
M&E system development<br />
FFS group formalisation<br />
Study and commercial enterprise selection<br />
Traction delivery and training<br />
Baseline assessment<br />
Cassava planting<br />
Cassava pass-on (2011)<br />
Field day when crops at best<br />
Exchange visits while germinating<br />
Goat restocking and treatment<br />
Post-harvest handling<br />
Open days<br />
Processing equipment delivery<br />
Cassava pass-on group formalisation<br />
Cassava harvest<br />
Radio broadcasts<br />
Final data collection and analysis<br />
Graduation<br />
2010<br />
Jan Feb Mar Apr May June July Aug Sept Oct Nov Dec<br />
<strong>Action</strong> <strong>Against</strong> <strong>Hunger</strong> Uganda - 45 - Farmer Field School <strong>Evaluation</strong>
Appendix B. Seed Flow Diagram (Groundnut, Red Beauty)<br />
In an attempt to understand better some <strong>of</strong> the community dynamics surrounding seed flow, the<br />
evaluation team facilitated the following diagram with FFS focus group respondents in Acan<br />
Kwette. Although neither rigorous nor complete, the illustration suggests that there are<br />
opportunities to increase the amount <strong>of</strong> seed retained within communities, estimated below as less<br />
than the amount purchased externally from traders.<br />
Cultivation & Harvest<br />
Seed S<strong>our</strong>ce<br />
(Red Beauty)<br />
Buy from<br />
trading centre<br />
52%<br />
Victoria Seeds<br />
0%<br />
Ow n storage<br />
14%<br />
Casual lab<strong>our</strong><br />
paid w ith<br />
seeds<br />
19%<br />
Loan w ithin<br />
community<br />
5%<br />
Buy from<br />
within<br />
community<br />
10%<br />
Sale<br />
Product Sale<br />
Sell to trader<br />
(Gulu)<br />
Sell to trader<br />
(Minakulu)<br />
Sell to trader<br />
(farm gate)<br />
Sell to other<br />
households<br />
<strong>Action</strong> <strong>Against</strong> <strong>Hunger</strong> Uganda - 46 - Farmer Field School <strong>Evaluation</strong>
Appendix C. Matrix Scoring Experiment for Enterprise Selection<br />
After completing fieldwork and agreeing on key findings and recommendations, the evaluation<br />
team experimented with two approaches to matrix scoring as a possible alternative to the currently<br />
complex approach to enterprise selection.<br />
Opinions were split regarding which approach would be more accessible to FFS participants more<br />
informative or which would reveal a more telling snapshot <strong>of</strong> decision making criteria. Nonetheless,<br />
it is interesting to see that each <strong>of</strong> the two trial groups reached identical conclusions about their top<br />
three choices: groundnut (red beauty), yellow bean, and hybrid maize.<br />
Regardless which approach is utilised, the team concluded that an approach along these lines<br />
would be more effective than that used in the <strong>2008</strong> programme.<br />
Matrix scoring version 1<br />
Vulnerable Vulnerable<br />
Crop<br />
to Pests to Disease<br />
Pigeon<br />
pea<br />
Groundnut<br />
(red<br />
beauty)<br />
Soy<br />
(nam1)<br />
Yellow<br />
bean<br />
Sesame<br />
(2)<br />
Rice<br />
(lowland)<br />
Maize<br />
(hybrid)<br />
Vulnerable<br />
to Drought<br />
Yield<br />
Maturity<br />
Period<br />
Production<br />
Costs<br />
Marketability Score Rank<br />
2 2 1 3 1 1 2 12 5<br />
3 3 3 3 3 2 3 20 1<br />
1 1 2 3 3 2 3 15 4<br />
3 3 3 2 3 2 3 19 2<br />
1 1 1 3 2 1 3 12 5<br />
1 1 1 3 3 3 3 15 4<br />
1 1 3 3 3 3 3 17 3<br />
Participant scoring is done horizontally, with each crop scored 1-3 (low-high) according to each criterion.<br />
Matrix scoring version 2<br />
Vulnerable Vulnerable<br />
Crop<br />
to Pests to Disease<br />
Pigeon<br />
pea<br />
Groundnut<br />
(red<br />
beauty)<br />
Soy<br />
(nam1)<br />
Yellow<br />
bean<br />
Sesame<br />
(2)<br />
Rice<br />
(lowland)<br />
Maize<br />
(hybrid)<br />
Vulnerable<br />
to Drought<br />
Yield<br />
Maturity<br />
Period<br />
Production<br />
Costs<br />
Marketability Score Rank<br />
4 0 0 3 0 0 1 8 4<br />
3 8 3 1 1 0 1 17 1<br />
0 0 1 1 2 2 1 7 5<br />
1 1 3 1 4 3 3 16 2<br />
1 0 1 2 1 1 1 7 5<br />
1 0 0 1 0 0 1 3 6<br />
0 1 2 1 2 4 2 12 3<br />
Participant scoring is done vertically, with a total <strong>of</strong> 10 points distributed throughout each column.<br />
<strong>Action</strong> <strong>Against</strong> <strong>Hunger</strong> Uganda - 47 - Farmer Field School <strong>Evaluation</strong>
Appendix D. Programme Tools for Targeting and Timing<br />
These are two <strong>of</strong> several possible tools that can be used for future programme targeting and<br />
planning. The first was developed in 2009 for cash transfer programme geographic targeting based<br />
on a range <strong>of</strong> complementary criteria, and represented an innovative step forward departmental<br />
integration.<br />
The second chart summarises admissions <strong>of</strong> children under five years old in the ACF feeding<br />
centres operational around each <strong>of</strong> the FFS areas. Such data are a first step in completing the<br />
preceding table for integrated targeting. More broadly, the trend line <strong>of</strong> nutrition admissions can<br />
provide an interesting counterpoint to trend lines for market prices <strong>of</strong> key commodities and months<br />
without inadequate household food provisioning. Analysing the relationship (or lack) between these<br />
three trends might <strong>of</strong>fer increased insight into seasonal shocks, which in turn could suggest<br />
possible impact indicators or the timing <strong>of</strong> certain activities (such as when cash grants should be<br />
dispersed to support households without undermining local markets).<br />
ACF FSL targeting tool for 2009 Otuke (Lango) livelihood recovery programme<br />
Sub-<br />
County<br />
Parish Villages Population<br />
# <strong>of</strong><br />
Children<br />
Under 5<br />
# <strong>of</strong><br />
Nutrition<br />
Admissions<br />
% <strong>of</strong><br />
Children<br />
< 5<br />
Admitted<br />
WASH<br />
2009<br />
FSL<br />
<strong>2008</strong><br />
FSL<br />
2009<br />
ACF feeding centre admissions <strong>of</strong> children under 5 (2007-<strong>2008</strong>)<br />
Admissions <strong>of</strong> Children < 5 Years<br />
800<br />
700<br />
600<br />
500<br />
400<br />
300<br />
200<br />
100<br />
0<br />
S<strong>our</strong>ce: ACF<br />
Jan 07<br />
Feb<br />
Mar<br />
Apr<br />
May<br />
Jun<br />
Jul<br />
Aug<br />
Sep<br />
Oct<br />
Nov<br />
Dec<br />
Jan 08<br />
Feb<br />
Mar<br />
Apr<br />
May<br />
Jun<br />
Jul<br />
Aug<br />
Sep<br />
Oct<br />
Nov<br />
Dec<br />
Minakulu Girls<br />
Minakulu Boys<br />
Ngai Girls<br />
Ngai Boys<br />
Okwang Girls<br />
Okwang Boys<br />
Adwari Girls<br />
Adwari Boys<br />
TREND<br />
<strong>Action</strong> <strong>Against</strong> <strong>Hunger</strong> Uganda - 48 - Farmer Field School <strong>Evaluation</strong>
Appendix E. <strong>Evaluation</strong> Methodology Diagram<br />
ACF<br />
Programme<br />
Documents & Data<br />
(<strong>2008</strong>)<br />
Secondary<br />
Data<br />
FAO<br />
<strong>Evaluation</strong> Data<br />
(<strong>2008</strong>)<br />
Secondary<br />
Literature and<br />
Data<br />
ACF Farmer Field<br />
School <strong>Evaluation</strong><br />
(April 2009)<br />
• Analysis<br />
• Findings<br />
• Recommendations<br />
Primary Data<br />
Targeting and<br />
social<br />
stratification<br />
(wealth ranking)<br />
Household food,<br />
income, expenditure<br />
(proportional piling)<br />
Targeting and<br />
social<br />
stratification<br />
(wealth ranking)<br />
Household food,<br />
income, expenditure<br />
(proportional piling)<br />
Focus Group<br />
Discussion Guide<br />
Focus Group<br />
Discussion Guide<br />
Coping strategies<br />
(pairwise ranking)<br />
Seasonality<br />
(calendar)<br />
Coping strategies<br />
(pairwise ranking)<br />
Seasonality<br />
(calendar)<br />
Opejal<br />
Targeting and<br />
social<br />
stratification<br />
(wealth ranking)<br />
Household food,<br />
income, expenditure<br />
(proportional piling)<br />
Oyoro<br />
Focus Group<br />
Discussion Guide<br />
Coping strategies<br />
(pairwise ranking)<br />
Seasonality<br />
(calendar)<br />
Aceno<br />
<strong>Action</strong> <strong>Against</strong> <strong>Hunger</strong> Uganda - 49 - Farmer Field School <strong>Evaluation</strong>
Appendix F. <strong>Evaluation</strong> Terms <strong>of</strong> Reference<br />
ACF Farmer Field School <strong>Evaluation</strong>: Terms <strong>of</strong> Reference<br />
Background<br />
Since mid-2006, security has improved greatly in the Lango sub-region. Voluntary resettlement has been a promising<br />
progression from an emergency situation. However, resettlement has been followed by an abrupt cut to humanitarian<br />
aid in the area followed by worrying trends in the food security situation. WFP found in April 2007 that 74% <strong>of</strong> all<br />
households in Lira resettlement area demonstrate some degree <strong>of</strong> food insecurity. 23 The percentage <strong>of</strong> food insecure<br />
households in Lira and Apac/Oyam was significantly higher than Gulu: 15%, 24% and 8% respectively. Additionally,<br />
ACF nutritional surveys conducted during the same period found that global acute malnutrition was considerably higher<br />
in Lango than Acholi, with underlying causes connected to food insecurity.<br />
Currently, the primary cause <strong>of</strong> food insecurity in Northern Lango is insufficient production at the household level.<br />
Land access has improved significantly since 2006, with households accessing up to 5.5 acres according to ACF<br />
monitoring. Nevertheless, increases in production have not followed suit. The main constraints to increased production<br />
are with household access to productive res<strong>our</strong>ces: hand hoes are still used by 84% <strong>of</strong> the population and tool ownership<br />
is a paltry two hoes and one panga per household. 24 Because <strong>of</strong> low crop production, households lack sufficient food for<br />
consumption, sale, or seed stocks. This is exacerbated by inefficient farming practices and inferior crop/seed storage<br />
practices, the combination <strong>of</strong> which decreases seed security.<br />
Newly resettled households will require several consistently successful harvests before agricultural efficiency can be<br />
discussed. They therefore require some form <strong>of</strong> assistance for at least a year and half after their resettlement. Estimates<br />
for <strong>2008</strong> harvests were initially good, but below average rainfall is raising concern as the year progresses. Pockets <strong>of</strong> the<br />
sub-region are likely to have poor harvests for second season <strong>2008</strong> due to late land preparation, delayed planting, and<br />
uneven rainfall distribution, especially in the northern sub-counties. The above conditions could have potential long<br />
term effects on household resilience and food security into 2009.<br />
Local markets are functioning and have food available, but they are poor in quantity and diversity <strong>of</strong> foods because <strong>of</strong><br />
low local production. Household cash access is poor and multiple forms <strong>of</strong> income are needed to ensure basic needs can<br />
be met. Re-growth <strong>of</strong> the livestock sector has been slow due to lack <strong>of</strong> household capital, low levels <strong>of</strong> animals in the<br />
area, and sharp price increases for both fuel and staple foods that have doubled or in some cases tripled since 2005.<br />
Lango is currently a major s<strong>our</strong>ce <strong>of</strong> animals for Acholi, which has the potential to stagnate animal population growth<br />
in the latter sub-region. Demand for meat and milk are not met by the local supply either.<br />
Farmer Field Schools<br />
Farmer Field Schools (FFS) comprise <strong>of</strong> a group <strong>of</strong> rural producers who come together with a common agricultural<br />
interest or problem which they want to solve together. Members meet on a regular basis to study the “how and why” <strong>of</strong><br />
a particular situation. Farmers make regular field observations, then relate to their past experience before making an<br />
appropriate enterprise management decision to improve their production.<br />
ACF, in partnership with FAO, facilitated formation <strong>of</strong> twelve farmer field school groups (with a total <strong>of</strong> 320<br />
households) in Minakulu sub-county <strong>of</strong> Lira district, Lango sub-region. Implementation was from January to July<br />
<strong>2008</strong>. The main focus <strong>of</strong> the FFS approach was to facilitate experiential learning for community empowerment along<br />
the following two sets <strong>of</strong> parallel objectives:<br />
23 WFP (2007) Emergency Food Security Assessment <strong>of</strong> IDP Camps and Settled Areas in Northern and North-Eastern<br />
Conflict Affected Regions.<br />
24 Data from <strong>2008</strong> 1 st season seed fair, post-distribution monitoring.<br />
<strong>Action</strong> <strong>Against</strong> <strong>Hunger</strong> Uganda - 50 - Farmer Field School <strong>Evaluation</strong>
Institutional<br />
• FFS shorten the times it takes to get research from station to<br />
adoption in farmer fields by involving farmers in their own<br />
experimentation<br />
• Enhance the capacity <strong>of</strong> extension workers to serve as<br />
technically skilled and group sensitive facilitators <strong>of</strong> farmer’s<br />
experiential learning.<br />
• Increase the competency <strong>of</strong> extension services to provide<br />
farmer education that responds more effectively to local<br />
res<strong>our</strong>ces and conditions<br />
• Contribute information on the replicability and effectiveness<br />
<strong>of</strong> FFSs as an alternative and sustainable mechanism for<br />
extension service delivery<br />
Community<br />
• Empower farmers with knowledge and skills in farming<br />
• Sharpen farmer ability in making logical decisions on what<br />
works best for them, based on their own observations <strong>of</strong><br />
experimental and validation plots<br />
• Promote group initiatives that are able to solve own<br />
community problems and facilitate the work <strong>of</strong> other<br />
development players by providing a demand driven system<br />
• Establish high level <strong>of</strong> networking by groups to handle<br />
emerging follow up with community activities [marketing,<br />
res<strong>our</strong>ce mobilization processing, contract farming, etc]<br />
Based on enc<strong>our</strong>aging participant report and positive feedback from FAO on the relative strengths <strong>of</strong> the ACF farmer<br />
field schools, ACF plans to expand the approach in Lango sub-region during 2009 and to pilot the initiative in Acholi<br />
sub-region at the same time. Before scaling up, however, an evaluation is required to review achievement and improve<br />
the approach.<br />
<strong>Evaluation</strong> Objectives<br />
1. To evaluate the FFS methodology and process for 12 groups in Minakulu and Okwang sub-counties.<br />
2. To evaluate FFS impact on household food security and livelihoods, according to qualitative and quantitative data<br />
analysis generated through questionnaires, focus groups, and interviews.<br />
3. To identify existing strengths and weaknesses in ACF FFS implementation and M&E.<br />
4. To involve ACF staff in an applied learning opportunity and identify training needs improved FFS implementation<br />
and M&E.<br />
5. To develop specific recommendations for improved FFS programming in 2009.<br />
<strong>Evaluation</strong> Process<br />
Phase one <strong>of</strong> the evaluation will build on a recently concluded quantitative evaluation <strong>of</strong> the farmer field school<br />
approach in Uganda, completed by FAO in July <strong>2008</strong>. Sections <strong>of</strong> the FAO data collection tool will be used in order to<br />
ensure comparability <strong>of</strong> ACF results with national trends identified in the FAO data. ACF field extension workers will<br />
be briefed on the evaluation objectives and trained in use <strong>of</strong> the quantitative data collection tool before collecting data<br />
from the 12 FFS groups. If possible, one control group (not participating in the FFS) will participate from each location<br />
for further comparative analysis.<br />
Phase two <strong>of</strong> the evaluation will utilise initial analysis <strong>of</strong> the quantitative data as the basis for focus group discussions in<br />
each FFS location so that causes, effects, preferences, etc can be understood in greater detail. Seasonality <strong>of</strong> activities<br />
and inputs will be analysed, preferably building upon a seasonal calendar already developed by ACF field extension<br />
workers. Matrix scoring and proportional piling could be included in the focus groups, depending on initial results from<br />
the quantitative data collection and subsequent identification <strong>of</strong> analytical priorities. The possibility <strong>of</strong> genderdisaggregated<br />
groups will also be explored to consider possible differences in gender impact <strong>of</strong> FFS activities on<br />
women and men.<br />
Key Documents<br />
• ACF-FAO letters <strong>of</strong> agreement and project proposals<br />
• ACF progress and final report to FAO<br />
• FAO evaluation <strong>of</strong> farmer field schools in Uganda<br />
• Draft logical framework for 2009 ACF FFS M&E<br />
• Quantitative data analysis results <strong>of</strong> ACF <strong>2008</strong> output indicators<br />
<strong>Action</strong> <strong>Against</strong> <strong>Hunger</strong> Uganda - 51 - Farmer Field School <strong>Evaluation</strong>
Outputs<br />
1. Development <strong>of</strong> ACF farmer field school logical framework: objective, results, activities, indicators, means <strong>of</strong><br />
verification, assumptions, and risk management. To be annexed to the final report.<br />
2. Final, concise report structured according to the logical framework, including comparison <strong>of</strong> available baseline data<br />
against progress achieved to date and identification <strong>of</strong> existing gaps in ACF FFS M&E. This will include but not be<br />
limited to:<br />
o Demonstrated capacity in new planting techniques (rows, spacing).<br />
o Changes in agricultural production resulting from new techniques and inputs.<br />
o Differences in crop quality, compared with non-FFS participants in same location.<br />
o FFS group and individual savings (amounts, use).<br />
o Seasonal appropriateness <strong>of</strong> inputs and activities.<br />
o Increased knowledge <strong>of</strong> soil fertility management.<br />
o Increased knowledge <strong>of</strong> importance <strong>of</strong> environmental preservation.<br />
o Prevalence <strong>of</strong> appropriate drying, packing, storing techniques and facilities.<br />
o Utility <strong>of</strong> farmer field days in <strong>2008</strong> and their potential in future FFS.<br />
o Effectiveness <strong>of</strong> FFS training modules (and recommendations on possible curriculum changes and how to<br />
assess training effectiveness more systematically in 2009).<br />
o Anticipated sustainability <strong>of</strong> promoted ideas, practices, and inputs <strong>of</strong> <strong>2008</strong>.<br />
o Priorities for improving FFS facilitator training skills.<br />
o Evidence <strong>of</strong> onward transmission <strong>of</strong> knowledge, practices, seeds, etc from FFS participant to other(s) in<br />
community.<br />
o Participant perception <strong>of</strong> their input into FFS design and implementation in <strong>2008</strong>.<br />
o Relevance <strong>of</strong> farmer field schools to the current context <strong>of</strong> household livelihoods and food security in the<br />
Lango sub-region.<br />
o Guidance on future implementation <strong>of</strong> FFS, including all aspects <strong>of</strong> targeting, design, seasonality, enterprises,<br />
M&E, etc from the perspectives <strong>of</strong> participating groups, non-participants, ACF staff, and the evaluation team.<br />
Qualifications<br />
• Minimum six years <strong>of</strong> programmatic experience in agronomy, food security, livelihoods, or related subject.<br />
• Advanced university degree in relevant discipline.<br />
• Experience in designing, leading, and reporting on development project evaluations.<br />
• Demonstrated experience in field staff capacity building, ideally in an applied learning context.<br />
• Excellent English report writing skills; ability to summarise findings and data concisely, and to develop clear<br />
conclusions and practical recommendations that are linked directly with findings.<br />
• Ability to facilitate, train others in, and analyse findings from participatory research tools (particularly matrix<br />
scoring, proportional piling, and pairwise ranking).<br />
• Fluent spoken Luo.<br />
Timing<br />
Design and preparation Mon Mar 23 Fri Mar 27<br />
Travel & workshop Mon Mar 30 Wed Apr 1<br />
Fieldwork at 10 sites Thu Apr 2 Wed Apr 8<br />
Debrief & base analysis Wed Apr 8 Fri Apr 10<br />
Draft & comments Mon Apr 13 Mon Apr 13<br />
Final report Tue Apr 14 Fri Apr 17<br />
<strong>Action</strong> <strong>Against</strong> <strong>Hunger</strong> Uganda - 52 - Farmer Field School <strong>Evaluation</strong>
Appendix G. Field Tools<br />
Farmer Field School <strong>Evaluation</strong> Discussion Guide<br />
<strong>Evaluation</strong> Objectives:<br />
1. To assess the performance and impact <strong>of</strong> ACF facilitated farmer field schools in the Lango subregion.<br />
2. To document the strengths and weaknesses <strong>of</strong> the <strong>2008</strong> FFS programme for improved<br />
performance and impact in subsequent implementation.<br />
3. To build ACF field staff capacity in food security, livelihoods, rapid appraisal tools, and<br />
evaluation.<br />
1. Introduction<br />
2. Background<br />
3. Improved health,<br />
water, practices, food<br />
security, and livelihoods<br />
Topic<br />
Farmer field school<br />
approach<br />
ACF FFS programme<br />
<strong>Evaluation</strong> objectives<br />
Context summary<br />
Location<br />
Community<br />
Population<br />
Other ACF programmes<br />
Existing quantitative data<br />
(ACF + FAO)<br />
Dietary diversity score<br />
Coping strategies<br />
Food, income,<br />
expenditure<br />
Months <strong>of</strong> adequate<br />
household food<br />
provisioning<br />
FFS facilitators as s<strong>our</strong>ces<br />
<strong>of</strong> information and skills<br />
Changes in household<br />
assets<br />
Appropriateness<br />
Gender<br />
Targeting<br />
Information Required<br />
• Rationale and approach<br />
• Rationale, locations, approach<br />
• Impact, performance, capacity building<br />
• Displacement times<br />
• Duration <strong>of</strong> displacement<br />
•<br />
• Wealth group criteria<br />
•<br />
• Comparison with nutrition admissions<br />
• VHTs in same area<br />
• Other/previous WASH and FSL programming in location<br />
• Timing <strong>of</strong> previous data collection<br />
• Any <strong>of</strong> the same respondents?<br />
• Food preferences<br />
• Differences for wealth groups<br />
• Low diversity normal or could changes be expected?<br />
• Types<br />
• Frequency and seasonality<br />
• Relative severity – PAIRWISE RANKING TOOL<br />
• PROPORTIONAL PILING TOOL<br />
• Which months<br />
• Same every year, or only sometimes?<br />
• Which wealth groups<br />
• NAADS<br />
• Radio?<br />
• How was this done before FFSs<br />
• What will happen for others not in the FFS (lead farmers?)<br />
• Additional stoves, latrines, racks, pits, kitchens, etc<br />
• Symbolic assets like radios and bicycles<br />
• Approach<br />
• Activities<br />
• Inputs<br />
• Timing <strong>of</strong> delivery (bulls, ploughs, grinders, hullers, goats,<br />
cuttings, cash)<br />
• Female/male leadership ratios<br />
• Participation by wealth group<br />
• WEALTH RANKING TOOL<br />
<strong>Action</strong> <strong>Against</strong> <strong>Hunger</strong> Uganda - 53 - Farmer Field School <strong>Evaluation</strong>
4. Improved crop and<br />
livestock practices<br />
5. Increased crop and<br />
livestock production<br />
Training <strong>of</strong> ACF<br />
facilitators<br />
Participant skill training<br />
Demonstration gardens<br />
Practices promoted<br />
through the FFS<br />
Record keeping<br />
Documentation<br />
Post-harvest handling<br />
Enterprise selection<br />
capacity<br />
Acreage<br />
Crop production<br />
Livestock production<br />
Marketing<br />
Cassava multiplication<br />
• By FAO<br />
• By ACF<br />
• Refresher<br />
• Decreased attendance<br />
• Relevance <strong>of</strong> topics<br />
• Timing and location <strong>of</strong> sessions (actual vs female/male<br />
preferences)<br />
• Where<br />
• What technology and practices<br />
• Describe experimentation process<br />
• Other community experimentation or transfer<br />
• Most useful aspect <strong>of</strong> demonstration sites<br />
• How to do differently next time for others<br />
• Which practices promoted<br />
• Relevance<br />
• Adoption; still applied<br />
• Others that should have been included<br />
• Onward transfer to others<br />
• Types<br />
• Quality <strong>of</strong> records<br />
• Group access and transparency<br />
• Perception <strong>of</strong> record keeping<br />
• Where kept<br />
• Lag between action and notation<br />
• Too complicated to maintain?<br />
• Group constitution<br />
• Business plan<br />
• Work plan<br />
• Enterprise selection<br />
• Budget<br />
• Certificate <strong>of</strong> registration<br />
• Minutes<br />
• Whether all kept together<br />
• Practices<br />
• Individual or group storage; types<br />
• Question <strong>of</strong> practice or inputs<br />
• Pr<strong>of</strong>itability analysis<br />
• Seed selection<br />
• Site selection<br />
• practices<br />
• Changes and trend (access vs utilisation)<br />
• No increase for non-participants?<br />
• Types <strong>of</strong> crops for first and second season<br />
• Quantity<br />
• Quality<br />
• Factors<br />
• Changes<br />
• Housing<br />
• Practices<br />
• Changes<br />
• Complementarity <strong>of</strong> small ruminants to cultivation<br />
• Farm gate or town<br />
• Prices<br />
• Variety<br />
• Late FAO delivery and ACF reallocation to other groups<br />
• Pass on group identification, timing, follow up<br />
• Whether cassava should be included in future FFSs<br />
<strong>Action</strong> <strong>Against</strong> <strong>Hunger</strong> Uganda - 54 - Farmer Field School <strong>Evaluation</strong>
6. Enhanced income<br />
generation and<br />
management capacity<br />
7. Recommendations for<br />
design, targeting,<br />
implementation, and<br />
M&E<br />
Markets<br />
Value addition<br />
Seed multiplication and<br />
marketing<br />
Savings<br />
Credit<br />
Possible interventions &<br />
linkages<br />
Timing <strong>of</strong> activities and<br />
inputs<br />
M&E considerations<br />
• Access<br />
• Demand<br />
• Linkages<br />
• Missing FAO equipment<br />
• Current processing in area<br />
• Ideas and opportunities<br />
• Experience with Victoria Seeds (Minakulu)<br />
• Comparative pr<strong>of</strong>itability<br />
• Record keeping<br />
• Transparency<br />
• Amount<br />
• Where kept<br />
• Type (food or cash)<br />
• Increase or decrease<br />
• S<strong>our</strong>ce<br />
• Amount<br />
• Purpose<br />
•<br />
•<br />
•<br />
<strong>Action</strong> <strong>Against</strong> <strong>Hunger</strong> Uganda - 55 - Farmer Field School <strong>Evaluation</strong>
Location: _______________________<br />
Date: ______________<br />
FFS group new?<br />
o Yes<br />
o No<br />
Preferred FEMALE meeting time: _______________________<br />
Preferred MALE meeting time: _______________________<br />
At what time <strong>of</strong> day did group routinely meet? ________________________<br />
Representation (female/male):<br />
Chair _______<br />
Secretary _______<br />
Treasurer _______<br />
Market Coord _______<br />
Mobiliser _______<br />
Network Rep _______<br />
How was pr<strong>of</strong>it from study enterprise used?<br />
o To expand enterprise<br />
o To start another enterprise<br />
o Distributed to members<br />
o Deposited in the group account<br />
o To buy inputs and distribute to members<br />
o Other: ________________________________________________________<br />
How was pr<strong>of</strong>it from commercial enterprise used?<br />
o To expand enterprise<br />
o To start another enterprise<br />
o Distributed to members<br />
o Deposited in the group account<br />
o To buy inputs and distribute to members<br />
o Other: ________________________________________________________<br />
Is the group bank account still open?<br />
o Yes<br />
o No<br />
If yes, what is the current balance? Ugx _______________<br />
<strong>Action</strong> <strong>Against</strong> <strong>Hunger</strong> Uganda - 56 - Farmer Field School <strong>Evaluation</strong>
Coping Strategies<br />
Location: _______________________<br />
Date: ______________<br />
A.<br />
Rely on less<br />
preferred, less<br />
expensive food<br />
B.<br />
Borrow food<br />
from friend or<br />
relative<br />
C.<br />
Purchase food<br />
on credit<br />
A.<br />
Rely on less<br />
preferred, less<br />
expensive food<br />
B.<br />
Borrow food<br />
from friend or<br />
relative<br />
C.<br />
Purchase food<br />
on credit<br />
D.<br />
Consume wild<br />
foods and<br />
animals<br />
E.<br />
Reduce the<br />
portion size <strong>of</strong><br />
meals<br />
F.<br />
Reduce the<br />
number <strong>of</strong><br />
meals per day<br />
G.<br />
Skip entire<br />
days without<br />
meals<br />
D.<br />
Consume wild<br />
foods and<br />
animals<br />
E.<br />
Reduce the<br />
portion size <strong>of</strong><br />
meals<br />
F.<br />
Reduce the<br />
number <strong>of</strong><br />
meals per day<br />
G.<br />
Skip entire<br />
days without<br />
meals<br />
SCORE<br />
RANK<br />
<strong>Action</strong> <strong>Against</strong> <strong>Hunger</strong> Uganda - 57 - Farmer Field School <strong>Evaluation</strong>
The Household Economy<br />
Location: _______________________<br />
Date: ______________<br />
Food S<strong>our</strong>ces<br />
1. Own crop production<br />
2. Own livestock production<br />
3. Market purchase<br />
4. Wild foods (gathered and consumed by HH)<br />
5. Food aid (food or food vouchers from UN/NGO, including general distribution and food for work)<br />
6. Casual labor (for food wage, not from UN/NGO)<br />
7. Gifts/begging (received from outside the HH without expectation <strong>of</strong> reimbursement)<br />
8. Loans (received from outside the HH with expectation <strong>of</strong> repayment)<br />
9. Other<br />
Total 100<br />
Income S<strong>our</strong>ces<br />
1. Own crop production<br />
2. Own livestock production<br />
3. Casual labor (unskilled, for cash wage)<br />
4. Artisan (skilled labor, even if casual)<br />
5. Petty trade (kiosks, salon, boda boda, hotel, etc)<br />
6. Bush products (HH collection and sale <strong>of</strong> wood, charcoal, grass, etc)<br />
7. Gifts/begging (received from outside the HH without expectation <strong>of</strong> reimbursement)<br />
8. Loans (received from outside the HH with expectation <strong>of</strong> repayment)<br />
9. Other<br />
Total 100<br />
Expenditure<br />
1. Food for the household<br />
2. Ag/vet inputs (seeds, tools, spray, vaccines, etc)<br />
3. Transportation (<strong>of</strong> self or ag/vet products)<br />
4. Household items (matches, kerosene, clothing, kitchen tools, etc)<br />
5. Debt/loan repayment (cash expenditure, not food)<br />
6. Health<br />
7. Education (fees, books, uniforms, etc)<br />
8. Cigarettes and alcohol<br />
9. Other<br />
Total 100<br />
<strong>Action</strong> <strong>Against</strong> <strong>Hunger</strong> Uganda - 58 - Farmer Field School <strong>Evaluation</strong>