Participatory Evaluation of our 2008 - Action Against Hunger
Participatory Evaluation of our 2008 - Action Against Hunger
Participatory Evaluation of our 2008 - Action Against Hunger

Create successful ePaper yourself
Turn your PDF publications into a flip-book with our unique Google optimized e-Paper software.
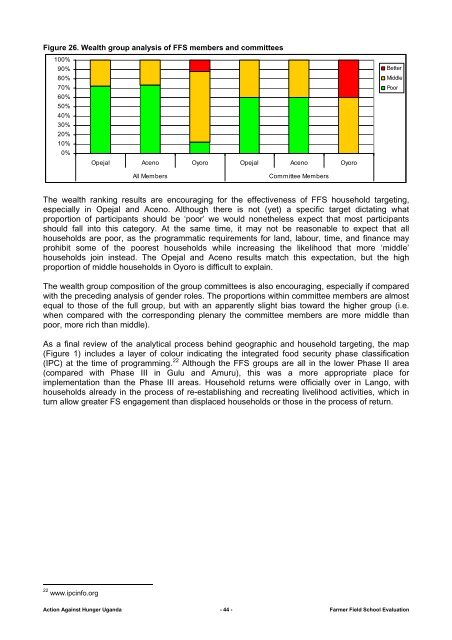
Figure 26. Wealth group analysis <strong>of</strong> FFS members and committees<br />
100%<br />
90%<br />
80%<br />
70%<br />
60%<br />
50%<br />
40%<br />
30%<br />
20%<br />
10%<br />
0%<br />
Opejal Aceno Oyoro Opejal Aceno Oyoro<br />
Better<br />
Middle<br />
Poor<br />
All Members<br />
Committee Members<br />
The wealth ranking results are enc<strong>our</strong>aging for the effectiveness <strong>of</strong> FFS household targeting,<br />
especially in Opejal and Aceno. Although there is not (yet) a specific target dictating what<br />
proportion <strong>of</strong> participants should be ‘poor’ we would nonetheless expect that most participants<br />
should fall into this category. At the same time, it may not be reasonable to expect that all<br />
households are poor, as the programmatic requirements for land, lab<strong>our</strong>, time, and finance may<br />
prohibit some <strong>of</strong> the poorest households while increasing the likelihood that more ‘middle’<br />
households join instead. The Opejal and Aceno results match this expectation, but the high<br />
proportion <strong>of</strong> middle households in Oyoro is difficult to explain.<br />
The wealth group composition <strong>of</strong> the group committees is also enc<strong>our</strong>aging, especially if compared<br />
with the preceding analysis <strong>of</strong> gender roles. The proportions within committee members are almost<br />
equal to those <strong>of</strong> the full group, but with an apparently slight bias toward the higher group (i.e.<br />
when compared with the corresponding plenary the committee members are more middle than<br />
poor, more rich than middle).<br />
As a final review <strong>of</strong> the analytical process behind geographic and household targeting, the map<br />
(Figure 1) includes a layer <strong>of</strong> col<strong>our</strong> indicating the integrated food security phase classification<br />
(IPC) at the time <strong>of</strong> programming. 22 Although the FFS groups are all in the lower Phase II area<br />
(compared with Phase III in Gulu and Amuru), this was a more appropriate place for<br />
implementation than the Phase III areas. Household returns were <strong>of</strong>ficially over in Lango, with<br />
households already in the process <strong>of</strong> re-establishing and recreating livelihood activities, which in<br />
turn allow greater FS engagement than displaced households or those in the process <strong>of</strong> return.<br />
22 www.ipcinfo.org<br />
<strong>Action</strong> <strong>Against</strong> <strong>Hunger</strong> Uganda - 44 - Farmer Field School <strong>Evaluation</strong>