Participatory Evaluation of our 2008 - Action Against Hunger
Participatory Evaluation of our 2008 - Action Against Hunger
Participatory Evaluation of our 2008 - Action Against Hunger

You also want an ePaper? Increase the reach of your titles
YUMPU automatically turns print PDFs into web optimized ePapers that Google loves.
attributed directly to ACF or the programme – only assumed (perhaps indirectly resulting from the<br />
increased access to savings or credit, or increased production accomplished through improved<br />
practices).<br />
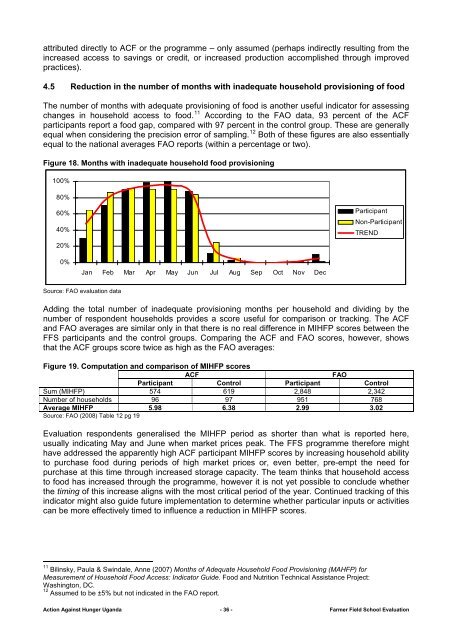
4.5 Reduction in the number <strong>of</strong> months with inadequate household provisioning <strong>of</strong> food<br />
The number <strong>of</strong> months with adequate provisioning <strong>of</strong> food is another useful indicator for assessing<br />
changes in household access to food. 11 According to the FAO data, 93 percent <strong>of</strong> the ACF<br />
participants report a food gap, compared with 97 percent in the control group. These are generally<br />
equal when considering the precision error <strong>of</strong> sampling. 12 Both <strong>of</strong> these figures are also essentially<br />
equal to the national averages FAO reports (within a percentage or two).<br />
Figure 18. Months with inadequate household food provisioning<br />
100%<br />
80%<br />
60%<br />
40%<br />
20%<br />
Participant<br />
Non-Participant<br />
TREND<br />
0%<br />
Jan Feb Mar Apr May Jun Jul Aug Sep Oct Nov Dec<br />
S<strong>our</strong>ce: FAO evaluation data<br />
Adding the total number <strong>of</strong> inadequate provisioning months per household and dividing by the<br />
number <strong>of</strong> respondent households provides a score useful for comparison or tracking. The ACF<br />
and FAO averages are similar only in that there is no real difference in MIHFP scores between the<br />
FFS participants and the control groups. Comparing the ACF and FAO scores, however, shows<br />
that the ACF groups score twice as high as the FAO averages:<br />
Figure 19. Computation and comparison <strong>of</strong> MIHFP scores<br />
ACF<br />
FAO<br />
Participant Control Participant Control<br />
Sum (MIHFP) 574 619 2,848 2,342<br />
Number <strong>of</strong> households 96 97 951 768<br />
Average MIHFP 5.98 6.38 2.99 3.02<br />
S<strong>our</strong>ce: FAO (<strong>2008</strong>) Table 12 pg 19<br />
<strong>Evaluation</strong> respondents generalised the MIHFP period as shorter than what is reported here,<br />
usually indicating May and June when market prices peak. The FFS programme therefore might<br />
have addressed the apparently high ACF participant MIHFP scores by increasing household ability<br />
to purchase food during periods <strong>of</strong> high market prices or, even better, pre-empt the need for<br />
purchase at this time through increased storage capacity. The team thinks that household access<br />
to food has increased through the programme, however it is not yet possible to conclude whether<br />
the timing <strong>of</strong> this increase aligns with the most critical period <strong>of</strong> the year. Continued tracking <strong>of</strong> this<br />
indicator might also guide future implementation to determine whether particular inputs or activities<br />
can be more effectively timed to influence a reduction in MIHFP scores.<br />
11 Bilinsky, Paula & Swindale, Anne (2007) Months <strong>of</strong> Adequate Household Food Provisioning (MAHFP) for<br />
Measurement <strong>of</strong> Household Food Access: Indicator Guide. Food and Nutrition Technical Assistance Project:<br />
Washington, DC.<br />
12 Assumed to be ±5% but not indicated in the FAO report.<br />
<strong>Action</strong> <strong>Against</strong> <strong>Hunger</strong> Uganda - 36 - Farmer Field School <strong>Evaluation</strong>