Convention Paper - Menno van der Veen
Convention Paper - Menno van der Veen
Convention Paper - Menno van der Veen

Create successful ePaper yourself
Turn your PDF publications into a flip-book with our unique Google optimized e-Paper software.
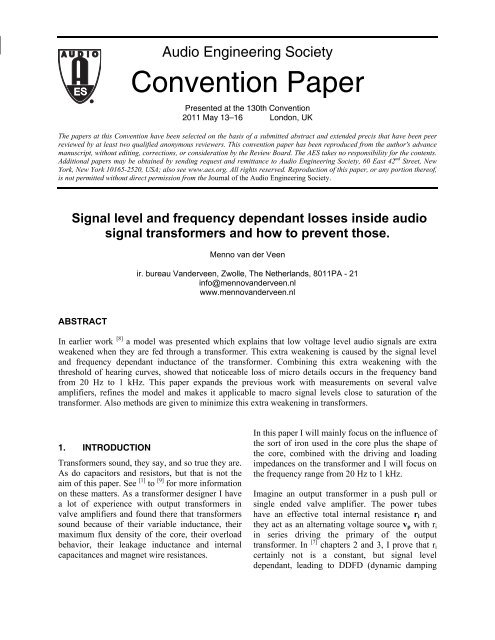
Audio Engineering Society<br />
<strong>Convention</strong> <strong>Paper</strong><br />
Presented at the 130th <strong>Convention</strong><br />
2011 May 13–16 London, UK<br />
The papers at this <strong>Convention</strong> have been selected on the basis of a submitted abstract and extended precis that have been peer<br />
reviewed by at least two qualified anonymous reviewers. This convention paper has been reproduced from the author's ad<strong>van</strong>ce<br />
manuscript, without editing, corrections, or consi<strong>der</strong>ation by the Review Board. The AES takes no responsibility for the contents.<br />
Additional papers may be obtained by sending request and remittance to Audio Engineering Society, 60 East 42 nd Street, New<br />
York, New York 10165-2520, USA; also see www.aes.org. All rights reserved. Reproduction of this paper, or any portion thereof,<br />
is not permitted without direct permission from the Journal of the Audio Engineering Society.<br />
Signal level and frequency dependant losses inside audio<br />
signal transformers and how to prevent those.<br />
<strong>Menno</strong> <strong>van</strong> <strong>der</strong> <strong>Veen</strong><br />
ir. bureau Van<strong>der</strong>veen, Zwolle, The Netherlands, 8011PA - 21<br />
info@menno<strong>van</strong><strong>der</strong>veen.nl<br />
www.menno<strong>van</strong><strong>der</strong>veen.nl<br />
ABSTRACT<br />
In earlier work [8] a model was presented which explains that low voltage level audio signals are extra<br />
weakened when they are fed through a transformer. This extra weakening is caused by the signal level<br />
and frequency dependant inductance of the transformer. Combining this extra weakening with the<br />
threshold of hearing curves, showed that noticeable loss of micro details occurs in the frequency band<br />
from 20 Hz to 1 kHz. This paper expands the previous work with measurements on several valve<br />
amplifiers, refines the model and makes it applicable to macro signal levels close to saturation of the<br />
transformer. Also methods are given to minimize this extra weakening in transformers.<br />
1. INTRODUCTION<br />
Transformers sound, they say, and so true they are.<br />
As do capacitors and resistors, but that is not the<br />
aim of this paper. See [1] to [9] for more information<br />
on these matters. As a transformer designer I have<br />
a lot of experience with output transformers in<br />
valve amplifiers and found there that transformers<br />
sound because of their variable inductance, their<br />
maximum flux density of the core, their overload<br />
behavior, their leakage inductance and internal<br />
capacitances and magnet wire resistances.<br />
In this paper I will mainly focus on the influence of<br />
the sort of iron used in the core plus the shape of<br />
the core, combined with the driving and loading<br />
impedances on the transformer and I will focus on<br />
the frequency range from 20 Hz to 1 kHz.<br />
Imagine an output transformer in a push pull or<br />
single ended valve amplifier. The power tubes<br />
have an effective total internal resistance r i and<br />
they act as an alternating voltage source v p with r i<br />
in series driving the primary of the output<br />
transformer. In [7] chapters 2 and 3, I prove that r i<br />
certainly not is a constant, but signal level<br />
dependant, leading to DDFD (dynamic damping
<strong>Menno</strong> <strong>van</strong> <strong>der</strong> <strong>Veen</strong><br />
Signal weakening in audio transformers<br />
factor distortion). See figure-1 which demonstrates<br />
this effect.<br />
figure 2: Equivalent circuit of valve amp driving<br />
the loudspeaker Zs and Lp.<br />
figure 1: Dynamic Damping Factor Distortion<br />
where Zout (vertical axis) of a UL40 valve amp [11]<br />
depends on the output level and the frequency.<br />
For now I assume r i to be constant. If I would not<br />
do that, the real problem of this paper would not be<br />
recognizable anymore because of the abundant<br />
formulas. So, lets try to keep things simple.<br />
The secondary winding of the output transformer is<br />
loaded by a speaker Z s . I know that Z s is strongly<br />
frequency dependant, but for this study it is good<br />
enough to consi<strong>der</strong> Z s to be a constant.<br />
Also we can neglect the magnet wire resistances of<br />
the primary and secondary windings, because they<br />
represent constant losses, while I am researching<br />
variable losses caused by the core only. Let N p /N s<br />
be the turns ratio of the transformer. Then we can<br />
bring Z s to the primary side of the transformer by<br />
means of Z aa = Z s ⋅(N p /N s ) 2 .<br />
Figure 1 shows that for low frequencies below 1<br />
kHz the complete arrangement works as a voltage<br />
source driving the speaker AND the primary<br />
inductance L p of the primary winding. The current<br />
that flows through L p is called the exciting current<br />
I ex = v Lp /(2⋅π⋅f⋅L p ) and we wish that current to be<br />
as small as possible in or<strong>der</strong> to convert all audio<br />
music energy only to the loudspeaker. This means<br />
that L p should be as large as possible.<br />
The frequency and signal level dependant part of<br />
the transfer from the primary tubes to the<br />
loudspeaker is given by formula 1.<br />
s.Lp<br />
H(f) =<br />
r<br />
i<br />
// Z aa + s.Lp<br />
(1)<br />
The inductance of the primary winding is given by<br />
formula 2, where μ o is the magnetic permeability<br />
of vacuum; μ r is the relative magnetic permeability<br />
of the iron of the transformer core; N p is the total<br />
number of turns of the primary winding; l c is the<br />
magnetic path length inside the core; A is the cross<br />
sectional surface of the core; l g is the width of the<br />
gap. See for more information figure 3.<br />
μ .<br />
2<br />
N .<br />
0 p A<br />
L p ( 2)<br />
l c<br />
l g<br />
μ r<br />
The problem I studied results from the fact that the<br />
relative magnetic permeability of the core iron is<br />
not a constant, but depends strongly on the<br />
magnetic flux density inside the core, and thus<br />
from the level of the alternating voltage that the<br />
valves send to the transformer.<br />
AES 130th <strong>Convention</strong>, London, UK, 2011 May 13–16<br />
Page 2 of 8
<strong>Menno</strong> <strong>van</strong> <strong>der</strong> <strong>Veen</strong><br />
Signal weakening in audio transformers<br />
B<br />
V . aa<br />
2<br />
. . f. N p<br />
A<br />
2 π<br />
( )<br />
. 3<br />
figure 3: schematics of the transformer core<br />
indicating l c and A and the eventually present core<br />
gap l g .<br />
Figure 4 shows my measurements [8] on two sorts<br />
of core iron often used, and there it is clearly<br />
shown that the relative permeability is not<br />
constant. Consequently the primary inductance L p<br />
certainly is not constant and therefore the signal<br />
transfer through the transformer is not constant.<br />
Now I can formulate the problem. At normal<br />
voltage levels, say at 1 Watt power to the<br />
loudspeaker, the flux density B is rather large.<br />
Then the relative perm is large enough to make L p<br />
large and the exiting current I ex becomes<br />
negligible, no extra weakening occurs. However, at<br />
small signal levels, meaning small B-values, the<br />
relative perm becomes very small and<br />
consequently also the primary inductance L p . Then<br />
almost all of the current will go through the almost<br />
shortcutting L p and not through Z aa , which<br />
represents the actual loudspeaker. An extra<br />
weakening will occur. We do not only meet this<br />
effect at micro signal level, but also in the region<br />
close to core saturation, at maximum output power<br />
at low frequencies. There also the relative<br />
permeability collapses.<br />
My earlier paper [8] discusses all of this in detail,<br />
and combines it with the threshold of hearing, as<br />
shown in figure 5.<br />
figure 4: Measurements of μ r from 10 -8 to 10 -1 T;<br />
extrapolation below 10 -8 T.<br />
The maximum error below 10 -3 T is 20 %.<br />
The conversion of the driving voltage V aa (rms<br />
value) over the primary winding to the magnetic<br />
flux density B (amplitude) inside the core is given<br />
by formula 3.<br />
figure 5: ISO-curves of human ears<br />
This model results in graphs which show which<br />
signals fall un<strong>der</strong> the threshold of hearing caused<br />
by the permeability collapse inside the core at<br />
small signal levels. Figure 6 gives one example.<br />
AES 130th <strong>Convention</strong>, London, UK, 2011 May 13–16<br />
Page 3 of 8
<strong>Menno</strong> <strong>van</strong> <strong>der</strong> <strong>Veen</strong><br />
Signal weakening in audio transformers<br />
2.1. THE SOUNDCARD<br />
figure 6: Deviation of linear transfer through OPT<br />
at threshold, for Z aa = 4 kΩ, r i = 30 kΩ, η = 90<br />
dB/W,m, d = 1 m, GOSS.<br />
The fine result of this model is that it delivers very<br />
good agreement between theory and subjective<br />
observations, as explained in [8] .<br />
The model is recently precisely measured on<br />
several valve amplifiers in my lab and during the<br />
European Triode Festival 2010. Results are given<br />
and they show that the model and its description<br />
are correct.<br />
Following I focus on how this extra weakening can<br />
be prevented by using special core steel, or by<br />
adapting the driving and loading impedances to the<br />
transformers, and/or by changing the shape of the<br />
transformer core. Also the influence of negative<br />
feedback is discussed. Design rules are given.<br />
2. HOW TO MEASURE DEVIATIONS<br />
Because the deviations described occur at very<br />
small (or very large) signal levels and at specific<br />
frequencies, a special measurement method had to<br />
be developed. The voltage levels can be in the nV<br />
range and consequently hum and noise will be the<br />
big enemies that make the measurement difficult.<br />
In the section following I describe my<br />
measurement setup.<br />
Nowadays we can use a good quality soundcard of<br />
a computer as a measuring device. I used a<br />
Creative Audigy 2 Z5 soundcard, in 96 kHz<br />
sampling mode with 24 bits resolution. The in- and<br />
output sensitivities of this soundcard are calibrated<br />
at 1 V rms for 0 dB FS (0 dB full scale). In front of the<br />
input is placed a calibrated attenuator-amplifier<br />
with an input impedance of 100 kOhm.<br />
Detailed measurements showed that the quality<br />
(noise-floor) of the in- and output amplifiers plus<br />
low-pass filters inside the soundcard restrict the<br />
measurement range from 0 to -120 dB FS .<br />
In the frequency domain the output amplifier of the<br />
soundcard (headphone output) with its low pass<br />
filter has a restricted linear (+/- .1 dB) frequency<br />
range up to 22 kHz. So, from a few Hz to 22 kHz,<br />
the measurements are reliable in the frequency<br />
domain.<br />
The THD of the complete soundcard, its output<br />
connected to its input, is 0.003 % at 1 kHz.<br />
2.2. THE MEASUREMENT PROGRAM<br />
To fully employ the goodies of this system, we<br />
need a reliable program to drive the computer. See<br />
[10] for the details of the Arta/Steps/Imp programs<br />
that I used, designed by Ivo Mateljan. His<br />
programs are of excellent quality, noticeable<br />
written by a scientist, very clear and with no nasty<br />
bugs, with detailed information about the math that<br />
is used to perform the measurements plus clear<br />
indications of the setup of the measurements to<br />
stay within the assumptions of the math applied.<br />
2.3. THE MEASUREMENT SET-UP<br />
In the program "Steps" the linearity function<br />
measurement is selected. There the input signal to<br />
the device un<strong>der</strong> test is compared to the output<br />
signal of the DUT. The vertical axis of the<br />
resulting graph gives the amplification of the DUT<br />
(in dBV/V) as function of the input voltage<br />
(horizontal axis). In steps the input voltage changes<br />
from small to large, its range can be selected. Per<br />
measurement a frequency can be set.<br />
AES 130th <strong>Convention</strong>, London, UK, 2011 May 13–16<br />
Page 4 of 8
<strong>Menno</strong> <strong>van</strong> <strong>der</strong> <strong>Veen</strong><br />
Signal weakening in audio transformers<br />
The measurement is a "heterodyned measurement<br />
of sine response" where a very narrow filter is<br />
created around the selected frequency with a 1/T<br />
bandwidth. T is the integration time of the<br />
measurement. In my case I selected T = 200 ms,<br />
resulting in a 5 Hz bandwidth.<br />
The DUT is a complete valve amplifier with output<br />
transformer, and it will be shown following that<br />
this measurement focuses on the OPT behavior.<br />
The amplifier is secondary loaded with a dummy<br />
load Zs. The two channel character, left and right<br />
input channels are both used, of the measurement<br />
eliminates deviations inside the soundcard. Figure<br />
7 shows the complete measurement set-up.<br />
except from overdrive or shifting of bias settings<br />
inside the valve amplifier. The test frequency of 70<br />
Hz: earlier studies [8] have shown that there the<br />
subjective most noticeable effect will occur. With<br />
the integration time applied (T = 200 ms) the<br />
heterodyne filter is narrow enough to exclude 50<br />
Hz mains hum. The test at 20 Hz probably will<br />
show strong core collapse at micro and macro<br />
signal level. To tease the core the hardest I also<br />
tested at 10 Hz.<br />
In the measurement set-up the frequency range of<br />
the amp is measured as well. However, if the<br />
outcome of the measurement is a straight<br />
horizontal line, there is no core influence. Then<br />
only a constant, signal level independent,<br />
weakening is shown, caused by the coupling<br />
capacitors. If the outcome is sloped or curved, then<br />
the core collapse is the cause.<br />
3. MEASUREMENT RESULTS<br />
The results shown are only frequency and signal<br />
level dependant deviations from a constant<br />
transfer. The "threshold of hearing" curves are<br />
NOT applied. I research here what goes wrong<br />
inside the transformers and NOT what we can hear<br />
of it, because that part already is discussed in [8] .<br />
In my lab I tested about ten different amps, and at<br />
the ETF2010 I tested fifteen amps. They all had<br />
totally different schematics and output<br />
transformers. In spite of that, they gave more or<br />
less the same result.<br />
Figure 7: Measurement set-up<br />
2.4. MEASUREMENT CONDITIONS<br />
The math of the set-up demands absence of noise,<br />
and this condition could not fully be met with the<br />
tested valve amps. I therefore restricted the<br />
measurement floor to -80dBV at the input of the<br />
amps tested. I tested the transfer of the amps at<br />
frequencies of 1 kHz, 70 Hz, 20 Hz and 10 Hz. The<br />
test frequency of 1 kHz: because no problems are<br />
expected there, a straight line should be the result,<br />
See figure 8 as a clear example which enables me<br />
to explain what happens.<br />
The upper line is the 1 kHz measurement. It is<br />
almost straight, however at larger input/output<br />
voltages the internal bias of the amp changes,<br />
causing loss of amplification (limiting) which is<br />
not caused by the transformer. This situation is<br />
found also in the 70 and 20 Hz measurements.<br />
The second line is at 70 Hz and shows a tendency<br />
of weakening at lower input voltages. The line is<br />
sloped, so, the cause is in the transformer.<br />
AES 130th <strong>Convention</strong>, London, UK, 2011 May 13–16<br />
Page 5 of 8
<strong>Menno</strong> <strong>van</strong> <strong>der</strong> <strong>Veen</strong><br />
Signal weakening in audio transformers<br />
The third line measures at 20 Hz and shows more<br />
clearly the loss of amplification caused by the<br />
perm behavior in the core.<br />
Notice that these three lines all have the same<br />
maximum, indicating a constant amplification (no<br />
influence of coupling capacitors) from 20 Hz to 1<br />
kHz.<br />
The fourth bottom line is measured at 10 Hz,<br />
clearly indicating perm collapse at low input levels<br />
and core saturation at high input levels, because<br />
the sloping down of the curve has shifted to the<br />
left.<br />
Noise residuals are visible below an input voltage<br />
of -80 dBV in the 20 and 10 Hz measurements,<br />
showing the reason why I had to limit the input<br />
voltage range for a reliable result.<br />
Combining formulas 1 to 3 with the perm<br />
measurements of figure 4 completely describes the<br />
behavior as shown in figure 8. The model<br />
presented in [8] and here is correct and its effects<br />
are noticeable in practical valve amplifiers.<br />
The 1 kHz line is straight with a small bulb at the<br />
right side because of overdrive of the tube<br />
circuitry. The 70 Hz line is little sloped, caused by<br />
perm-loss as discussed here. The 20 Hz line is<br />
further sloped and at the right side the transformer<br />
is just driven into saturation. The 10 Hz line shows<br />
this effect more pronounced.<br />
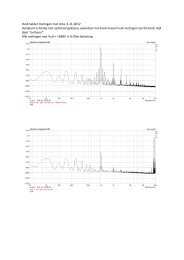
figure 9: example-2 of core collapse.<br />
From top to bottom: 1 kHz, 70 Hz, 20 Hz, 10 Hz.<br />
Amplifier "UL40-S2" [11] with Ultra Linear<br />
negative feedback<br />
The third example in figure 10 shows a multi<br />
paralleled power tube amplifier with very small<br />
effective plate resistance r i of the combined power<br />
tubes, resulting in little deviation of linearity. In<br />
this amplifier no auto-bias module was installed,<br />
bias shifting occurs on the right side. Only at 10<br />
Hz a little deviation of linearity is noticed plus core<br />
saturating at maximum output power.<br />
figure 8: example of core collapse.<br />
From top to bottom: 1 kHz, 70 Hz, 20 Hz, 10 Hz.<br />
Amplifier "GERT-RL12"; no internal negative<br />
feedback.<br />
The next example (figure 9) is an ultra linear<br />
negative feedback amplifier and internal<br />
electronics (auto-bias module, see [11] ) prevents<br />
bias shifting inside the amplifier, making more<br />
clear what happens inside the output transformer.<br />
The fourth and last example (see figure 11) is an<br />
amplifier with 13 dB overall negative feedback,<br />
[6],[7],[11]<br />
combined with local Super Triode<br />
feedback . Bias-shifting is prevented with an autobias<br />
module. It is clearly visible that the feedback<br />
has "cured" the deviations of linearity, and only for<br />
10 Hz the transformer core saturation is visible.<br />
AES 130th <strong>Convention</strong>, London, UK, 2011 May 13–16<br />
Page 6 of 8
<strong>Menno</strong> <strong>van</strong> <strong>der</strong> <strong>Veen</strong><br />
Signal weakening in audio transformers<br />
4.1. USE r i AND NEGATIVE FEEDBACK<br />
figure 10: example-3 of core collapse.<br />
From top to bottom: 1 kHz, 70 Hz, 20 Hz, 10 Hz.<br />
Amplifier "Centiare Tentlabs"with<br />
multi paralleled power tubes<br />
Formula 1 clearly explains this method. When<br />
r i //Z aa is negligible compared to s.L p in the<br />
frequency range and signal levels of interest, then<br />
the frequency dependant part of the actual transfer<br />
is unity.<br />
Lowering r i can be done inside the power valves:<br />
use triodes instead of pentodes. Or use local<br />
feedback around the power valves and the output<br />
transformer, like ultra linear screen grid feedback,<br />
or cathode feedback or super triode feedback. See<br />
[11] for abundant examples of such methods.<br />
Feedback in general, being local or overall, lowers<br />
r i by a factor of (1+β⋅A 0 ) -1 where β is the feedback<br />
factor and A 0 is the open loop amplification<br />
without feedback. So, feedback cures this nasty<br />
effect, or at least can bring it below the threshold<br />
of hearing.<br />
4.2. SOLVE INSIDE THE TRANSFORMER<br />
Figure 11: example-4 of core collapse.<br />
From top to bottom: 1 kHz, 70 Hz, 20 Hz, 10 Hz.<br />
Amplifier "SPT-70"; see [7] chapter 8<br />
The examples given clearly show that the amount<br />
of feedback inside the amplifier influences the<br />
results measured. In the next section this positive<br />
effect will be further discussed.<br />
4. HOW TO PREVENT LOSSES<br />
There are several methods to prevent extra<br />
weakening and they will be discussed following.<br />
The core steel is the main cause of the weakening<br />
[8] . To prevent this from happening, apply high<br />
permeability steels like Metglas, HD-105-30,<br />
VM111, Isoperm, Amorphous steel and so on. Use<br />
correctly annealed steels because good annealing<br />
makes the perm larger. Also, if possible, do not<br />
vacuum impregnate the core while impregnation<br />
lowers the perm.<br />
Another solution is to apply a gap in the core with<br />
l g > l c /μ r in the range of interest. Then L p will<br />
become smaller, but almost insensitive to the<br />
frequency and signal level of the applied voltages.<br />
The shape of the transformer is important as well.<br />
Let a transformer have a cross sectional surface A,<br />
as is needed for the maximum power to be<br />
transferred, see formula 3. The EI-shape cores<br />
have the smallest l c compared to C-core or toroidal<br />
or R-core. meaning that in EI-cores L p will be the<br />
largest, see formula 2.<br />
In or<strong>der</strong> to prevent core collapse at high signal<br />
levels, one might consi<strong>der</strong> to design the<br />
transformer at 0.5 ⋅ B max at full power at the lowest<br />
frequency to be transferred. This has the extra<br />
ad<strong>van</strong>tage that by short duration full power low<br />
frequency burst signals, the flux density in the core<br />
AES 130th <strong>Convention</strong>, London, UK, 2011 May 13–16<br />
Page 7 of 8
<strong>Menno</strong> <strong>van</strong> <strong>der</strong> <strong>Veen</strong><br />
Signal weakening in audio transformers<br />
will be just at B max timely, preventing nasty<br />
distortion un<strong>der</strong> this condition.<br />
4.3. Designing transformers<br />
I can't help feeling the need to express that<br />
designing transformers is an art. If you cure here,<br />
you damage there. For instance, using Metglas<br />
cures at low levels, but its overdrive behavior is<br />
sharp nasty sounding limiting. Designing for 0.5 ⋅<br />
B max makes the transformers heavy and more<br />
expensive. Applying gaps costs money as well.<br />
And what to say about the frequency range I did<br />
not discuss here: environment of 20 kHz and<br />
larger. There leakage and internal capacitances<br />
play a leading role and then toroidal is the most<br />
favorable shape, see [1],[6] .<br />
It is not the aim of this paper to discuss all. When<br />
only focusing on the 20 Hz to 1 kHz frequency<br />
range, then the perm behavior is dominant. But the<br />
transformer designer has to consi<strong>der</strong> at least the<br />
range from 20 Hz to 20 kHz and therefore shall<br />
have to find a balance between all the goodies and<br />
baddies of the different solutions. Fortunately, the<br />
customer, who buys a transformer, can cure the<br />
effect discussed by applying special valves or any<br />
kind of feedback.<br />
5. CONCLUSIONS<br />
In earlier work a model was created that describes<br />
the effect of magnetic permeability collapse at very<br />
low and very high flux density levels inside a<br />
transformer core. It was calculated that this<br />
collapse is subjectively noticeable as an extra<br />
weakening in the frequency range of 20 Hz to 1<br />
kHz, taking the threshold of hearing and the<br />
sensitivity of the loudspeakers into account. In this<br />
paper a method is given how to measure this perm<br />
effect in existing valve amplifiers. Measurement<br />
and theoretical model show total agreement. Two<br />
methods are formulated to prevent the extra<br />
weakening: apply low plate resistance valves or<br />
use feedback, which has the same effect. The<br />
second method focuses on high perm steel<br />
selection and the core shape of the transformer and<br />
the linearising effect of a core gap. It is noted that<br />
the cure of weakening in the 20 Hz to 1 kHz<br />
frequency range might cause problems elsewhere<br />
in the frequency range of the transformer. In<br />
summary: perm collapse has influence on the<br />
transfer, it can be cured inside or outside the<br />
transformer, but be warned: "curing here might<br />
damage elsewhere".<br />
6. REFERENCES<br />
[1]: <strong>Menno</strong> <strong>van</strong> <strong>der</strong> <strong>Veen</strong>; "Theory and Practice<br />
of Wide Bandwidth Toroidal Output<br />
Transformers"; 97th AES-<strong>Convention</strong> 1994; San<br />
Francisco, preprint 3887.<br />
[2]: <strong>Menno</strong> <strong>van</strong> <strong>der</strong> <strong>Veen</strong>; "Modeling Power<br />
Tubes and their Interaction with Output<br />
Transformers"; 104th AES convention,<br />
Amsterdam, 1998; preprint 4643.<br />
[3]: Pierre Touzelet & <strong>Menno</strong> <strong>van</strong> <strong>der</strong> <strong>Veen</strong>;<br />
"Small signal analysis for generalized push-pull<br />
amplifier topology"; 112th AES convention, 2002<br />
Munich, paper 5587.<br />
[4]: <strong>Menno</strong> <strong>van</strong> <strong>der</strong> <strong>Veen</strong> & Pierre Touzelet;<br />
“New Vacuum Tube and Output Transformer<br />
Models applied to the Quad II valve amplifier";<br />
114th AES convention, 2003 Amsterdam, paper<br />
5748.<br />
[5]: <strong>Menno</strong> <strong>van</strong> <strong>der</strong> <strong>Veen</strong>; “Universal System and<br />
Output Transformer for Valve Amplifiers”; 118th<br />
AES convention, 2005 Barcelona; paper 6347.<br />
[6]: <strong>Menno</strong> <strong>van</strong> <strong>der</strong> <strong>Veen</strong>; "Mo<strong>der</strong>n High-end<br />
Valve Amplifiers based on toroidal output<br />
transformers"; ISBN 0-905705-63-7,<br />
www.elektor.com<br />
[7]: <strong>Menno</strong> <strong>van</strong> <strong>der</strong> <strong>Veen</strong>; "High-end Valve<br />
Amplifiers 2"; ISBN 978-0-905705-90-3,<br />
www.elektor.com<br />
[8]: <strong>Menno</strong> <strong>van</strong> <strong>der</strong> <strong>Veen</strong>; "Low level audio<br />
signal transfer through transformers conflicts with<br />
permeability behavior inside their cores"; <strong>Paper</strong><br />
7125, 122nd AES-convention, 2007 May 5-8,<br />
Vienna Austria.<br />
[9]: <strong>Menno</strong> <strong>van</strong> <strong>der</strong> <strong>Veen</strong> & Hans <strong>van</strong> Maanen;<br />
"Non-linear Distortions in Capacitors"; 124th AES<br />
convention, 2008 Amsterdam, paper 7500.<br />
[10]: Ivo Mateljan; "Arta/Steps/Imp";<br />
www.fesb.hr/~mateljan/arta<br />
[11]: www.menno<strong>van</strong><strong>der</strong>veen.nl<br />
AES 130th <strong>Convention</strong>, London, UK, 2011 May 13–16<br />
Page 8 of 8