Economic impact assessment of the CCPMO: Final report - CIPD
Economic impact assessment of the CCPMO: Final report - CIPD
Economic impact assessment of the CCPMO: Final report - CIPD

You also want an ePaper? Increase the reach of your titles
YUMPU automatically turns print PDFs into web optimized ePapers that Google loves.
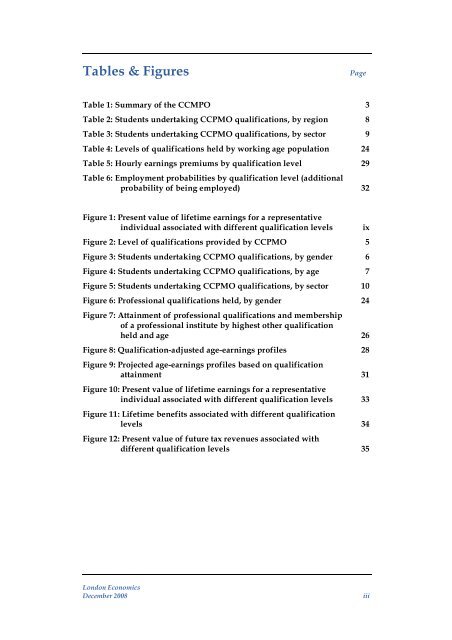
Tables & Figures<br />
Page<br />
Table 1: Summary <strong>of</strong> <strong>the</strong> CCMPO<br />
Table 2: Students undertaking <strong>CCPMO</strong> qualifications, by region<br />
Table 3: Students undertaking <strong>CCPMO</strong> qualifications, by sector<br />
Table 4: Levels <strong>of</strong> qualifications held by working age population<br />
Table 5: Hourly earnings premiums by qualification level<br />
Table 6: Employment probabilities by qualification level (additional <br />
probability <strong>of</strong> being employed)<br />
3<br />
8<br />
9<br />
24<br />
29<br />
32<br />
Figure 1: Present value <strong>of</strong> lifetime earnings for a representative<br />
individual associated with different qualification levels<br />
Figure 2: Level <strong>of</strong> qualifications provided by <strong>CCPMO</strong><br />
Figure 3: Students undertaking <strong>CCPMO</strong> qualifications, by gender<br />
Figure 4: Students undertaking <strong>CCPMO</strong> qualifications, by age<br />
Figure 5: Students undertaking <strong>CCPMO</strong> qualifications, by sector<br />
Figure 6: Pr<strong>of</strong>essional qualifications held, by gender<br />
Figure 7: Attainment <strong>of</strong> pr<strong>of</strong>essional qualifications and membership<br />
<strong>of</strong> a pr<strong>of</strong>essional institute by highest o<strong>the</strong>r qualification<br />
held and age<br />
Figure 8: Qualification-adjusted age-earnings pr<strong>of</strong>iles<br />
Figure 9: Projected age-earnings pr<strong>of</strong>iles based on qualification<br />
attainment<br />
Figure 10: Present value <strong>of</strong> lifetime earnings for a representative<br />
individual associated with different qualification levels<br />
Figure 11: Lifetime benefits associated with different qualification<br />
levels<br />
Figure 12: Present value <strong>of</strong> future tax revenues associated with<br />
different qualification levels<br />
ix<br />
5<br />
6<br />
7<br />
10<br />
24<br />
26<br />
28<br />
31<br />
33<br />
34<br />
35<br />
London <strong>Economic</strong>s<br />
December 2008<br />
iii