Cardiovascular morbidity and mortality in the Losartan - ResearchGate
Cardiovascular morbidity and mortality in the Losartan - ResearchGate
Cardiovascular morbidity and mortality in the Losartan - ResearchGate

Create successful ePaper yourself
Turn your PDF publications into a flip-book with our unique Google optimized e-Paper software.
ARTICLES<br />
<strong>Losartan</strong> Atenolol<br />
Drug doses<br />
50 mg only 434 (9%) 436 (10%)<br />
50 mg plus additional drugs* 844 (18%) 930 (20%)<br />
100 mg with or without 2284 (50%) 1979 (43%)<br />
additional drugs*<br />
Alone 95 (2%) 78 (2%)<br />
With HCTZ only 829 (18%) 713 (16%)<br />
With o<strong>the</strong>r drugs only 162 (4%) 172 (4%)<br />
With HCTZ <strong>and</strong> o<strong>the</strong>r drugs 1198 (26%) 1016 (22%)<br />
Off study drugs 1043 (23%) 1243 (27%)<br />
*Includ<strong>in</strong>g hydrochlorothiazide (HCTZ).<br />
Table 2: Number of participants on study drug at endpo<strong>in</strong>t or<br />
end of follow-up<br />
patients from <strong>the</strong> time of r<strong>and</strong>omisation to <strong>the</strong> end of <strong>the</strong><br />
study, or to <strong>the</strong> po<strong>in</strong>t at which <strong>the</strong> study drug was<br />
permanently stopped, whichever came first.<br />
The difference between treatment groups with respect to<br />
cl<strong>in</strong>ical events was assessed by a Cox regression model<br />
with degree of LVH (measured as a cont<strong>in</strong>uous variable)<br />
<strong>and</strong> <strong>the</strong> Fram<strong>in</strong>gham risk score 23 def<strong>in</strong>ed by basel<strong>in</strong>e<br />
characteristics as covariates. We chose this adjusted<br />
analysis before <strong>the</strong> start of <strong>the</strong> study to account for basel<strong>in</strong>e<br />
differences <strong>in</strong> risk predictors. We did a secondary<br />
unadjusted analysis to validate <strong>the</strong> adjusted results.<br />
Treatment effects were measured by hazard ratios (relative<br />
risks) <strong>and</strong> 95% CIs by Cox regression models. The risk<br />
reduction for losartan aga<strong>in</strong>st atenolol was calculated as<br />
100(1–relative risk). Event rates over time are presented<br />
as Kaplan-Meier curves. Adjustment for blood pressure<br />
was derived from Cox regression models with blood<br />
pressures throughout <strong>the</strong> trial as time-vary<strong>in</strong>g covariates.<br />
Results of <strong>the</strong> primary endpo<strong>in</strong>t analysis were<br />
<strong>in</strong>dependently validated by <strong>the</strong> steer<strong>in</strong>g committee<br />
statistician. Differences between groups <strong>in</strong> changes <strong>in</strong><br />
ECG measures of LVH were analysed with <strong>the</strong> Wilcoxon<br />
rank-sum test, <strong>and</strong> <strong>the</strong> frequency of adverse experiences<br />
with Fisher’s exact test.<br />
The <strong>in</strong>dependent data <strong>and</strong> safety board monitored <strong>the</strong><br />
<strong>in</strong>terim results of <strong>the</strong> trial. To adjust for two <strong>in</strong>terim<br />
efficacy analyses (after one of three <strong>and</strong> two of three<br />
primary events), <strong>the</strong> f<strong>in</strong>al analysis of <strong>the</strong> primary endpo<strong>in</strong>t<br />
variable was tested at a two-sided 4·6% significance level.<br />
All o<strong>the</strong>r tests were done at two-sided 5% significance<br />
levels.<br />
Role of <strong>the</strong> fund<strong>in</strong>g source<br />
Study data are <strong>in</strong> a Merck database. Merck provided <strong>the</strong><br />
study steer<strong>in</strong>g committee with free access to all data. The<br />
steer<strong>in</strong>g committee was free to <strong>in</strong>terpret data <strong>and</strong> write <strong>the</strong><br />
paper <strong>and</strong> <strong>the</strong> outcome was validated <strong>in</strong>dependently by <strong>the</strong><br />
steer<strong>in</strong>g committee statistician.<br />
mm Hg<br />
180<br />
170<br />
160<br />
150<br />
140<br />
130<br />
120<br />
110<br />
100<br />
90<br />
80<br />
70<br />
60<br />
50<br />
40<br />
Atenolol<br />
<strong>Losartan</strong><br />
Systolic<br />
Mean arterial<br />
Diastolic<br />
0 6 12 18 24 30 36 42 48 54<br />
Time (months)<br />
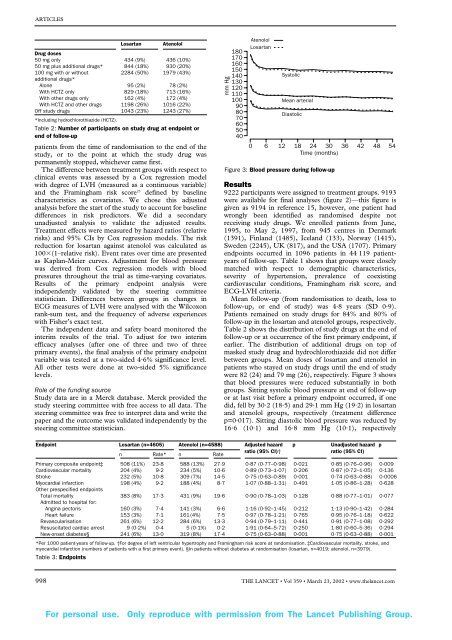
Figure 3: Blood pressure dur<strong>in</strong>g follow-up<br />
Results<br />
9222 participants were assigned to treatment groups. 9193<br />
were available for f<strong>in</strong>al analyses (figure 2)—this figure is<br />
given as 9194 <strong>in</strong> reference 15, however, one patient had<br />
wrongly been identified as r<strong>and</strong>omised despite not<br />
receiv<strong>in</strong>g study drugs. We enrolled patients from June,<br />
1995, to May 2, 1997, from 945 centres <strong>in</strong> Denmark<br />
(1391), F<strong>in</strong>l<strong>and</strong> (1485), Icel<strong>and</strong> (133), Norway (1415),<br />
Sweden (2245), UK (817), <strong>and</strong> <strong>the</strong> USA (1707). Primary<br />
endpo<strong>in</strong>ts occurred <strong>in</strong> 1096 patients <strong>in</strong> 44 119 patientyears<br />
of follow-up. Table 1 shows that groups were closely<br />
matched with respect to demographic characteristics,<br />
severity of hypertension, prevalence of coexist<strong>in</strong>g<br />
cardiovascular conditions, Fram<strong>in</strong>gham risk score, <strong>and</strong><br />
ECG-LVH criteria.<br />
Mean follow-up (from r<strong>and</strong>omisation to death, loss to<br />
follow-up, or end of study) was 4·8 years (SD 0·9).<br />
Patients rema<strong>in</strong>ed on study drugs for 84% <strong>and</strong> 80% of<br />
follow-up <strong>in</strong> <strong>the</strong> losartan <strong>and</strong> atenolol groups, respectively.<br />
Table 2 shows <strong>the</strong> distribution of study drugs at <strong>the</strong> end of<br />
follow-up or at occurrence of <strong>the</strong> first primary endpo<strong>in</strong>t, if<br />
earlier. The distribution of additional drugs on top of<br />
masked study drug <strong>and</strong> hydrochlorothiazide did not differ<br />
between groups. Mean doses of losartan <strong>and</strong> atenolol <strong>in</strong><br />
patients who stayed on study drugs until <strong>the</strong> end of study<br />
were 82 (24) <strong>and</strong> 79 mg (26), respectively. Figure 3 shows<br />
that blood pressures were reduced substantially <strong>in</strong> both<br />
groups. Sitt<strong>in</strong>g systolic blood pressure at end of follow-up<br />
or at last visit before a primary endpo<strong>in</strong>t occurred, if one<br />
did, fell by 30·2 (18·5) <strong>and</strong> 29·1 mm Hg (19·2) <strong>in</strong> losartan<br />
<strong>and</strong> atenolol groups, respectively (treatment difference<br />
p=0·017). Sitt<strong>in</strong>g diastolic blood pressure was reduced by<br />
16·6 (10·1) <strong>and</strong> 16·8 mm Hg (10·1), respectively<br />
Endpo<strong>in</strong>t <strong>Losartan</strong> (n=4605) Atenolol (n=4588) Adjusted hazard p Unadjusted hazard p<br />
n Rate* n Rate<br />
ratio (95% CI)†<br />
ratio (95% CI)<br />
Primary composite endpo<strong>in</strong>t‡ 508 (11%) 23·8 588 (13%) 27·9 0·87 (0·77–0·98) 0·021 0·85 (0·76–0·96) 0·009<br />
<strong>Cardiovascular</strong> <strong>mortality</strong> 204 (4%) 9·2 234 (5%) 10·6 0·89 (0·73–1·07) 0·206 0·87 (0·72–1·05) 0·136<br />
Stroke 232 (5%) 10·8 309 (7%) 14·5 0·75 (0·63–0·89) 0·001 0·74 (0·63–0·88) 0·0006<br />
Myocardial <strong>in</strong>farction 198 (4%) 9·2 188 (4%) 8·7 1·07 (0·88–1·31) 0·491 1·05 (0·86–1·28) 0·628<br />
O<strong>the</strong>r prespecified endpo<strong>in</strong>ts<br />
Total <strong>mortality</strong> 383 (8%) 17·3 431 (9%) 19·6 0·90 (0·78–1·03) 0·128 0·88 (0·77–1·01) 0·077<br />
Admitted to hospital for:<br />
Ang<strong>in</strong>a pectoris 160 (3%) 7·4 141 (3%) 6·6 1·16 (0·92–1·45) 0·212 1·13 (0·90–1·42) 0·284<br />
Heart failure 153 (3%) 7·1 161 (4%) 7·5 0·97 (0·78–1·21) 0·765 0·95 (0·76–1·18) 0·622<br />
Revascularisation 261 (6%) 12·2 284 (6%) 13·3 0·94 (0·79–1·11) 0·441 0·91 (0·77–1·08) 0·292<br />
Resuscitated cardiac arrest 9 (0·2%) 0·4 5 (0·1%) 0·2 1·91 (0·64–5·72) 0·250 1·80 (0·60–5·36) 0·294<br />
New-onset diabetes§ 241 (6%) 13·0 319 (8%) 17·4 0·75 (0·63–0·88) 0·001 0·75 (0·63–0·88) 0·001<br />
*Per 1000 patient-years of follow-up. †For degree of left ventricular hypertrophy <strong>and</strong> Fram<strong>in</strong>gham risk score at r<strong>and</strong>omisation. ‡<strong>Cardiovascular</strong> <strong>mortality</strong>, stroke, <strong>and</strong><br />
myocardial <strong>in</strong>farction (numbers of patients with a first primary event). §In patients without diabetes at r<strong>and</strong>omisation (losartan, n=4019; atenolol, n=3979).<br />
Table 3: Endpo<strong>in</strong>ts<br />
998 THE LANCET • Vol 359 • March 23, 2002 • www.<strong>the</strong>lancet.com<br />
For personal use. Only reproduce with permission from The Lancet Publish<strong>in</strong>g Group.