Report of the Second Piloted Aircraft Flight Control System - Acgsc.org
Report of the Second Piloted Aircraft Flight Control System - Acgsc.org
Report of the Second Piloted Aircraft Flight Control System - Acgsc.org
You also want an ePaper? Increase the reach of your titles
YUMPU automatically turns print PDFs into web optimized ePapers that Google loves.
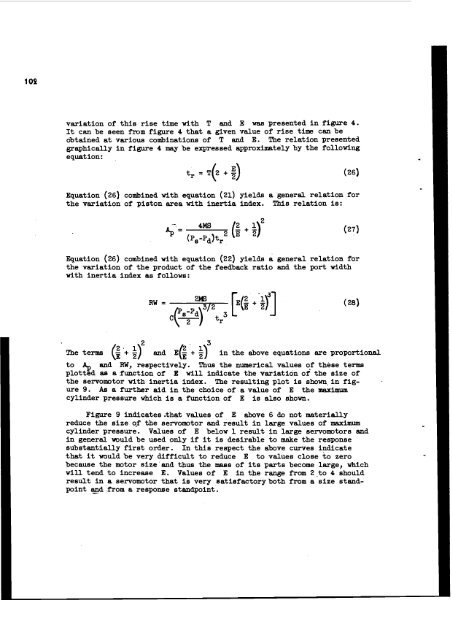
variation <strong>of</strong> this rise time with T and E was presented in figure 4.<br />
It can be seen fmm figure 4 that a given value <strong>of</strong> rise time can be<br />
obtained at various combinations <strong>of</strong> T and E. The relation presented<br />
graphically in figure 4 may be exptessed approximately by <strong>the</strong> following<br />
equation :<br />
Equation (26) combined with equation (21) yields a general relation for<br />
<strong>the</strong> variation <strong>of</strong> piston area with inertia index. This relation is:<br />
Equation (26) combined with equation (22) yields a general relation for<br />
<strong>the</strong> variation <strong>of</strong> <strong>the</strong> product <strong>of</strong> <strong>the</strong> feedback ratio and <strong>the</strong> port width<br />
with inertia index as follows:<br />
2 3<br />
The terms (i + $1 and BG +<br />
in <strong>the</strong> above equations are proportional<br />
to Ap and FW, respectively. Thus <strong>the</strong> numerical values <strong>of</strong> <strong>the</strong>se terms<br />
plotted as a function <strong>of</strong> E will indicate <strong>the</strong> variation <strong>of</strong> <strong>the</strong> size <strong>of</strong><br />
<strong>the</strong> servomotor with inertia index. The resulting plot is showq in figure<br />
9. Ae a fur<strong>the</strong>r aid in <strong>the</strong> choice <strong>of</strong> a value <strong>of</strong> E <strong>the</strong> maximum<br />
cylinder pressure which is a function <strong>of</strong> E is also shown.<br />
Figure 9 indicates .that values <strong>of</strong> E above 6 do not materially<br />
reduce <strong>the</strong> size oaf <strong>the</strong> servomotor and result in large values <strong>of</strong> msximum<br />
cylinder pressure. Values <strong>of</strong> E below 1 result in large servomotors and<br />
in general would be used only if it is desirable to make <strong>the</strong> response<br />
substantially first order. In this respect <strong>the</strong> above curves indicate<br />
that it would be very difficult to reduce E to values close to zero<br />
because <strong>the</strong> motor size and thus <strong>the</strong> mass <strong>of</strong> its parts become large, which<br />
will tend to increase E. Values <strong>of</strong> E in <strong>the</strong> range from 2 .to 4 should<br />
result in a servomotor that is very eatiefactoryboth from a size standpoint<br />
@ , from a response standpoint.


