AVIVA - Keeping Traffic Flowing.indd - MAN Truck & Bus
AVIVA - Keeping Traffic Flowing.indd - MAN Truck & Bus
AVIVA - Keeping Traffic Flowing.indd - MAN Truck & Bus

You also want an ePaper? Increase the reach of your titles
YUMPU automatically turns print PDFs into web optimized ePapers that Google loves.
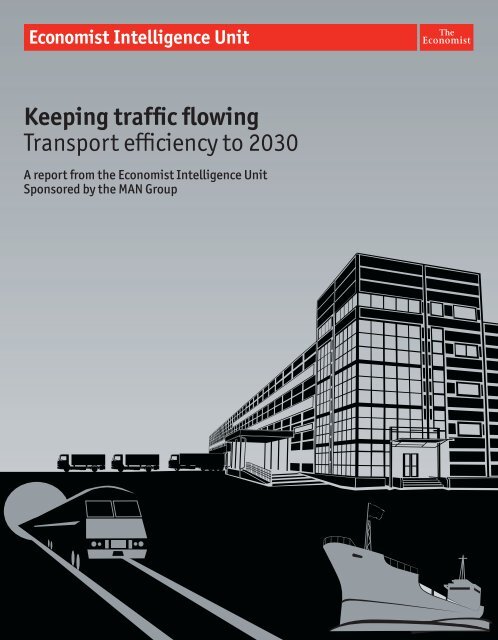
<strong>Keeping</strong> traffic flowing<br />
Transport efficiency to 2030<br />
A report from the Economist Intelligence Unit<br />
Sponsored by the <strong>MAN</strong> Group
<strong>Keeping</strong> traffic flowing<br />
Transport efficiency to 2030<br />
Contents<br />
Foreword 3<br />
About the research 4<br />
Executive summary 6<br />
Section 1: The business perspective 8<br />
Congestion and its costs 8<br />
Sidebar: Navigating the urban jungle 12<br />
Circumventing logjams 12<br />
Sidebar: The corporate logistics function comes to the fore 16<br />
Long-term cost implications 18<br />
Sidebar: A controversial rail hub 21<br />
Section 2: Transport efficiency: A benchmarking exercise across ten countries 22<br />
Conclusion 29<br />
Appendix 1: Survey results 31<br />
Appendix 2: The Transport Efficiency Index: Methodology 43<br />
© The Economist Intelligence Unit Limited 2010
<strong>Keeping</strong> traffic flowing<br />
Transport efficiency to 2030<br />
Foreword<br />
Ensuring sustainable transport over the next two decades is an increasing concern for policymakers,<br />
businesses, passengers, advocacy groups, and many others. Much of the attention is focusing on<br />
relieving the strain on transport infrastructure, which is already severely overloaded in many parts of<br />
the world. The debate centres on ways to finance new infrastructure, while ensuring that existing and<br />
future facilities are used to best effect and with the least possible impact on the environment.<br />
<strong>Keeping</strong> traffic flowing is an Economist Intelligence Unit report that discusses how transport<br />
infrastructure, policies and technology can help to ensure efficient transport on a sustainable basis in<br />
the years to 2030. The research was sponsored by <strong>MAN</strong>. The findings and views expressed in the report<br />
do not necessarily reflect the views of the sponsor. Christopher Watts was the author of the report, and<br />
Aviva Freudmann was the editor.<br />
June 2010<br />
© The Economist Intelligence Unit Limited 2010
<strong>Keeping</strong> traffic flowing<br />
Transport efficiency to 2030<br />
About the research<br />
In December 2009 and January 2010, the Economist Intelligence Unit conducted a benchmarking<br />
study of ten countries to determine their current and likely future transport efficiency. For<br />
purposes of this study, transport efficiency is defined as operating a transport system to maximum<br />
advantage—that is, with the lowest possible costs in time, money, accidents and environmental<br />
impact. This benchmarking study focused on current transport efficiency in the ten countries, as well<br />
as on the likely sustainability of each country’s transport system in 20 years’ time, by considering<br />
current inputs into each country’s system.<br />
The ten countries were selected with a view towards representing a cross-section of developed and<br />
fast-developing economies, each facing significant transport challenges. The countries are Germany,<br />
France, the UK, Spain, Poland, Brazil, Russia, India, China and South Africa. The benchmarking study<br />
is based on data for transport efficiency outputs such as mobility, safety and environmental impact,<br />
as well as efficiency inputs (indicators of long-term transport efficiency) such as infrastructure,<br />
vehicle stock, and transport improvement policies. The result of this part of the study is a<br />
benchmarking index ranking the ten countries in terms of their transport efficiency.<br />
Also in December and January, the Economist Intelligence Unit carried out separate research<br />
to determine the impact of transport conditions on business. For this purpose, the Economist<br />
Intelligence Unit surveyed 220 senior executives, based primarily in North America, Asia-Pacific<br />
and western Europe, on their views concerning the efficiency of transport systems in their countries<br />
and the ability of those systems to meet future demand. More than two-thirds of respondents are<br />
executives at director level or above. Respondents are most likely to have responsibility for general<br />
management, strategy and business development, finance, and supply chain management. Around<br />
57% are from businesses with US$500m or more in global annual revenue, and one-quarter come<br />
from firms with more than US$10bn in annual sales. All major industries are represented, with<br />
manufacturing having the strongest representation.<br />
To supplement the online survey, the Economist Intelligence Unit conducted 18 in-depth<br />
interviews with senior business executives responsible for logistics, and with other experts<br />
on transport and logistics. The insights from these interviews appear throughout the report.<br />
The Economist Intelligence Unit would like to thank all survey respondents, as well as the<br />
<br />
© The Economist Intelligence Unit Limited 2010
<strong>Keeping</strong> traffic flowing<br />
Transport efficiency to 2030<br />
following executives (listed alphabetically by organisation name) who participated in the in-depth<br />
interview programme:<br />
• John van Wyk, CEO, Barloworld Logistics Europe, UK<br />
• Johannes Ludewig, executive director, Community of European Railway and Infrastructure<br />
Companies, Belgium<br />
• Dr Karl Sommer, director, Logistics, BMW, Germany<br />
• Adolfo Majano Romero, managing director, Buchanan Consultores, Spain<br />
• Trevor Ashworth, director, Food Retail Logistics, Co-operative Group, UK<br />
• Simon Babes, general manager, Colin Buchanan, China<br />
• Atholl Noon, director, Transport Planning, Colin Buchanan, UK<br />
• Bjorn Vang Jensen, vice-president, Global Freight and Logistics Services, Electrolux, Singapore<br />
• Danny Feltmann-Espersen, director, Logistics, Hennes & Mauritz, Sweden<br />
• Jack Short, secretary-general, International Transport Forum, Belgium<br />
• Alan Braithwaite, chairman, LCP Consulting, UK<br />
• François Bertreau, CEO, Norbert Dentressangle, France<br />
• Jonathan Kimber, executive vice-president, Global Supply, Oriflame, Sweden<br />
• Andreas Streubig, director, Environmental and Social Policy, Otto Group, Germany<br />
• Peggy Montana, executive vice-president, Supply and Distribution, Shell Oil, US<br />
• Derek Abel, supply chain director, Tesco China, China<br />
• Sharon Bamford, CEO, UK India <strong>Bus</strong>iness Council, UK<br />
• Roland Chong, general manager, Logistics, Yum! Brands, China<br />
© The Economist Intelligence Unit Limited 2010
<strong>Keeping</strong> traffic flowing<br />
Transport efficiency to 2030<br />
Executive summary<br />
Against the backdrop of shifting consumer demand and continuing globalisation, the importance<br />
of free-flowing transport has increased markedly for the global economy. Today, as never before,<br />
policymakers understand that sound transport infrastructure, policies, and technologies, correlate to<br />
competitiveness, productivity and efficiency in the economy. Among other things, this understanding<br />
is reflected in ambitious infrastructure investment plans in developing economies such as Brazil, South<br />
Africa, Poland, China and India, as well as in advanced economies such as Spain and the UK.<br />
While current investment plans are ambitious, they are pitted against large and growing gaps<br />
between transport demand and available capacity. These gaps exist worldwide, from the world’s richest<br />
countries to its poorest. They are particularly acute in developing countries, where already stressed<br />
transport systems are increasingly burdened by rapid population and economic growth, globalisation<br />
and urbanisation. Governments investing heavily in infrastructure trumpet those programmes as the<br />
future solutions to these looming problems. But businesses, which bear the brunt of the costs imposed<br />
by congestion, tend to be less optimistic.<br />
This white paper is based on two distinct streams of research aimed at considering the problem<br />
of congestion from both the macroeconomic and microeconomic angles. The first, taking the<br />
macroeconomic view, consists of a comparative index ranking current and likely future transport<br />
efficiency in ten selected countries. The second, which considers the business impact of congestion,<br />
consists of desk research, an online survey of 220 senior executives and 18 in-depth executive<br />
interviews. This research focuses on how well companies cope with transport blockages and how they<br />
expect future transport improvements will be financed.<br />
The main findings of these two streams of research are highlighted below.<br />
• Current transport conditions are best in France. France leads our benchmarking index in terms of<br />
efficiency “outputs” such as mobility, safety and environmental protection, followed by Germany. Of<br />
the ten countries in the index, the best overall scores went to France for mobility (9.4 out of 10) and<br />
safety (9.9), reflecting France’s investment in high-speed rail transport and its relatively low traffic<br />
volume per kilometre of road.<br />
• Indicators of future transport efficiency are best in Germany. Despite clogged roads today, Germany<br />
<br />
© The Economist Intelligence Unit Limited 2010
<strong>Keeping</strong> traffic flowing<br />
Transport efficiency to 2030<br />
ranks highest for inputs into transport efficiency such as density and quality of infrastructure,<br />
investment in infrastructure and good vehicle stock. France scores a close second to Germany in this<br />
ranking of inputs to transport efficiency.<br />
• Emerging economies lag far behind in efficiency, but are catching up. Although China and India<br />
come in last in our transport efficiency outputs ranking, they are positioned to move up the list in<br />
future, owing to their heavy infrastructure investments. Already, China ranks third in the “policies”<br />
portion of the transport efficiency inputs index.<br />
• Government policy is central to solving congestion—at least in theory. Our benchmarking index<br />
highlights the importance of public policy by showing a strong correlation between positive inputs—<br />
such as high road density, large rail passenger stock per population and high investment in road<br />
infrastructure—and positive outcomes such as free-flowing traffic, safe highways and low emissions.<br />
Yet our corporate interviews suggest widespread scepticism that governments will adopt and<br />
implement the needed policies.<br />
• Congestion problems are widespread, and chronic. Despite ambitious infrastructure investment<br />
plans in many countries, only 27% of executives surveyed say infrastructure in their countries is fully<br />
adequate. Respondents in Asia-Pacific, eastern Europe, and the Middle East and Africa are the least<br />
satisfied with infrastructure in their countries. Nearly one-half (49%) of respondents say transport<br />
infrastructure shortfalls pose the greatest risk to their supply chains.<br />
• Companies expect their congestion-related costs to keep rising. Survey respondents are pessimistic<br />
about near-term improvements in mobility. The business costs associated with blocked traffic include<br />
lost time, wasted fuel, forgone business, and a need for increased inventories and storage space.<br />
Companies expect these costs to continue to rise.<br />
• The cost of transport itself is also expected to increase. Both business and government officials<br />
expect that users will pay higher road and rail charges in the decades ahead, to cover the costs of new<br />
infrastructure. Tighter environmental rules will further raise the cost of transport. The higher costs<br />
of both congestion and road/rail use will prompt companies to pay closer attention to transport and<br />
logistics when choosing operating sites.<br />
• Firms find inventive ways to squeeze more out of existing infrastructure. Executives point to a range<br />
of strategies to cope with congestion, including tightening supply chains, co-ordinating shipments<br />
with suppliers and customers, and increasing night-time deliveries. In addition, logistics providers and<br />
road and rail operators are increasingly using IT systems to navigate around blockages and improve<br />
traffic flow. Nearly two-thirds (63%) of respondents consider intelligent logistics systems to be most<br />
helpful in making the most of existing infrastructure.<br />
© The Economist Intelligence Unit Limited 2010
<strong>Keeping</strong> traffic flowing<br />
Transport efficiency to 2030<br />
The business perspective<br />
Congestion and its costs<br />
The movement of goods has been a critical factor in trade and commerce for thousands of years.<br />
Not least, the Silk Road trading routes connecting China with India, Arabia and Europe contributed<br />
to vast wealth creation in China and the Arabian peninsula over three millennia. Today, the same<br />
holds true: all things being equal, notes François Bertreau, CEO of Norbert Dentressangle, a logistics<br />
and transport group based in France, “The more efficient a country’s transport system, the faster<br />
its economy will grow.” The obverse is also true: as a country grows economically, its transport<br />
requirements increase. Yet in many countries, economic growth is being hampered by bottlenecks in<br />
road and rail networks. The absence of far-reaching measures to meet future needs suggests that this<br />
is not likely to get any better.<br />
What makes efficient transport possible over time? Many factors are involved, including legislation<br />
and regulation, availability of energy and other resources, and technology for getting the most use<br />
out of available infrastructure. But among the most important factors is the transport infrastructure<br />
itself—including infrastructure for road, rail, waterborne and air transport. Typically, mobility<br />
over the long term may be achieved through steady upgrades in such infrastructure, together with<br />
sufficient vehicle stocks and progressive transport policy. (Section 2 of this report ranks long-term<br />
mobility in ten countries based on these variables.)<br />
Beyond the positive macroeconomic effects of ensuring sustainable transport, there is a<br />
significant microeconomic effect—that is, an impact on the profitability and long-term viability of<br />
companies. This study focuses on the impact of inadequate transport infrastructure at the business<br />
level, and how companies deal with congestion.<br />
The overall message from businesses interviewed for this report is that the 20-year outlook for<br />
transport infrastructure adequacy is worrisome. A new study by the Organisation for Economic Cooperation<br />
and Development (OECD, Globalisation, Transport and the Environment, 2010) finds that<br />
in the European Union alone, road freight volumes are expected to grow by 78% between 2000 and<br />
2030—faster growth than in the past 20 years. Given the existing pressure on infrastructure in both<br />
developed and developing countries, and the likelihood that this pressure will increase owing to<br />
population and economic growth and to rapid urbanisation, a large majority of respondents do not<br />
<br />
© The Economist Intelligence Unit Limited 2010
<strong>Keeping</strong> traffic flowing<br />
Transport efficiency to 2030<br />
Thinking about the country in which you are based, how adequate is the current transport infrastructure to support your<br />
organisation generally?<br />
(% respondents)<br />
Somewhat adequate<br />
Fully adequate<br />
Inadequate<br />
Neither adequate nor inadequate<br />
7<br />
Totally inadequate<br />
4<br />
Don’t know<br />
1<br />
19<br />
27<br />
43<br />
believe that infrastructure capacity will be able to keep up with demand over the next two decades.<br />
In particular, only 27% of respondents to our online survey feel that the transport infrastructure<br />
in the countries in which they are based is fully adequate. Forty-three percent are lukewarm,<br />
describing the infrastructure as somewhat adequate, while 23% say it is inadequate or totally<br />
inadequate. Respondents in eastern Europe have fairly low confidence in their transport<br />
infrastructure: only 14% say that transport infrastructure is fully adequate. In the Middle East and<br />
Africa, only 9% agree with this statement.<br />
• Wanted: sustainable infrastructure<br />
With this as backdrop, many companies are focusing more closely on the efficiency of their supply<br />
chains, hoping to improve their performance despite bottlenecks. Some companies claim to have<br />
beaten the odds. Hennes & Mauritz (H&M), a Swedish fashion retailer, has tightened supply and<br />
distribution processes so that deliveries to stores are typically made within a 20-minute timeframe<br />
of the agreed delivery schedule, according to Danny Feltmann-Espersen, the company’s logistics<br />
director.<br />
The pressure on transport infrastructure—and the impact this has on company costs—is also an<br />
important factor in companies’ decisions on where to locate their manufacturing plants. For 83% of<br />
executives in our survey, the availability and quality of transport infrastructure plays an important<br />
role in this decision. The German carmaker BMW, for example, has opened new plants in Chennai in<br />
India and in Shenyang in China in the past decade. Those countries’ investments in new roads helped<br />
To what extent to you agree or disagree with the following statement as it relates to your organisation: "The availability and<br />
quality of transport infrastructure affects where we locate and expand our business."<br />
(% respondents)<br />
Strongly agree<br />
Agree<br />
Neither agree nor disagree<br />
7<br />
Disagree<br />
5<br />
Strongly disagree<br />
5<br />
Don’t know<br />
1<br />
40<br />
43<br />
© The Economist Intelligence Unit Limited 2010
<strong>Keeping</strong> traffic flowing<br />
Transport efficiency to 2030<br />
How does the quality of transport infrastructure in the country in which you are based affect the following aspects of your<br />
company’s business there?<br />
(% respondents)<br />
Increases greatly Increases slightly No effect Decreases slightly Decreases greatly<br />
Cost of business operations<br />
24<br />
41 18 13 5<br />
Competitiveness of the business<br />
25<br />
39 27 8 1<br />
Ability to expand markets<br />
19 45 26<br />
7 3<br />
Ability to attract qualified employees<br />
21 35 35<br />
7 3<br />
Ability to attract financing or investment<br />
14 29 50 5 3<br />
to settle the matter, since it provides access to growing markets and to a wider network of suppliers,<br />
notes Karl Sommer, BMW’s director of logistics. “This also increases competition among suppliers,<br />
which helps us to keep costs under control,” he adds.<br />
The main concern is that insufficient investment in roads and railways will slow traffic to a crawl,<br />
if it is not there already. This concern was expressed by executives across a range of industries. One<br />
example is the Co-operative Group, a British chain of 4,000 retail stores, which sustains direct costs<br />
owing to inadequate infrastructure. At any given time, “a significant number of our 1,500 trucks will<br />
be stuck in a traffic jam, or stopped at traffic lights, or driving on slow secondary roads,” says Trevor<br />
Ashworth, the group’s director of Food Retail Logistics.<br />
Crowded roads are not the only problem. According to Atholl Noon, director of Transport Planning<br />
at Colin Buchanan, a London-based transport consultancy, congestion not only relates to the<br />
insufficient carrying capacity of a road, but is significantly aggravated by bottlenecks at interchange<br />
points such as road and rail junctions, ports and airports. While transferring freight from roads<br />
to other transport modes is often mooted as a partial solution, a variety of technical and market<br />
factors prevent other modes from substituting automatically for road transport. These factors range<br />
from the type of goods involved, which may not be transferable without additional specialised<br />
equipment, to the requirements of the markets for quick delivery. Moreover, goods carried by other<br />
modes often require road transport between the origin/destination points and the intermodal<br />
interchange points.<br />
Other factors hindering mobility have to do with bureaucracy, for example at border crossings.<br />
“On some trips, trucks spend a third of their time stopped at borders, for customs and control,” says<br />
Jack Short, secretary-general of the International Transport Forum (ITF), an inter-governmental<br />
body within the OECD. “For the trucking industry, it’s a very significant logjam.” In some countries<br />
the logjams are huge. A 2007 study by the Transport Corporation of India, a logistics firm, found that<br />
it took eight full days to transport goods by truck 2,150 km between Kolkata and Mumbai—including<br />
32 hours spent at checkpoints and toll booths. The 2010 OECD transport study reports that the<br />
average border crossing time between Uzbekistan and Turkmenistan for both road and rail in 2003<br />
was 120 hours. The maximum time was 280 hours.<br />
• Estimating the costs<br />
How much does all this cost, and how much is it likely to cost in the future? “There’s no doubt<br />
that congestion causes losses of time, increases in the amount of vehicles needed, and adds to<br />
10<br />
© The Economist Intelligence Unit Limited 2010
<strong>Keeping</strong> traffic flowing<br />
Transport efficiency to 2030<br />
Compared to today, how important will transport infrastructure be to your organisation 20 years from now?<br />
(% respondents)<br />
Much more important<br />
Somewhat more important<br />
Equally important<br />
Somewhat less important<br />
5<br />
Much less important<br />
3<br />
Don’t know<br />
1<br />
28<br />
30<br />
32<br />
Thinking about the country in which you are located, how concerned are you that current transport-infrastructure investment<br />
is not enough to support the long-term growth of your business?<br />
(% respondents)<br />
Very concerned<br />
Somewhat concerned<br />
Neither concerned nor unconcerned<br />
Unconcerned<br />
11<br />
Not at all concerned<br />
7<br />
Don’t know<br />
0<br />
15<br />
19<br />
48<br />
emissions, pollution and waste,” says Mr Short. In the UK, the government-sponsored Eddington<br />
Transport Study, a 2006 report about the future of the country’s transport infrastructure, estimates<br />
that eliminating congestion on the UK road network would save £7bn-8bn (€8bn-9bn) annually,<br />
equivalent to around 0.5-0.6% of GDP. The study further estimates that a 5% reduction in travel<br />
times for both freight and passengers would generate £2.5bn of cost savings.<br />
Similarly in India, the Ministry of Transport estimates that as the economy continues to grow<br />
rapidly, the cost of delays at inter-state borders could soar to Rs601.7bn (€9.6bn) by 2017, from<br />
Rs43bn in 2004. As India steps up its road building programme, however, policymakers are trying to<br />
reduce this cost by introducing uniform documentation and by computerising check-posts.<br />
Among the many ways that logjams raise costs is by increasing inventory requirements to guard<br />
against stock-outs along the supply chain. Higher levels of safety stock tie up cash in working<br />
capital. Rising inventories also inflate the cost of storage, particularly at warehousing facilities near<br />
transport hubs such as cities and ports. “We have seen the cost of storage and handling at terminals<br />
going up substantially, as capacity is really reaching its limits,” confirms Peggy Montana, US-based<br />
executive vice-president of supply and distribution for Shell Oil.<br />
Considering the costs associated with congestion, it is no surprise that 58% of our survey<br />
respondents say that transport infrastructure will be more important to their organisations in 20<br />
years’ time.<br />
Similarly, almost one-fifth of respondents say that are very concerned about future transport<br />
adequacy, and 48% say they are somewhat concerned.<br />
© The Economist Intelligence Unit Limited 2010 11
<strong>Keeping</strong> traffic flowing<br />
Transport efficiency to 2030<br />
Navigating the urban jungle<br />
For many city and suburban residents, the morning commute to work<br />
has long been a daily grind. For businesses, it has not been much<br />
different: making deliveries within cities, or navigating through<br />
or around cities to avoid congestion, typically presents the most<br />
difficult logistical challenges. Although policy-makers have known<br />
this for years, it appears that the problem will get worse before it<br />
gets better.<br />
Across the globe, cities are becoming more crowded as rural<br />
populations increasingly move to cities in search of work. UN<br />
population experts expect the worldwide urban population<br />
to almost double to 6.4bn by 2050. The urbanisation trend is<br />
particularly pronounced in the less-developed regions of Asia, Africa<br />
and Latin America. In many developing countries, road networks<br />
typically converge on big cities, forcing through-traffic to traverse<br />
cities and making congestion worse. At the same time, cities are<br />
becoming an increasingly important part of the economic engine in<br />
more advanced, service-based economies.<br />
Growing urban populations mean a growing volume of freight<br />
deliveries in cities, which adds to the strain on urban infrastructure.<br />
Changing consumption trends—higher demand for imported foods,<br />
for example, or increased use of the internet to order goods—are<br />
leading to growth in the number and frequency of smaller deliveries.<br />
Many cities are seeing growth in “evergreen” transport activity, such<br />
as daily deliveries of catering supplies to the same customers.<br />
At the same time, intensifying efforts to promote sustainability<br />
are leading to a greater volume of “reverse logistics” movements,<br />
such as removing business and household waste, including<br />
packaging for recycling. This puts further strain on transport<br />
systems, which in many cities are already at a breaking point.<br />
Circumventing logjams<br />
As businesses lose confidence in the ability of transport systems to deliver adequate service, they<br />
are doing what they can to cope. In particular, depending on their circumstances, companies may<br />
redesign supply chains to source closer to factories or markets, collaborate with business partners<br />
to tighten supply lines, use sophisticated information technology (IT) systems to minimise traffic<br />
delays, change delivery times to avoid congestion, or switch to less-crowded transport modes.<br />
Above all, companies are relying more on logistics expertise to help them squeeze the most use out<br />
of existing transport infrastructure at the least cost in time and money. Following are some of the<br />
techniques that companies are using to squeeze the most out of existing infrastructure:<br />
• Improving planning<br />
Most logisticians would agree that running an efficient supply chain starts long before the first truck<br />
rolls out of a factory gate. It typically starts with precise forecasting of demand for a company’s<br />
products and, by extension, for transport services to ensure the products are delivered. But finetuning<br />
demand forecasting can be a tricky task in turbulent economic times. When economic<br />
instability causes spikes and troughs in demand for a company’s products, the cost reverberations<br />
are felt throughout the supply chain, from the point of origin of raw materials and components to the<br />
point of final consumption of finished products. Not all volatility, of course, can be smoothed out by<br />
advance planning. But the better the forecasting tools, the lower the costs of transport and logistics.<br />
John van Wyk, CEO of Barloworld Logistics Europe, says that many of his clients “look at ways to<br />
improve the planning components of what they do, to make the supply chain smoother and more<br />
balanced.”<br />
Several of our interviewees say that customising products closer to the point of consumption,<br />
rather than earlier in the supply chain, also helps to cut logistics costs. One such company is<br />
Electrolux, a Swedish white goods maker, which focuses on keeping supply chain operations as<br />
12<br />
© The Economist Intelligence Unit Limited 2010
<strong>Keeping</strong> traffic flowing<br />
Transport efficiency to 2030<br />
predictable as possible. Bjorn Vang Jensen, its Singapore-based vice-president of Global Freight<br />
and Logistics Services, comments: “The only way to remove complexity from a supply chain is<br />
to rationalise, standardise, modularise and dis-intermediate, and that is what we are doing.”<br />
In Electrolux’s case, he adds, simplifying the supply chain “is all about moving the point of<br />
customisation or product differentiation much closer to the point of sale.”<br />
• Changing sourcing patterns<br />
Some companies buy components and raw materials closer to the point of use, to minimise transport<br />
requirements. In our survey, 40% of respondents expect their companies to change global purchasing<br />
strategy this way over the next five years. This is nearly twice the proportion of respondents (22%)<br />
who expect to shift purchasing to lowest-cost countries regardless of distances involved. Less than<br />
one-third (30%) say they expect no change in their companies’ global purchasing strategy.<br />
A decision on sourcing closer to market is likely to be strongly influenced by the nature of a<br />
company’s business. For example, manufacturers using heavy components or large quantities of raw<br />
materials are more likely than the average to source these inputs as close as possible to the point of<br />
use. In contrast, retailers focused on the end price of products are more likely to continue sourcing<br />
in the lowest-cost locations, regardless of transport distances to market. In our survey, only 33% of<br />
retailers expect to source closer to markets to minimise transport costs, compared with 40% of the<br />
total sample. In contrast, 64% of manufacturers expect to source closer to markets within the next<br />
five years.<br />
One company that has rethought its sourcing pattern with a view to minimising transport is<br />
Tesco China. It assigns new stores within a region to separate clusters, and once it has 12-15 stores<br />
established, it builds a dedicated distribution centre and related infrastructure for only those<br />
stores—rather than using larger but more remote storage and distribution facilities to supply all its<br />
stores. “This is a more sustainable practice in the long term, as it reduces the total kilometres driven<br />
by our delivery trucks,” confirms Derek Abel, the company’s supply chain director.<br />
• Collaborating with business partners<br />
Paradoxically, maintaining tighter control of logistics systems is increasingly a matter of<br />
collaborating with external partners. Nearly one-half (49%) of our survey respondents plan their<br />
logistics services together with suppliers and customers. Significant proportions also collaborate<br />
with competitors (20%) and with local governments (16%) when planning logistics systems. BMW,<br />
for example, says its suppliers are happy to make their operations transparent to ensure they meet<br />
In your opinion, how will your company change its global purchasing strategy over the next five years?<br />
(% respondents)<br />
Source closer to markets to minimise transport requirements<br />
Shift purchasing to lowest-cost countries regardless of distances involved<br />
Other, please specify<br />
2<br />
No changes envisioned<br />
Don’t know<br />
6<br />
22<br />
30<br />
40<br />
© The Economist Intelligence Unit Limited 2010 13
<strong>Keeping</strong> traffic flowing<br />
Transport efficiency to 2030<br />
Which of the following measures does your company use in its supply chain management? Select all that apply.<br />
(% respondents)<br />
Joint logistics planning with suppliers and customers<br />
Tracking supply chain breakdowns and lessons learnt<br />
Scenario-building or crisis-simulation to deal with bottlenecks<br />
Increasing inventories to hedge against risks of supply chain breakdowns<br />
Collaborating with competitors on transport solutions<br />
20<br />
Collaborating with local governments on logistics planning<br />
16<br />
Other, please specify<br />
2<br />
None, we take no such steps<br />
11<br />
Don’t know<br />
6<br />
26<br />
28<br />
49<br />
49<br />
What is the main focus of your company’s efforts to improve logistics?<br />
(% respondents)<br />
Combination of internal and external process management<br />
Managing internal logistics processes<br />
22<br />
Managing the logistics processes of suppliers and other partners<br />
13<br />
Other, please specify<br />
1<br />
None, we do not focus on improving our logistics function<br />
9<br />
Don’t know<br />
4<br />
51<br />
the company’s logistics requirements. “They accept this, and they even have the feeling that it helps<br />
them to organise their own supply chain more efficiently,” says Dr Sommer.<br />
Companies involved in such collaborative efforts say that a key to success is to keep control of the<br />
process and ensure transparency, while allowing partners access to their information systems where<br />
that promotes transport efficiency. From our survey, it appears that such co-operative arrangements<br />
are on the rise. More than one-half (51%) of our sample say that efforts to improve logistics involve<br />
both internal and external process management.<br />
• Gaining a technological edge<br />
Whether companies collaborate with external partners or do their logistics management by<br />
themselves, they are increasingly relying on sophisticated IT systems to ensure efficiency. In<br />
particular, companies are relying on information and communication technology (ICT) systems such<br />
as vehicle-to-hub or vehicle-to-vehicle data transfers or informatics-based traffic management<br />
systems to avoid transport logjams. In our survey, 63% of respondents say that such automated<br />
systems are among the most important ways of squeezing the most use out of existing transport<br />
infrastructure. Nearly one-half (47%) mention new IT systems allowing smarter vehicle navigation as<br />
among the most useful logistics network improvements.<br />
14<br />
© The Economist Intelligence Unit Limited 2010
<strong>Keeping</strong> traffic flowing<br />
Transport efficiency to 2030<br />
In your opinion, which of the following system upgrades or policies would be most useful to improve logistics networks?<br />
Select up to three.<br />
(% respondents)<br />
Intelligent Logistics Systems (eg smart telematics, vehicle-to-vehicle communication, vehicle-to-hub communications) aimed at using available<br />
transport capacity more efficiently<br />
New IT systems allowing smarter vehicle navigation to avoid bottlenecks<br />
More transfer points allowing freight to shift to less-congested modes<br />
Remote sensing technologies to allow automatic cargo forwarding<br />
22<br />
Offering incentives to companies to source closer to markets<br />
19<br />
More transfer points allowing passengers to shift to less-congested modes<br />
16<br />
Systems granting priority to passenger vehicles at intersections<br />
13<br />
Systems granting priority to large or heavy vehicles at intersections<br />
11<br />
Other, please specify<br />
2<br />
None of the above, no improvements needed<br />
2<br />
Don’t know<br />
5<br />
35<br />
47<br />
63<br />
Companies that have implemented such systems report measurable improvements. The UK-based<br />
Co-operative Group adopted route planning software that is expected to deliver an immediate 30%<br />
reduction in fuel used by its trucks, according to Mr Ashworth. Similarly, Electrolux is implementing a<br />
transport management system throughout its operations worldwide. “The system went live first in the<br />
US, and has allowed us to increase vehicle routing efficiency by up to 20%,” explains Mr Jensen. “It is<br />
now being rolled out worldwide, and will eventually encompass all modes of transport in the group.”<br />
Such systems are expected to become more widespread in the coming years. Two-thirds (66%) of<br />
our survey respondents foresee wider use of intelligent IT systems in their own logistics operations<br />
within the next decade. “You cannot operate at the level of complexity of these organisations,<br />
without some level of decision support coming from a technology solution,” says Mr van Wyk of<br />
Barloworld.<br />
• Moving freight by rail and water<br />
In the face of crowded roads and highways, many companies are taking a closer look at multimodal<br />
transport, and in particular at the possibility of moving more goods by rail and water. In our survey,<br />
43% of respondents foresee growth of multimodal transport as one of the top three changes in intraand<br />
inter-company logistics within the next ten years.<br />
Rail and water transport are far from a panacea, however. To begin with, freight moved by rail or<br />
water generally must be delivered by road from the point of origin to the intermodal transfer point,<br />
and from the end of the long-haul rail or water journey to the final destination. Moreover, as noted<br />
above, not all types of freight are immediately transferable among transport modes, owing to market<br />
and technical reasons. In addition, rail and water transport are typically slower than road transport,<br />
and often makes sense economically only over long distances. “Rail transport is currently only viable<br />
beyond a minimum number of miles,” says Mr Ashworth of the Co-operative Group, which is starting<br />
© The Economist Intelligence Unit Limited 2010 15
<strong>Keeping</strong> traffic flowing<br />
Transport efficiency to 2030<br />
What major changes or trends do you foresee in intra- and inter-company logistics within the next 10 years? Select up to three.<br />
(% respondents)<br />
Wider use of intelligent IT-systems and networks in hubs and vehicles<br />
Growth of multi-modal transport<br />
Road access to urban areas limited to certain technologies like hybrid or electric vehicles<br />
35<br />
Increased cooperation between competing logistic providers<br />
30<br />
Other, please specify<br />
2<br />
None, we expect to continue using current logistics systems and methods<br />
9<br />
43<br />
66<br />
to use trains to move goods from a storage depot in Daventry in central England over 500 km north to<br />
Glasgow in western Scotland. His verdict so far: “Train frequency needs to be greater, the lead times<br />
need to be shorter, and the economics have to change as well.”<br />
Nonetheless, some companies hope to see greater multimodalism in future. “We could gain a lot<br />
with more flexible ways to move more freight from road to rail,” says Mr Feltmann-Espersen. “I don’t<br />
see that is happening as much as I could wish for.” Oriflame, a Swedish cosmetics maker, and Otto<br />
Group, a German mail order giant, are so persuaded by the potential of rail freight that they have<br />
piloted use of a proposed 10,000-km train service connecting Beijing to Hamburg. At some 15 days,<br />
the journey takes around half the time of waterborne routes between the two cities.<br />
• Delivering at night<br />
Some companies sidestep urban congestion by making deliveries at night. Yum! Brands China, which<br />
operates 3,500 Kentucky Fried Chicken and Pizza Hut restaurants throughout the country, uses this<br />
approach for its refrigerated ingredients. Fast deliveries when traffic is light ensures that fresh foods<br />
are delivered fresh, notes Roland Chong, the company’s logistics general manager. This makes sense<br />
from the point of view of the wider transport system, adds Mr Noon of Colin Buchanan. “Moving traffic<br />
away from the shoulders of the peak gives you tremendous extra transport capacity at no extra cost,”<br />
he says.<br />
16<br />
The corporate logistics function comes to the fore<br />
Some of the effort by companies to wring more out of the logistics<br />
system is being made within the corporate walls. In particular,<br />
companies are moving towards a greater professionalisation of<br />
their logistics functions, ensuring that it plays a more significant<br />
role within overall corporate strategy. In our survey, 60% see a<br />
growing professionalisation of the logistics function. Similarly,<br />
58% say the logistics function adds value to the business<br />
rather than only focusing on costs. Significantly, one-half<br />
agree that supply chain management is a good springboard for<br />
career advancement.<br />
However, companies say they have a long way to go to bring<br />
logistics management fully into the centre of strategic decisionmaking.<br />
Our survey shows that responsibility for supply chain<br />
management is diffused throughout companies; there is no<br />
significant clustering of responsibility in any job function or title.<br />
Moreover, our respondents see the logistics function as suffering<br />
from a general lack of understanding of what the job entails. In<br />
our survey, 44% say that other functions lack understanding of the<br />
strategic role of logistics, and 35% say that logistics staff members<br />
lack an understanding of the wider business. More than one-fourth<br />
(26%) of respondents find that the logistics function lacks a unified<br />
voice or strong leader, and the same proportion find that senior<br />
management lacks an understanding of this function.<br />
© The Economist Intelligence Unit Limited 2010
<strong>Keeping</strong> traffic flowing<br />
Transport efficiency to 2030<br />
In some places, the idea of night-time deliveries conflicts with existing regulation designed to<br />
protect local residents. In much of London, for example, trucks over 18 tonnes are not permitted<br />
between 9 pm and 7 am—meaning that more trucks are on the road in the morning rush hour. But<br />
there is now evidence of a shift in thought among policymakers. Barcelona and Dublin have piloted<br />
city night delivery schemes; and the UK government is funding a 15-month trial to test quiet<br />
Who is primarily responsible for setting supply chain management strategy in your organisation?<br />
(% respondents)<br />
Chief logistics officer<br />
<strong>Traffic</strong> managers for individual business units<br />
6<br />
Supply chain director<br />
Head of business unit<br />
Chief operating officer<br />
CFO/Treasurer/Comptroller<br />
5<br />
CEO/President/Managing director<br />
Other, please specify<br />
Don’t know<br />
5<br />
7<br />
13<br />
14<br />
14<br />
18<br />
19<br />
Which are the biggest barriers to a greater strategic impact for supply chain management within your organisation?<br />
Select up to three.<br />
(% respondents)<br />
Other functions lack understanding of how logistics can be used strategically<br />
Logistics staff lack understanding of the wider business<br />
The logistics function lacks a unified voice or strong leader<br />
26<br />
Senior management lacks understanding of how logistics expertise can be used strategically<br />
26<br />
Logistics function is underfunded/overstretched<br />
22<br />
Other, please specify<br />
3<br />
Don’t know<br />
15<br />
35<br />
44<br />
How strongly do you agree or disagree with the following statements?<br />
(% respondents)<br />
Agree strongly Agree Neutral Disagree Disagree strongly Don’t know/Not applicable<br />
We see a growing professionalisation of our logistics function<br />
14<br />
46<br />
26 4 1<br />
9<br />
Our logistics function focuses on value rather than simple cost reduction<br />
12<br />
46<br />
22<br />
11 1<br />
8<br />
We try to spread logistics expertise widely throughout the organisation<br />
7<br />
31<br />
33<br />
17 2<br />
10<br />
Employees company-wide are trained to make good logistics decisions<br />
7<br />
30<br />
30<br />
22 4<br />
7<br />
Supply chain management is a good springboard for career advancement<br />
13<br />
37<br />
25<br />
13 3<br />
9<br />
© The Economist Intelligence Unit Limited 2010 17
<strong>Keeping</strong> traffic flowing<br />
Transport efficiency to 2030<br />
deliveries—opening the way for out-of-hours drop-offs to city retailers. Conditions attached to any<br />
future lifting of night curfews are likely to include requirements for quieter trucks, for example those<br />
using upgraded air brakes and low-noise tyres.<br />
Long-term cost implications<br />
Already today, transport plays a critical role in business operations. In the next 20 years, that role<br />
is likely to grow further. Nearly one-half (49%) of our survey respondents agree that failure of<br />
infrastructure capacity to meet demand is the main long-term risk to their supply chains—higher<br />
than any other risk. The worries focus on the most-used transport modes: 48% say that roads and<br />
highways will be most in need of upgrade in the next 20 years, whereas 39% say that railways will<br />
need the most work.<br />
Yet public funding for such upgrades is scarce, particularly in advanced countries that already have<br />
extensive networks in place and where governments carry growing welfare burdens. “Public budgets<br />
are experiencing more and more constraints in ageing societies,” says Johannes Ludewig, executive<br />
director of the Brussels-based Community of European Railway and Infrastructure Companies.<br />
The private sector has also cut back its participation in transport infrastructure projects amid<br />
widespread economic gloom. In January 2010, for example, the Polish government cancelled a<br />
€1.8bn private-public partnership to develop the country’s A1 motorway, owing to the private<br />
partner’s funding shortfall. Moreover, when forced to decide between passenger and freight facilities,<br />
policymakers tend to favour passenger projects, notes Mr Ludewig. “Cargo doesn’t vote,” he adds.<br />
Survey respondents place the blame for inadequate funding on government. Nearly one-half (46%)<br />
of respondents cite poor government effectiveness as one of the top three barriers to improving<br />
infrastructure, particularly in developing countries. Lack of political will or sense of urgency (40%) is<br />
another major factor, especially in advanced economies.<br />
Over the next five years, which of the following factors pose the greatest risks to your company’s global supply chain?<br />
Select up to three.<br />
(% respondents)<br />
Failure of infrastructure capacity to match demand<br />
Energy costs<br />
Congestion on roads, railways or waterways<br />
Disruptions to, or failure of, suppliers<br />
Structural changes to market supply and demand<br />
Geopolitical instability (wars, revolutions)<br />
Corruption<br />
16<br />
Export restrictions<br />
15<br />
Strike action and industrial disputes<br />
14<br />
Customs red tape<br />
14<br />
Natural disasters<br />
10<br />
20<br />
22<br />
23<br />
38<br />
40<br />
49<br />
18<br />
© The Economist Intelligence Unit Limited 2010
<strong>Keeping</strong> traffic flowing<br />
Transport efficiency to 2030<br />
In the country in which you are based, which aspect of transport infrastructure, if any, will be most in need of expansion or<br />
upgrading within the next 20 years? Select up to three.<br />
(% respondents)<br />
Roads and highways<br />
Railways<br />
Public transit in urban areas<br />
Public transport between cities<br />
Intermodal freight facilities (eg, to transfer freight from road to rail)<br />
Seaports<br />
19<br />
Intermodal passenger facilities<br />
15<br />
Cycle ways in urban areas<br />
11<br />
Inland waterways<br />
10<br />
None of the above, infrastructure will be adequate<br />
2<br />
Other, please specify<br />
3<br />
Don’t know<br />
3<br />
23<br />
31<br />
39<br />
39<br />
48<br />
In the country in which you are based, which, if any, of the following are major impediments to upgrading transport<br />
infrastructure? Select up to three.<br />
(% respondents)<br />
Poor governmental effectiveness<br />
Lack of political will or sense of urgency<br />
Politicisation of infrastructure project priorities<br />
Lack of public funds<br />
Corruption or misuse of funds earmarked for infrastructure<br />
Lack of skills, knowledge or training of officials in this area<br />
14<br />
Poor creditworthiness of public authorities<br />
11<br />
Other, please specify<br />
3<br />
None of the above, there are no impediments<br />
11<br />
Don’t know<br />
0<br />
31<br />
37<br />
39<br />
40<br />
46<br />
• A greater role for private investors<br />
In view of public funding shortfalls, both government and businesses are giving more attention to<br />
potential private financing sources. In our survey, fully 80% of respondents agree that private industry<br />
should be involved in financing infrastructure improvements.<br />
Some of our interviewees caution that private-sector participation can be a double-edged sword, as<br />
the private participants’ profit motives may conflict with the governments’ policy goals. “The private<br />
sector brings efficiencies and usually better customer service, but where the private sector falls down<br />
© The Economist Intelligence Unit Limited 2010 19
<strong>Keeping</strong> traffic flowing<br />
Transport efficiency to 2030<br />
In the country in which you are based, which, if any, of the following factors would produce the greatest infrastructure<br />
improvement? Select up to three.<br />
(% respondents)<br />
More funds for transport infrastructure<br />
Greater use of public-private partnerships for infrastructure<br />
More transparency in public spending on infrastructure<br />
More transparency in project selection<br />
Better training of public sector officials<br />
Not applicable—no need for improvement<br />
5<br />
Other, please specify<br />
5<br />
Don’t know<br />
2<br />
28<br />
35<br />
48<br />
51<br />
51<br />
is where the profit motive conflicts with the transport objective,” notes Mr Noon of Colin Buchanan.<br />
“There is often a mismatch between policy aims and the aims of the private sector,” says Mr Short<br />
of the ITF. “Public policy wants the money to go to railway projects or public transport projects, for<br />
example. But the private sector doesn’t quite see the benefits.”<br />
Whether infrastructure construction is privately or publicly funded, it appears likely that the cost of<br />
using it will increasingly fall on users, and that these costs will rise steadily over the next two decades.<br />
“We will see the cost of transport going up rapidly,” predicts Mr Bertreau of Norbert Dentressangle. “It<br />
comes back to a fundamental change in the way we pay for transport,” says Mr Short of the ITF. “There<br />
is a lot to be said for a system where you pay for use of transport infrastructure, as you use it.” Already<br />
in some countries, policymakers and private companies are charging for road use —in cities such as<br />
London and Stockholm, and on intercity motorways in France, Germany, Switzerland and Austria,<br />
among others.<br />
• Transport’s “green” future<br />
In addition to more tolls and taxes, most business executives expect that various “green logistics”<br />
measures and regulations will come into force in the coming years, further driving up the cost of<br />
transport. Fully 86% of survey respondents say that stricter emissions limits for vehicles are on the<br />
way. In addition, 52% expect rules mandating eco-driving techniques—such as shifting up as soon as<br />
Do you agree or disagree with the following statement, with reference to the country in which you are based: "Government<br />
should work more closely with private industry to finance transport infrastructure improvements."<br />
(% respondents)<br />
Strongly agree<br />
Agree<br />
Neither agree nor disagree<br />
Disagree<br />
5<br />
Strongly disagree<br />
2<br />
Don’t know<br />
1<br />
12<br />
38<br />
42<br />
20<br />
© The Economist Intelligence Unit Limited 2010
<strong>Keeping</strong> traffic flowing<br />
Transport efficiency to 2030<br />
How likely do you consider each of the following "green logistics" measures to become law in your country within the next five<br />
years?<br />
(% respondents)<br />
Very likely/Already determined by law Likely Unlikely Very unlikely Don’t know<br />
Stricter emissions limits for vehicles<br />
41 45 7 3 3<br />
Eco driving techniques to reduce per-kilometre fuel use<br />
11<br />
Signalling systems granting priority to certain types of vehicles<br />
41 33 12 3<br />
10 29 42 13 7<br />
Introduction of Intelligent Logistic Systems (ILS) including vehicle-to-vehicle and vehicle-to-hub communication<br />
13 43 24 12 8<br />
possible, maintaining a steady speed and anticipating traffic flows—to enter into force. “Sustainability<br />
will push towards a different transport strategy, especially as compliance obligations become more<br />
demanding,” says Mr van Wyk of Barloworld.<br />
The environmental regulation with the biggest impact on transport users’ pocketbooks would be<br />
to charge for carbon dioxide emissions. These charges may be direct, for example in the form of taxes<br />
or emissions cap-and-trade schemes; or indirect, for example in the form of requirements to invest<br />
in cleaner fuels and engines. If the direct and indirect costs of carbon are set high enough, transport<br />
would become an even more pivotal factor in companies’ decisions on where to source inputs, where to<br />
manufacture, and how to manage their supply chains to best advantage.<br />
A controversial rail hub<br />
Even when funding is present, investment in transport<br />
infrastructure can face formidable obstacles. Consider the<br />
current controversy over the proposed Kent International<br />
Gateway (KIG) in south-eastern England. The Gateway is a railfreight<br />
interchange planned near the M20 motorway around 70<br />
kilometres from London.<br />
Backed by a special-purpose firm partly owned by AXA Real<br />
Estate, the proposed 112-hectare rail hub would include 374,000<br />
sq metres of warehousing space, offices, research and development<br />
centres and light industry plants. It would act as a distribution hub<br />
for rail freight entering the UK via the Channel Tunnel—an inland<br />
port, in effect—and for domestic freight in the south of England.<br />
The site would handle 13 trains daily. If it is ever built, the Gateway<br />
would remove about 60m kilometres of truck journeys from British<br />
roads annually—leading to lighter motorway use and heavier<br />
Channel Tunnel use. This is in line with the British government<br />
policy to encourage rail use for cargo.<br />
But since the project was first mooted in late 2007, it has run<br />
into strong opposition from local residents, who worry about<br />
additional traffic, air pollution and noise. Local authorities rejected<br />
the plan in late 2009. The decision now rests with the UK’s recently<br />
elected government. Sustainable transport is all well and good, but<br />
the view of local residents is: “Not on our doorstep.”<br />
© The Economist Intelligence Unit Limited 2010 21
<strong>Keeping</strong> traffic flowing<br />
Transport efficiency to 2030<br />
Transport efficiency:<br />
A benchmarking exercise across ten countries<br />
SUMMARY<br />
INPUTS Infrastructure Vehicle stock Policies<br />
1 Germany 7.0 1 Germany 8.1 1 Germany 7.0 1 France 6.4<br />
2 France 6.5 2 France 7.5 2 Poland 6.4 2 Germany 5.8<br />
3 UK 5.8 3 Spain 7.4 3 UK 6.0 3 China 5.6<br />
4 Poland 5.6 4 UK 6.0 4 France 5.7 4 UK 5.3<br />
5 Spain 5.6 5 Poland 5.5 5 Spain 4.7 5 Poland 5.0<br />
6 China 4.2 6 Russia 3.9 6 Russia 4.7 6 Spain 4.6<br />
7 Russia 3.7 7 China 3.6 7 China 3.4 7 South Africa 2.7<br />
8 South Africa 2.9 8 South Africa 3.1 8 South Africa 2.8 8 Russia 2.5<br />
9 Brazil 2.0 9 India 2.5 9 Brazil 2.0 9 Brazil 2.4<br />
10 India 2.0 10 Brazil 1.7 10 India 1.8 10 India 1.7<br />
OUTPUTS Mobility Safety Environment<br />
1 France 9.4 1 France 9.4 1 France 9.9 1 Germany 9.1<br />
2 Germany 8.2 2 Germany 7.7 2 UK 9.0 2 France 8.8<br />
3 Poland 7.9 3 Spain 6.7 3 Poland 8.9 3 Poland 8.7<br />
4 UK 7.8 4 UK 6.3 4 China 8.7 4 UK 8.1<br />
5 Spain 7.5 5 Poland 6.2 5 Spain 8.6 5 Brazil 7.7<br />
6 Brazil 6.3 6 Brazil 5.1 6 Germany 8.0 6 Spain 7.0<br />
7 Russia 5.8 7 South Africa 5.0 7 Russia 6.1 7 Russia 6.4<br />
8 South Africa 3.9 8 Russia 5.0 8 Brazil 6.1 8 South Africa 5.2<br />
9 China 3.7 9 India 4.1 9 India 2.3 9 India 1.7<br />
10 India 2.7 10 China 2.4 10 South Africa 1.5 10 China 0.0<br />
INPUT and OUTPUT category scores calculated as weighted sum of underlying section scores. Section scores are calculated as weighted sum of all<br />
indicator scores within the section. All scores range from 0-10 where 10=best.<br />
22<br />
© The Economist Intelligence Unit Limited 2010
<strong>Keeping</strong> traffic flowing<br />
Transport efficiency to 2030<br />
Introduction<br />
Are the roads better in Brazil, or in India? To compare the transport efficiency of a cross-section of<br />
advanced and emerging economies, the Economist Intelligence Unit has developed the Transport<br />
Efficiency Index (TEI). The index ranks ten countries: France, Germany, Poland, the UK, Spain, Brazil,<br />
Russia, South Africa, China and India.<br />
The TEI consists of two separate rankings for these countries: one for inputs into transport efficiency;<br />
and the other for transport efficiency outputs or outcomes. The input index scores variables that<br />
contribute to the overall performance of the national transport systems, for example the density of<br />
roads or railways, the number of vehicles and transport policies. The output index measures the actual<br />
performance of the transport systems in terms of mobility, safety and environmental sustainability.<br />
This separation of indicators into inputs and outputs allows for an analysis of how well positive inputs<br />
such as investment in infrastructure or high road density correlate with positive outputs such as freer<br />
mobility or better road safety. (Please see Appendix 2 for a fuller discussion of the index methodology.)<br />
The purpose of the TEI is to enable a comparison of individual countries using all transport efficiency<br />
indicators in the aggregate, or in the context of individual indicators. The index shows that, in terms<br />
of outputs (mobility, safety and environment), France has the most efficient transport network, with<br />
an overall output score of 9.4 out of 10. On this measure France is well ahead of the next contender,<br />
Germany, which has an overall output score of 8.2. Following in a close grouping are Poland, the UK<br />
and Spain. At the bottom of the heap, in terms of outputs, are South Africa (3.9), China (3.7) and<br />
India (2.7).<br />
In terms of input variables (infrastructure, vehicle stock and policies), Germany leads the pack, with<br />
an overall input score of 7.0. On this measure, Germany—with dense road and rail networks and large<br />
vehicle stock—is ahead of France (6.5) and the UK (5.8). France comes a close second owing to its high<br />
score for transport policies, which in turn is based on its high road density by population, its network<br />
of high-speed rail passenger transport, and its investment in road and rail infrastructure. Poland and<br />
Spain, with overall input scores of 5.6 each, are not far behind in the inputs category.<br />
Unsurprisingly, input variables, on the whole, are positively correlated with output variables. But<br />
there are exceptions, indicating a time lag between a high score on inputs and a high score on outputs.<br />
China, for example, ranks sixth in the inputs index on the strength of its heavy investment in motorway<br />
construction, yet ranks ninth in outputs. The road network, when built, may well push China higher up<br />
in future years. Similarly, India, which scores lowest in both aggregate inputs and outputs, has more<br />
passenger rail stock than any other country in the sample.<br />
As for India’s roads, they are on a par with those in Brazil.<br />
Country profiles<br />
The Transport Efficiency Index (TEI) shows a wide range of current transport conditions and levels of<br />
commitment to improving transport efficiency in the ten countries under review. Following is a brief<br />
analysis per country of the index results, and some of the main factors and circumstances within each<br />
country giving rise to those results. The countries were selected with a view to providing a cross-section<br />
of developed and emerging economies.<br />
© The Economist Intelligence Unit Limited 2010 23
<strong>Keeping</strong> traffic flowing<br />
Transport efficiency to 2030<br />
• Brazil 2014 FIFA World Cup plans<br />
Brazil sits near the bottom of the pile in terms of transport inputs. Across each of the input subcategories,<br />
it ranks second to last, or last. With just 0.1% of GDP invested in road infrastructure<br />
(compared with an average of 3.3% across the ten countries) and 0.4% in rail infrastructure (2.2%),<br />
it is little wonder that Brazil’s roads are largely unpaved, and of the small proportion of paved roads<br />
few live up to developed-country quality standards. The country’s congestion problems are legendary.<br />
A low point was reached in June 2009, when local media reported accumulated queues of 182 miles<br />
(291 km) on roads in and around São Paolo. As Brazil’s economy continues to grow, it is likely that the<br />
infrastructure will come under increasing strain.<br />
Nevertheless, when compared with its poor input scores, Brazil scores well in terms of its outputs.<br />
In aggregate, Brazil is ranked sixth in terms of output indicators of transport efficiency (with a score<br />
of 5.1). In no small part, this is thanks to a good performance in the environment outputs (7.7, fifth).<br />
The minimal environmental impact this score reflects is most likely linked to Brazil’s extensive use of<br />
ethanol fuels for transport.<br />
The government is starting to step up investments in the country’s transport efficiency. It is<br />
planning some US$6.5bn of investment in large urban transport projects to prepare for the 2014 FIFA<br />
World Cup. A high-speed rail route between São Paulo and Rio de Janeiro is under development, and is<br />
set for operation by the time the football tournament starts. Further improvements are also likely in<br />
the run-up the 2016 Summer Olympic Games in Rio.<br />
• China A vast investment programme<br />
China ranks ninth out of the ten countries in terms of the efficiency output indicators of its transport<br />
infrastructure (3.7). In part, this reflects poor mobility, an indicator on which China scores lowest<br />
overall (2.4), and in environment, where China also ranks lowest of all countries (0.0). But there<br />
are some bright spots: low levels of road accidents and injuries and fatalities contribute to a strong<br />
ranking in the safety output. China scores fourth overall in the safety category.<br />
Following decades of capacity constraints, China kick-started its transport infrastructure<br />
investment in the mid-1990s, building up a network of expressways that had reached 65,000 km by<br />
the end of 2009. The expressway system is set to expand to 85,000 km by 2020, 120,000 km by 2030<br />
and 175,000 km by 2050. This ambitious programme is reflected in the benchmarking index: China is in<br />
sixth place in terms of inputs (4.2), including transport policy (5.6), in which it ranks third overall. The<br />
country invests about 13.7% of its GDP in road infrastructure, and 10.8% in rail—a higher percentage<br />
than any other country in the sample.<br />
Furthermore, last year China committed to a Rmb1.8trn (€193bn) infrastructure stimulus package—<br />
probably the world’s biggest infrastructure investment plan—a significant proportion of which is<br />
earmarked for transport. Much of the efforts will be focused on putting freight onto rail—building on<br />
its already-strong passenger and freight rail stock, which rank second and first respectively. China<br />
has also announced its intention to take the environment into account when designing its transport<br />
policies, in part owing to its high dependence on oil.<br />
• France Leading the pack in efficiency<br />
24<br />
© The Economist Intelligence Unit Limited 2010
<strong>Keeping</strong> traffic flowing<br />
Transport efficiency to 2030<br />
France leads our benchmarking index in overall transport efficiency. Of the ten countries in the ranking,<br />
France has the most sustainable transport, as measured by the aggregate of its scores on “outputs”<br />
such as mobility, safety and environmental impact. France topped the rankings in the sub-categories of<br />
mobility (9.4) and safety (9.9), and ranked a close second in environment (8.8).<br />
<strong>Traffic</strong> in France moves on one of the densest and most efficient networks in the world. Its numberone<br />
ranking may be a result of its extensive and modern motorway system and good system of<br />
secondary roads. France is also less densely populated than Germany, and its economic and industrial<br />
life is centralised (in Paris), so that it has fewer urban hubs which give rise to congestion.<br />
But France is not resting on its laurels. As part of plans to slash the volume of freight transported<br />
by road, the government plans to levy new taxes on heavy goods vehicles, and has earmarked €7bn to<br />
foster greater use of rail freight; not least, there are plans to build 2,000 km of high-speed rail routes<br />
by 2020. The government is also planning to boost seaborne transport in the North Sea, and to upgrade<br />
routes to Spain and Portugal.<br />
• Germany An efficient fleet<br />
It comes perhaps as little surprise that Germany—the first European country to build a motorway<br />
system—wins high marks for transport efficiency. Germany scored highest (7.0) on transport efficiency<br />
“inputs”. Its top score in the inputs sub-category of infrastructure (8.1) stems from decades of close<br />
attention to building up an efficient network of road and rail routes, including high-speed routes.<br />
In vehicle stock, Germany comes highest again (7.0), with the highest number of cars (613 per 1000<br />
population).<br />
In outputs, Germany comes in second overall, and ranks first in the outputs category of<br />
environmental impact of transport, owing to its efficient fleet of relatively new vehicles. Where<br />
Germany falls down is in safety. Its higher figure for road accidents with injuries per vehicle km reflects<br />
high congestion on Germany’s roads.<br />
On the plus side, Germany has ambitious plans to expand its infrastructure further. Funding<br />
available for the road, rail and waterway modes for the period 2001-15 foresees €66bn of expenditure<br />
on new and existing national railway infrastructure, trunk roads and federal waterways. Around 35% is<br />
slated for further improvements in the infrastructure of the new federal states of eastern Germany.<br />
• India Accelerating the pace of road building<br />
India perhaps faces the greatest transport efficiency challenges, as highlighted by the Transport<br />
Efficiency Index. India is ranked last in both aggregate inputs (score: 2.0) and outputs (2.7). Much of<br />
its transport infrastructure is woefully inadequate, especially its roads, which are generally in poor<br />
condition. One bright spot in the ranking is India’s rail passenger transport stock, which is higher<br />
than that of any other country in the index.<br />
After India’s economy was liberalised in the 1990s, India launched a huge programme of highway<br />
upgrades, the National Highway Development Project. This commitment is reflected in India’s fourthplace<br />
ranking in terms of investment in rail (equivalent to 1.2% of GDP), and in road (2%). Following<br />
the formation of a new government in 2009, India has further stepped up its commitment to invest in<br />
efficient infrastructure. Already the pace of road building has accelerated.<br />
© The Economist Intelligence Unit Limited 2010 25
<strong>Keeping</strong> traffic flowing<br />
Transport efficiency to 2030<br />
According to recent estimates by Goldman Sachs, India will need to spend US$1.7trn on<br />
infrastructure projects in the coming decade if it is to close its infrastructure gap and foster economic<br />
growth. The Indian government has ambitious plans to upgrade India’s national highways in phases,<br />
up to the end of 2015. These plans include adding extra lanes, developing new motorways, and<br />
adding ring roads and bypasses.<br />
• Poland Linking to Europe’s motorway corridors<br />
While Poland has an adequate network of railways, the country remains heavily reliant on road<br />
transport. Yet for a long time, the country’s road network has been poor, caused by inadequate<br />
maintenance. Since Poland joined the European Union in 2004, however, EU grants have made<br />
a significant contribution to the efficiency of its transport infrastructure, including by enabling<br />
upgrades to road networks.<br />
These investments are paying dividends. In the Transport Efficiency Index, Poland is placed<br />
fourth in terms of inputs (with a score of 5.6). In terms of efficiency output indicators, Poland (7.9)<br />
is marginally ahead of the UK (7.8) and Spain (7.5). Poland scores second in terms of vehicle stock,<br />
partly owing to the large number of freight vehicles on the roads. It ranks third in the output subcategories<br />
of safety and environment, with a top score in terms of emissions and fuel consumption of<br />
its vehicle fleet.<br />
Poland’s National Transport Policy for 2006-25, which was approved in 2005, set modernisation of<br />
the transport network as the top priority. By 2013, Poland plans to upgrade existing roads and double<br />
the length of its motorways. Among ambitious plans are four new motorway corridors—north-tosouth<br />
and east-to-west—which will form part of the transport corridors linking the north of Europe<br />
with the south. Furthermore, the Polish government announced in late 2009 that the country expects<br />
to open its first high-speed rail route by 2020.<br />
• Russia Ambitious expansion by 2030<br />
Russia has long networks of roads and railways, but the country’s transport infrastructure is in poor<br />
shape, in many cases because of neglect. Russia comes seventh both in aggregate inputs (with a score<br />
of 3.7) and in outputs (5.8). In individual indicators, it scores well on railways density relative to<br />
population, and on rail freight transport stock relative to population. Russia scores marginally above<br />
the average in terms of road vehicle stock and on the environment. Unsurprisingly, given the scale of<br />
the country, it scores tenth in road density per land area.<br />
Recently, Russia has begun to invest heavily to improve its lagging transport system. Its<br />
investment in roads (4.3% of GDP, compared with a 3.3% average across the sample) places it third<br />
in the index (behind China and Poland) for this indicator. Russia’s investment in rail (3.2% of GDP<br />
compared with an average of 2.2%) gives it a number-two ranking (behind China) for this indicator.<br />
In 2008 Russia approved a new transport policy to 2030, which includes over 3,000 km of new<br />
railways by 2015; 2,000 km of highways by 2015; and 9,000 km of highways by 2030. Already last<br />
summer, the government granted a concession for building a new 650-km Moscow-St Petersburg<br />
road link.<br />
• South Africa A World Cup legacy<br />
26<br />
© The Economist Intelligence Unit Limited 2010
<strong>Keeping</strong> traffic flowing<br />
Transport efficiency to 2030<br />
South Africa’s transport efficiency faces many challenges. The TEI places South Africa eighth both<br />
in inputs (with an aggregate score of 2.9) and in outputs (3.9). Just 17% of the country’s roads are<br />
paved—less than any other country in the sample. Safety on its roads is the worst among all countries<br />
in the sample: South Africa comes last in terms of road injuries, and ninth in terms of fatalities—<br />
better only than India.<br />
Recently, however, South Africa has been investing heavily in urban infrastructure, in preparation<br />
for the 2010 FIFA World Cup. It views improved transport as the primary legacy of the tournament.<br />
In total, the government has dedicated a budget of some R11.7bn (€1.2bn) to World Cup transport<br />
projects. These projects include public transport and road infrastructure, rail upgrades and<br />
intermodal facilities, and bus rapid transit systems in Johannesburg and other cities.<br />
Building on these efforts, government policymakers have said they plan to continue investing<br />
heavily in the country’s transport infrastructure after the World Cup has ended. They say they<br />
will shift their focus towards some of the critical areas of infrastructure, for example addressing<br />
shortfalls in road infrastructure in small towns and rural areas.<br />
• Spain Banking on high-speed rail<br />
Following Spain’s accession to the European Union in 1986, the government embarked on ambitious<br />
transport infrastructure programmes. Over the past two decades, it has invested large sums in road<br />
and rail routes, including a high-speed rail network. As a result, Spain tops the transport efficiency<br />
index in terms of high-speed rail as a proportion of the network. It is significantly ahead of France<br />
and Germany on this indicator.<br />
In all, Spain is ranked in fifth place for inputs (with a score of 5.6) and fifth for outputs (7.5). Its<br />
score in individual indicators are also mostly in the middle field. Where Spain excels is in road density<br />
by population (ranked first) and motorways as a percentage of the total network (second), as a result<br />
of sustained investment during the 1990s. Spain is also ranked joint first, with France, in a rating of<br />
road quality. <strong>Traffic</strong> volume is lightest of the ten countries, marginally ahead of Poland and France.<br />
Some of Spain’s roads need upgrading. But it is rail that the government plans to focus on in<br />
the coming decade. Its Strategic Plan for Infrastructure and Transport (PEIT), spanning 2005-20,<br />
foresees railway spending of €120bn—48% of the total PEIT budget; over €80bn of this is earmarked<br />
for high-speed rail. By 2020, 90% of Spaniards will have a high-speed railway connection within 50<br />
km of their homes.<br />
• UK Improving existing networks<br />
The UK has a well-developed road and rail network. The TEI places the UK third in terms of inputs<br />
(aggregate score: 5.8) and fourth in terms of outputs (7.8). A notable positive input is road density by<br />
land area, in which the UK is a close second to Germany; and among outcomes, the UK has the lowest<br />
road fatality rate—perhaps owing to thoughtful road design, or tighter traffic regulation.<br />
Much of the UK’s transport investment goes into improving the capacity and performance of<br />
existing road and rail networks, in line with the recommendations of the Eddington Transport Study,<br />
a UK government-sponsored report into the future of Britain’s transport infrastructure, completed in<br />
2006. On rail routes, the UK will invest £25bn (€27bn) in capacity enhancements by 2017, including<br />
© The Economist Intelligence Unit Limited 2010 27
<strong>Keeping</strong> traffic flowing<br />
Transport efficiency to 2030<br />
1,300 railway carriages, plus line and station upgrades. On the road network, the government plans<br />
to invest in widening motorways, enabling use of motorway hard shoulders at peak times, and<br />
improving information.<br />
The UK is also investing in new transport infrastructure. In March 2010, the government<br />
announced plans for a £30bn (€33bn) high-speed rail link between London and Scotland. Work on<br />
the route is scheduled to start in 2017, with the first part—between London and Birmingham—due to<br />
open in 2026.<br />
28<br />
© The Economist Intelligence Unit Limited 2010
<strong>Keeping</strong> traffic flowing<br />
Transport efficiency to 2030<br />
Conclusion<br />
In the years to 2030, a number of significant risks are looming to the free movement of goods and<br />
people. While governments claim that ambitious infrastructure investment schemes will ameliorate<br />
congestion problems to 2030, the fact remains that congestion is growing, particularly in urban areas.<br />
A legacy of inadequate funding and poor planning in many countries has slowed mobility and—from<br />
the business perspective, at least—has cast doubts over whether transport efficiency will improve in<br />
the future. Chronic transport bottlenecks for goods and people threaten to slow long-term economic<br />
growth, and impose significant costs on individuals and businesses in the short and medium term.<br />
On the plus side, a benchmarking survey of transport efficiency in ten developed and emerging<br />
economies reveals that policymakers in many countries are aware of the problem and are gearing up to<br />
address it. Developing economies including China, India, Brazil, Poland and South Africa are tackling<br />
years of neglect that have slowed traffic in many countries to a crawl. Developed economies such as<br />
Spain and the UK have also undertaken investment programmes aimed at alleviating congestion.<br />
France and Germany have prioritised high-speed mobility in their spending plans.<br />
While these plans are slowly taking shape, congestion remains a chronic problem, imposing direct<br />
costs on individuals and businesses. Our research leads to several conclusions concerning measures<br />
that companies may take to improve their odds:<br />
• Track the costs. The true cost of transport consists of not only the direct charges for fuel, tolls,<br />
logistics services and the like. There are also myriad hidden costs associated with transport, such as<br />
lost time on clogged roads and border crossings, higher warehousing costs, and disrupted operations<br />
because of late shipments. As transport costs become even more important, companies that track<br />
such costs will be all the better positioned to make informed decisions about locating operations and<br />
configuring supply chains in the future.<br />
• Prioritise logistics. As logistics costs rise, so should the profile of supply chain management within<br />
companies. Our online survey and in-depth interviews show that this is starting to happen already.<br />
Companies that have not already done so should consider overhauling legacy transport practices and<br />
systems, beefing up internal logistics departments, updating technologies to improve supply chain<br />
visibility, and/or making better use of third-party providers.<br />
© The Economist Intelligence Unit Limited 2010 29
<strong>Keeping</strong> traffic flowing<br />
Transport efficiency to 2030<br />
• Adopt green practices. A wide range of practices will be needed to comply with tighter environmental<br />
restrictions on transport, which are widely expected in the decades ahead. These practices include<br />
making fleets more fuel-efficient, adding alternative-fuel vehicles, using intelligent logistics systems<br />
to avoid traffic jams, and adopting technologies to ease freight transfers between road and other<br />
transport modes.<br />
30<br />
© The Economist Intelligence Unit Limited 2010
<strong>Keeping</strong> traffic flowing<br />
Transport efficiency to 2030<br />
Appendix 1<br />
Survey results<br />
Appendix 1: Survey results<br />
Note: The percentages in the charts below may not sum to 100%, owing to rounding.<br />
Do your responsibilities include strategic or operational management of logistics services?<br />
(% respondents)<br />
Yes<br />
No<br />
38<br />
62<br />
To what extent to you agree or disagree with the following statement as it relates to your organisation: "The availability and<br />
quality of transport infrastructure affects where we locate and expand our business."<br />
(% respondents)<br />
Strongly agree<br />
Agree<br />
Neither agree nor disagree<br />
7<br />
Disagree<br />
5<br />
Strongly disagree<br />
5<br />
Don’t know<br />
1<br />
40<br />
43<br />
How does the quality of transport infrastructure in the country in which you are based affect the following aspects of your<br />
company’s business there?<br />
(% respondents)<br />
Increases greatly Increases slightly No effect Decreases slightly Decreases greatly<br />
Cost of business operations<br />
Competitiveness of the business<br />
24<br />
25<br />
41 18 13 5<br />
39 27 8 1<br />
Ability to expand markets<br />
19 45 26<br />
Ability to attract qualified employees<br />
21 35 35<br />
Ability to attract financing or investment<br />
14 29 50 5 3<br />
7 3<br />
7 3<br />
© The Economist Intelligence Unit Limited 2010<br />
31
Appendix 1<br />
Survey results<br />
<strong>Keeping</strong> traffic flowing<br />
Transport efficiency to 2030<br />
Compared to today, how important will transport infrastructure be to your organisation 20 years from now?<br />
(% respondents)<br />
Much more important<br />
Somewhat more important<br />
Equally important<br />
Somewhat less important<br />
5<br />
Much less important<br />
3<br />
Don’t know<br />
1<br />
28<br />
30<br />
32<br />
Over the next five years, which of the following factors pose the greatest risks to your company’s global supply chain?<br />
Select up to three.<br />
(% respondents)<br />
Failure of infrastructure capacity to match demand<br />
Energy costs<br />
Congestion on roads, railways or waterways<br />
Disruptions to, or failure of, suppliers<br />
Structural changes to market supply and demand<br />
Geopolitical instability (wars, revolutions)<br />
Corruption<br />
16<br />
Export restrictions<br />
15<br />
Strike action and industrial disputes<br />
14<br />
Customs red tape<br />
14<br />
Natural disasters<br />
10<br />
20<br />
22<br />
23<br />
38<br />
40<br />
49<br />
Thinking about the country in which you are based, how adequate is the current transport infrastructure to support your<br />
organisation generally?<br />
(% respondents)<br />
Somewhat adequate<br />
Fully adequate<br />
Inadequate<br />
Neither adequate nor inadequate<br />
7<br />
Totally inadequate<br />
4<br />
Don’t know<br />
1<br />
32 © The Economist Intelligence Unit Limited 2010<br />
19<br />
27<br />
43
<strong>Keeping</strong> traffic flowing<br />
Transport efficiency to 2030<br />
Appendix 1<br />
Survey results<br />
Thinking about the country in which you are located, how concerned are you that current transport-infrastructure investment<br />
is not enough to support the long-term growth of your business?<br />
(% respondents)<br />
Very concerned<br />
Somewhat concerned<br />
Neither concerned nor unconcerned<br />
Unconcerned<br />
11<br />
Not at all concerned<br />
7<br />
Don’t know<br />
0<br />
15<br />
19<br />
48<br />
In the country in which you are based, which, if any, of the following are major impediments to upgrading transport<br />
infrastructure? Select up to three.<br />
(% respondents)<br />
Poor governmental effectiveness<br />
Lack of political will or sense of urgency<br />
Politicisation of infrastructure project priorities<br />
Lack of public funds<br />
Corruption or misuse of funds earmarked for infrastructure<br />
Lack of skills, knowledge or training of officials in this area<br />
14<br />
Poor creditworthiness of public authorities<br />
11<br />
Other, please specify<br />
3<br />
None of the above, there are no impediments<br />
11<br />
Don’t know<br />
0<br />
31<br />
37<br />
39<br />
40<br />
46<br />
© The Economist Intelligence Unit Limited 2010<br />
33
Appendix 1<br />
Survey results<br />
<strong>Keeping</strong> traffic flowing<br />
Transport efficiency to 2030<br />
In the country in which you are based, which, if any, of the following factors would produce the greatest infrastructure<br />
improvement? Select up to three.<br />
(% respondents)<br />
More funds for transport infrastructure<br />
Greater use of public-private partnerships for infrastructure<br />
More transparency in public spending on infrastructure<br />
More transparency in project selection<br />
Better training of public sector officials<br />
Not applicable—no need for improvement<br />
5<br />
Other, please specify<br />
5<br />
Don’t know<br />
2<br />
28<br />
35<br />
48<br />
51<br />
51<br />
In the country in which you are based, which aspect of transport infrastructure, if any, will be most in need of expansion or<br />
upgrading within the next five years? Select up to three.<br />
(% respondents)<br />
Roads and highways<br />
Railways<br />
Public transit in urban areas<br />
Public transport between cities<br />
Intermodal freight facilities (eg, to transfer freight from road to rail)<br />
Seaports<br />
20<br />
Intermodal passenger facilities<br />
14<br />
Cycle ways in urban areas<br />
9<br />
Inland waterways<br />
6<br />
None of the above, infrastructure will be adequate<br />
2<br />
Other, please specify<br />
2<br />
Don’t know<br />
1<br />
25<br />
30<br />
42<br />
45<br />
51<br />
34 © The Economist Intelligence Unit Limited 2010
<strong>Keeping</strong> traffic flowing<br />
Transport efficiency to 2030<br />
Appendix 1<br />
Survey results<br />
In the country in which you are based, which aspect of transport infrastructure, if any, will be most in need of expansion or<br />
upgrading within the next 20 years? Select up to three.<br />
(% respondents)<br />
Roads and highways<br />
Railways<br />
Public transit in urban areas<br />
Public transport between cities<br />
Intermodal freight facilities (eg, to transfer freight from road to rail)<br />
Seaports<br />
19<br />
Intermodal passenger facilities<br />
15<br />
Cycle ways in urban areas<br />
11<br />
Inland waterways<br />
10<br />
None of the above, infrastructure will be adequate<br />
2<br />
Other, please specify<br />
3<br />
Don’t know<br />
3<br />
23<br />
31<br />
39<br />
39<br />
48<br />
Do you agree or disagree with the following statement, with reference to the country in which you are based: "Government<br />
should work more closely with private industry to finance transport infrastructure improvements."<br />
(% respondents)<br />
Strongly agree<br />
Agree<br />
Neither agree nor disagree<br />
Disagree<br />
5<br />
Strongly disagree<br />
2<br />
Don’t know<br />
1<br />
12<br />
38<br />
42<br />
© The Economist Intelligence Unit Limited 2010<br />
35
Appendix 1<br />
Survey results<br />
<strong>Keeping</strong> traffic flowing<br />
Transport efficiency to 2030<br />
In your opinion, which of the following system upgrades or policies would be most useful to improve logistics networks?<br />
Select up to three.<br />
(% respondents)<br />
Intelligent Logistics Systems (eg smart telematics, vehicle-to-vehicle communication, vehicle-to-hub communications) aimed at using available<br />
transport capacity more efficiently<br />
New IT systems allowing smarter vehicle navigation to avoid bottlenecks<br />
More transfer points allowing freight to shift to less-congested modes<br />
Remote sensing technologies to allow automatic cargo forwarding<br />
22<br />
Offering incentives to companies to source closer to markets<br />
19<br />
More transfer points allowing passengers to shift to less-congested modes<br />
16<br />
Systems granting priority to passenger vehicles at intersections<br />
13<br />
Systems granting priority to large or heavy vehicles at intersections<br />
11<br />
Other, please specify<br />
2<br />
None of the above, no improvements needed<br />
2<br />
Don’t know<br />
5<br />
35<br />
47<br />
63<br />
How likely do you consider each of the following "green logistics" measures to become law in your country within the next five<br />
years?<br />
(% respondents)<br />
Very likely/Already determined by law Likely Unlikely Very unlikely Don’t know<br />
Stricter emissions limits for vehicles<br />
Eco driving techniques to reduce per-kilometre fuel use<br />
11<br />
41 45 7 3 3<br />
41 33 12 3<br />
Signalling systems granting priority to certain types of vehicles<br />
10 29 42 13 7<br />
Introduction of Intelligent Logistic Systems (ILS) including vehicle-to-vehicle and vehicle-to-hub communication<br />
13 43 24 12 8<br />
In your opinion, how will your company change its global purchasing strategy over the next five years?<br />
(% respondents)<br />
Source closer to markets to minimise transport requirements<br />
Shift purchasing to lowest-cost countries regardless of distances involved<br />
Other, please specify<br />
2<br />
No changes envisioned<br />
Don’t know<br />
6<br />
22<br />
30<br />
40<br />
36 © The Economist Intelligence Unit Limited 2010
<strong>Keeping</strong> traffic flowing<br />
Transport efficiency to 2030<br />
Appendix 1<br />
Survey results<br />
How strongly do you agree or disagree with the following statements?<br />
(% respondents)<br />
Agree strongly Agree Neutral Disagree Disagree strongly Don’t know/Not applicable<br />
We see a growing professionalisation of our logistics function<br />
14<br />
Our logistics function focuses on value rather than simple cost reduction<br />
46<br />
26 4 1<br />
9<br />
12<br />
We try to spread logistics expertise widely throughout the organisation<br />
46<br />
22<br />
11 1<br />
8<br />
7<br />
31<br />
33<br />
17 2<br />
10<br />
Employees company-wide are trained to make good logistics decisions<br />
7<br />
30<br />
30<br />
22 4<br />
7<br />
Supply chain management is a good springboard for career advancement<br />
13<br />
37<br />
25<br />
13 3<br />
9<br />
Which of the following measures does your company use in its supply chain management? Select all that apply.<br />
(% respondents)<br />
Joint logistics planning with suppliers and customers<br />
Tracking supply chain breakdowns and lessons learnt<br />
Scenario-building or crisis-simulation to deal with bottlenecks<br />
Increasing inventories to hedge against risks of supply chain breakdowns<br />
Collaborating with competitors on transport solutions<br />
20<br />
Collaborating with local governments on logistics planning<br />
16<br />
Other, please specify<br />
2<br />
None, we take no such steps<br />
11<br />
Don’t know<br />
6<br />
26<br />
28<br />
49<br />
49<br />
What is the main focus of your company’s efforts to improve logistics?<br />
(% respondents)<br />
Combination of internal and external process management<br />
Managing internal logistics processes<br />
22<br />
Managing the logistics processes of suppliers and other partners<br />
13<br />
Other, please specify<br />
1<br />
None, we do not focus on improving our logistics function<br />
9<br />
Don’t know<br />
4<br />
51<br />
© The Economist Intelligence Unit Limited 2010<br />
37
Appendix 1<br />
Survey results<br />
<strong>Keeping</strong> traffic flowing<br />
Transport efficiency to 2030<br />
What major changes or trends do you foresee in intra- and inter-company logistics within the next 10 years? Select up to three.<br />
(% respondents)<br />
Wider use of intelligent IT-systems and networks in hubs and vehicles<br />
Growth of multi-modal transport<br />
Road access to urban areas limited to certain technologies like hybrid or electric vehicles<br />
35<br />
Increased cooperation between competing logistic providers<br />
30<br />
Other, please specify<br />
2<br />
None, we expect to continue using current logistics systems and methods<br />
9<br />
43<br />
66<br />
Who is primarily responsible for setting supply chain management strategy in your organisation?<br />
(% respondents)<br />
Chief logistics officer<br />
<strong>Traffic</strong> managers for individual business units<br />
6<br />
Supply chain director<br />
Head of business unit<br />
Chief operating officer<br />
CFO/Treasurer/Comptroller<br />
5<br />
CEO/President/Managing director<br />
Other, please specify<br />
Don’t know<br />
5<br />
7<br />
13<br />
14<br />
14<br />
18<br />
19<br />
Which are the biggest barriers to a greater strategic impact for supply chain management within your organisation?<br />
Select up to three.<br />
(% respondents)<br />
Other functions lack understanding of how logistics can be used strategically<br />
Logistics staff lack understanding of the wider business<br />
The logistics function lacks a unified voice or strong leader<br />
26<br />
Senior management lacks understanding of how logistics expertise can be used strategically<br />
26<br />
Logistics function is underfunded/overstretched<br />
22<br />
Other, please specify<br />
3<br />
Don’t know<br />
15<br />
35<br />
44<br />
38 © The Economist Intelligence Unit Limited 2010
<strong>Keeping</strong> traffic flowing<br />
Transport efficiency to 2030<br />
Appendix 1<br />
Survey results<br />
In which country are you personally located?<br />
(% respondents)<br />
United States of America<br />
India<br />
United Kingdom<br />
Canada<br />
Singapore<br />
4<br />
Australia<br />
4<br />
Germany<br />
3<br />
Hong Kong<br />
3<br />
China<br />
2<br />
Philippines<br />
2<br />
Spain<br />
2<br />
Switzerland<br />
2<br />
Brazil<br />
2<br />
France<br />
2<br />
Malaysia<br />
2<br />
Turkey<br />
2<br />
Others<br />
5<br />
10<br />
11<br />
19<br />
26<br />
In which region are you personally based?<br />
(% respondents)<br />
North America<br />
Asia-Pacific<br />
Western Europe<br />
Middle East and Africa<br />
5<br />
Latin America<br />
4<br />
Eastern Europe<br />
3<br />
27<br />
30<br />
31<br />
© The Economist Intelligence Unit Limited 2010<br />
39
Appendix 1<br />
Survey results<br />
<strong>Keeping</strong> traffic flowing<br />
Transport efficiency to 2030<br />
Which of the following titles best describes your role?<br />
(% respondents)<br />
Board member<br />
3<br />
CEO/President/Managing director<br />
CFO/Treasurer/Comptroller<br />
CIO/Technology director<br />
Other C-level executive<br />
SVP/VP/Director<br />
Head of business unit<br />
Head of department<br />
Manager<br />
Other<br />
2<br />
6<br />
7<br />
7<br />
7<br />
12<br />
14<br />
18<br />
24<br />
What are your main functional roles? Choose up to three.<br />
(% respondents)<br />
General management<br />
Strategy and business development<br />
Finance<br />
Logistics/Supply chain management<br />
IT<br />
Marketing and sales<br />
Operations<br />
Customer service<br />
Risk management<br />
Information and research<br />
5<br />
Human resources<br />
4<br />
Legal<br />
2<br />
Production<br />
2<br />
Other, please specify<br />
4<br />
10<br />
12<br />
15<br />
16<br />
17<br />
23<br />
29<br />
31<br />
36<br />
40 © The Economist Intelligence Unit Limited 2010
<strong>Keeping</strong> traffic flowing<br />
Transport efficiency to 2030<br />
Appendix 1<br />
Survey results<br />
What is your primary industry?<br />
(% respondents)<br />
Agriculture and agribusiness<br />
2<br />
Automotive<br />
1<br />
Chemicals<br />
Construction and real estate<br />
3<br />
Consumer goods (excluding Retail)<br />
Defence and aerospace<br />
1<br />
Education<br />
1<br />
Energy and natural resources<br />
Entertainment, media and publishing<br />
0<br />
Financial services: banking<br />
Financial services: insurance<br />
4<br />
Financial services: other<br />
Government/Public sector<br />
4<br />
Healthcare, pharmaceuticals and biotechnology<br />
4<br />
IT and Technology<br />
Logistics and distribution<br />
3<br />
Manufacturing<br />
Professional services: accounting, tax and audit<br />
0<br />
Professional services: other<br />
Retailing<br />
3<br />
Telecoms<br />
4<br />
Transport<br />
3<br />
Travel and tourism<br />
1<br />
5<br />
6<br />
6<br />
7<br />
8<br />
9<br />
11<br />
13<br />
© The Economist Intelligence Unit Limited 2010<br />
41
Appendix 1<br />
Survey results<br />
<strong>Keeping</strong> traffic flowing<br />
Transport efficiency to 2030<br />
What are your company's annual global revenues in US dollars?<br />
(% respondents)<br />
$500m or less<br />
$500m to $1bn<br />
$1bn to $5bn<br />
$5bn to $10bn<br />
$10bn or more<br />
9<br />
10<br />
14<br />
25<br />
43<br />
42 © The Economist Intelligence Unit Limited 2010
<strong>Keeping</strong> traffic flowing<br />
Transport efficiency to 2030<br />
Appendix 2<br />
The Transport Efficiency<br />
Index: Methodology<br />
Appendix 2: The Transport Efficiency Index:<br />
Methodology<br />
What was measured<br />
The Transport Efficiency Index (TEI) aims to measure the efficiency of national road and rail transport<br />
systems. It distinguishes between factors which contribute to the efficiency of national transport<br />
systems—the inputs—and the efficiency of the systems itself—the outputs. The resulting two rankings,<br />
one for inputs and one for outputs, score ten countries across a total of six categories and 32 individual<br />
indicators.<br />
For the purpose of this study, transport efficiency is defined as a measure of the cost in terms of<br />
money, time, or energy to move freight and/or passengers between two points within a national<br />
transport system. Although the TEI addresses certain aspects of transport sustainability, mainly on<br />
the environmental side, it makes no attempt to cover the full range of issues related to sustainability.<br />
Instead, it is limited to studying the factors contributing to transport efficiency.<br />
The TEI distinguishes between input and output variables for two reasons. First, it is standard<br />
practice to keep input and output measures separate in composite indicators; and second, this allows<br />
stakeholders such as governments, interests groups, non-governmental organisations (NGOs), among<br />
others to better pinpoint where improvement is needed.<br />
The input ranking scores countries along variables that contribute to the overall performance<br />
of national transport systems, such as the density of roads or railways, the number of vehicles,<br />
the amount of infrastructure investments, among others. The output ranking measures the actual<br />
performance of the transport systems in terms of mobility, safety and environmental impact.<br />
Although it was not the aim of this study to prove a causal link between the inputs and the outputs<br />
of transport efficiency, the results show a strong relationship between scoring well on the input and<br />
the output side. The index allows the user to assign different weights to each indicator and category,<br />
thereby assigning a higher importance to one indicator/category over another. The default setting<br />
applies even weights.<br />
Which indicators were used<br />
Of the 32 indicators, 28 are quantitative and four are qualitative in nature, that is, they are derived<br />
from ratings by analysts and experts on the basis of objective criteria. All 28 quantitative indicators<br />
as well as two of the qualitative ones (the quality of trade and transport-related infrastructure, and<br />
the timeliness of shipments) are based on data from international organisations, including the World<br />
Bank, the International Energy Agency, the International Road Federation, the International Union of<br />
Railways and the World Resources Institute. National and other international sources were consulted<br />
as well, both to verify the data and to close gaps. Most data are for 2007 or 2008.<br />
Data for the remaining two qualitative indicators—the Economist Intelligence Unit road rating and<br />
the Economist Intelligence Unit rail rating—consist of scores assigned by Economist Intelligence Unit<br />
country analysts to their countries of expertise.<br />
© The Economist Intelligence Unit Limited 2010<br />
43
Appendix 2<br />
The Transport Efficiency<br />
Index: Methodology<br />
<strong>Keeping</strong> traffic flowing<br />
Transport efficiency to 2030<br />
The following is the list of indicators in the TEI:<br />
TRANSPORT EFFICIENCY INPUTS<br />
Infrastructure indicators<br />
• Road density by land area (km of roads divided by land area in sq km)<br />
• Road density by population (km/ ‘000 population)<br />
• Proportion of paved roads (% of total)<br />
• Motorways as % of total road network<br />
• Railway density by land area (km/sq km)<br />
• Railway density by population (km/ ‘000)<br />
• Proportion of electrified railway (% of total network)<br />
• Proportion of double-track railway (% of total network)<br />
• Proportion of high-speed rail network (% of total network)<br />
• Quality of trade and transport-related infrastructure (rating scale of 1-5)<br />
Vehicle stock indicators<br />
• Passenger vehicles per 1,000 population<br />
• Passenger vehicles per km of road<br />
• Freight vehicles per 1,000 population<br />
• Freight vehicles per km of road<br />
• Rail passenger transport stock per 1,000 population<br />
• Rail passenger transport stock per km of track<br />
• Rail freight transport stock per 1,000 population<br />
• Rail freight transport stock per km of track<br />
Policies indicators<br />
• Investment in road infrastructure (% of government expenditure)<br />
• Investment in rail infrastructure (% of government expenditure)<br />
• Gasoline (petrol) price in US$ per litre<br />
• Diesel fuel price in US$ per litre<br />
• Economist Intelligence Unit road rating (quality of roads)<br />
• Economist Intelligence Unit rail rating (quality of railways)<br />
44 © The Economist Intelligence Unit Limited 2010
<strong>Keeping</strong> traffic flowing<br />
Transport efficiency to 2030<br />
Appendix 2<br />
The Transport Efficiency<br />
Index: Methodology<br />
TRANSPORT EFFICIENCY OUTPUTS<br />
Mobility indicators<br />
• <strong>Traffic</strong> volume (m vehicle-km divided by road network in km)<br />
• High-speed rail transport (m passenger-km/high-speed network km)<br />
• Timeliness of shipments (rating scale of 1-5)<br />
Safety indicators<br />
• Road accidents with injuries (accidents divided by m vehicle-km)<br />
• Road fatalities (fatalities divided by millions of vehicle-km)<br />
Environment indicators<br />
• Transport sector fuel efficiency (tonnes of oil equivalent per vehicle)<br />
• PM10 emissions (micrograms of particulate matter per cu metre)<br />
• CO2 emissions from road (total CO2 per vehicle)<br />
How the index was built<br />
Each indicator has received a score on a scale of 0-10. The majority of quantitative indicators have<br />
been normalised on the basis of:<br />
x = (x – Min (x)) / (Max (x) – Min (x))<br />
where Min (x) and Max (x) are respectively the lowest and highest values in the ten countries for<br />
any given indicator. The normalised value is then transformed from a 0-1 value to a 0-10 score to<br />
make it comparable with other indicators.<br />
The remaining quantitative indicators have been normalised using a 0-max calculation, where the<br />
same equation as above is used, but Min (x) is replaced by 0. This technique was used for indicators<br />
where values above 0 can generally be considered to be positive.<br />
The qualitative indicators are based on ratings that use a 1 to 5 scale. Since the index uses a 0<br />
to 10 scale, these ratings were converted accordingly. So, for example, a country that had a rating<br />
of 5 in the Economist Intelligence Unit road rating received a score of 10 points for that indicator<br />
in the Transport Efficiency Index, and a country with a rating of 1 scored 0 points in the Transport<br />
Efficiency Index.<br />
The index construction took place in two steps. First, the category scores were calculated by<br />
summing the individual indicator scores on a scale of 0 to 10. For this, each indicator was assigned<br />
a weighting, which reflects the importance of that indicator within that category. In the case of the<br />
Transport Efficiency Index, this weighting is equal across all indicators within each category. In the<br />
second step, the category scores were aggregated to create each country’s index score on a scale of<br />
0 to 10. Similar to the calculations in the first step, each category was assigned a weighting—in this<br />
case, 33.3% for each of the three categories of inputs, and 33.3% for each of the three categories<br />
of outputs.<br />
© The Economist Intelligence Unit Limited 2010<br />
45
While every effort has been taken to verify the accuracy<br />
of this information, neither The Economist Intelligence<br />
Unit Ltd. nor the sponsor of this report can accept any<br />
responsibility or liability for reliance by any person on<br />
this white paper or any of the information, opinions or<br />
conclusions set out in this white paper.<br />
Cover image - © xxx/xxx
LONDON<br />
26 Red Lion Square<br />
London<br />
WC1R 4HQ<br />
United Kingdom<br />
Tel: (44.20) 7576 8000<br />
Fax: (44.20) 7576 8500<br />
E-mail: london@eiu.com<br />
NEW YORK<br />
750 Third Avenue<br />
5th Floor<br />
New York, NY 10017<br />
United States<br />
Tel: (1.212) 554 0600<br />
Fax: (1.212) 586 1181/2<br />
E-mail: newyork@eiu.com<br />
HONG KONG<br />
6001, Central Plaza<br />
18 Harbour Road<br />
Wanchai<br />
Hong Kong<br />
Tel: (852) 2585 3888<br />
Fax: (852) 2802 7638<br />
E-mail: hongkong@eiu.com<br />
GENEVA<br />
Boulevard des Tranchées 16<br />
1206 Geneva<br />
Switzerland<br />
Tel: (41) 22 566 2470<br />
Fax: (41) 22 346 93 47<br />
E-mail: geneva@eiu.com<br />
FRANKFURT<br />
Bockenheimer Landstr. 51-53<br />
60325 Frankfurt am Main<br />
Germany<br />
Tel: (49) 69 7171 880<br />
E-mail: frankfurt@eiu.com