Volume I - Finance - Government of Newfoundland and Labrador
Volume I - Finance - Government of Newfoundland and Labrador
Volume I - Finance - Government of Newfoundland and Labrador

You also want an ePaper? Increase the reach of your titles
YUMPU automatically turns print PDFs into web optimized ePapers that Google loves.
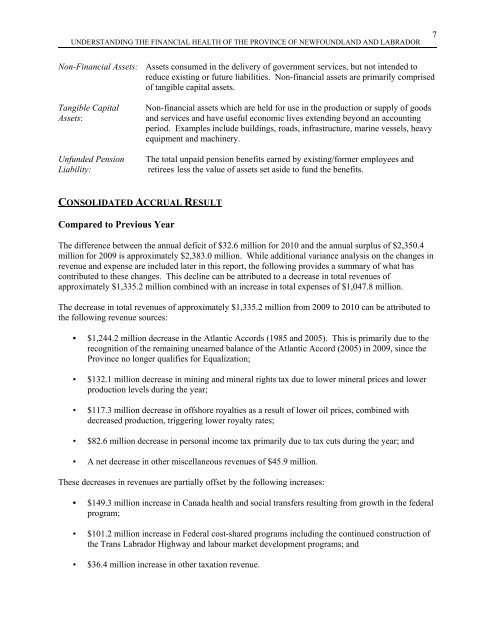
UNDERSTANDING THE FINANCIAL HEALTH OF THE PROVINCE OF NEWFOUNDLAND AND LABRADOR<br />
7<br />
Non-Financial Assets: Assets consumed in the delivery <strong>of</strong> government services, but not intended to<br />
reduce existing or future liabilities. Non-financial assets are primarily comprised<br />
<strong>of</strong> tangible capital assets.<br />
Tangible Capital<br />
Assets:<br />
Non-financial assets which are held for use in the production or supply <strong>of</strong> goods<br />
<strong>and</strong> services <strong>and</strong> have useful economic lives extending beyond an accounting<br />
period. Examples include buildings, roads, infrastructure, marine vessels, heavy<br />
equipment <strong>and</strong> machinery.<br />
Unfunded Pension The total unpaid pension benefits earned by existing/former employees <strong>and</strong><br />
Liability: retirees less the value <strong>of</strong> assets set aside to fund the benefits.<br />
CONSOLIDATED ACCRUAL RESULT<br />
Compared to Previous Year<br />
The difference between the annual deficit <strong>of</strong> $32.6 million for 2010 <strong>and</strong> the annual surplus <strong>of</strong> $2,350.4<br />
million for 2009 is approximately $2,383.0 million. While additional variance analysis on the changes in<br />
revenue <strong>and</strong> expense are included later in this report, the following provides a summary <strong>of</strong> what has<br />
contributed to these changes. This decline can be attributed to a decrease in total revenues <strong>of</strong><br />
approximately $1,335.2 million combined with an increase in total expenses <strong>of</strong> $1,047.8 million.<br />
The decrease in total revenues <strong>of</strong> approximately $1,335.2 million from 2009 to 2010 can be attributed to<br />
the following revenue sources:<br />
• $1,244.2 million decrease in the Atlantic Accords (1985 <strong>and</strong> 2005). This is primarily due to the<br />
recognition <strong>of</strong> the remaining unearned balance <strong>of</strong> the Atlantic Accord (2005) in 2009, since the<br />
Province no longer qualifies for Equalization;<br />
• $132.1 million decrease in mining <strong>and</strong> mineral rights tax due to lower mineral prices <strong>and</strong> lower<br />
production levels during the year;<br />
• $117.3 million decrease in <strong>of</strong>fshore royalties as a result <strong>of</strong> lower oil prices, combined with<br />
decreased production, triggering lower royalty rates;<br />
• $82.6 million decrease in personal income tax primarily due to tax cuts during the year; <strong>and</strong><br />
• A net decrease in other miscellaneous revenues <strong>of</strong> $45.9 million.<br />
These decreases in revenues are partially <strong>of</strong>fset by the following increases:<br />
• $149.3 million increase in Canada health <strong>and</strong> social transfers resulting from growth in the federal<br />
program;<br />
• $101.2 million increase in Federal cost-shared programs including the continued construction <strong>of</strong><br />
the Trans <strong>Labrador</strong> Highway <strong>and</strong> labour market development programs; <strong>and</strong><br />
• $36.4 million increase in other taxation revenue.