Volume I - Finance - Government of Newfoundland and Labrador
Volume I - Finance - Government of Newfoundland and Labrador
Volume I - Finance - Government of Newfoundland and Labrador

You also want an ePaper? Increase the reach of your titles
YUMPU automatically turns print PDFs into web optimized ePapers that Google loves.
22<br />
UNDERSTANDING THE FINANCIAL HEALTH OF THE PROVINCE OF NEWFOUNDLAND AND LABRADOR<br />
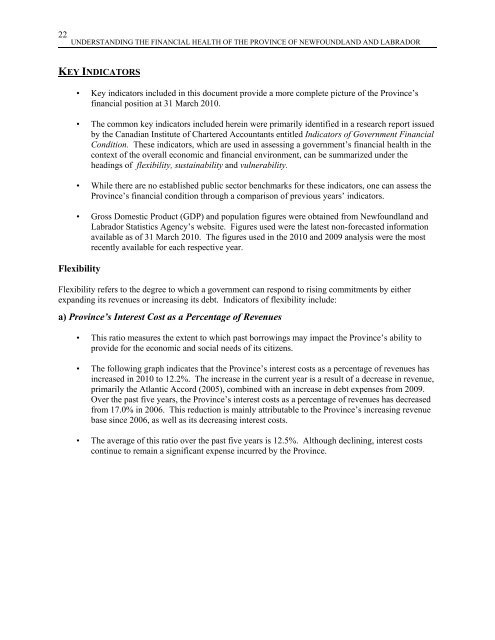
KEY INDICATORS<br />
• Key indicators included in this document provide a more complete picture <strong>of</strong> the Province’s<br />
financial position at 31 March 2010.<br />
• The common key indicators included herein were primarily identified in a research report issued<br />
by the Canadian Institute <strong>of</strong> Chartered Accountants entitled Indicators <strong>of</strong> <strong>Government</strong> Financial<br />
Condition. These indicators, which are used in assessing a government’s financial health in the<br />
context <strong>of</strong> the overall economic <strong>and</strong> financial environment, can be summarized under the<br />
headings <strong>of</strong> flexibility, sustainability <strong>and</strong> vulnerability.<br />
• While there are no established public sector benchmarks for these indicators, one can assess the<br />
Province’s financial condition through a comparison <strong>of</strong> previous years’ indicators.<br />
• Gross Domestic Product (GDP) <strong>and</strong> population figures were obtained from <strong>Newfoundl<strong>and</strong></strong> <strong>and</strong><br />
<strong>Labrador</strong> Statistics Agency’s website. Figures used were the latest non-forecasted information<br />
available as <strong>of</strong> 31 March 2010. The figures used in the 2010 <strong>and</strong> 2009 analysis were the most<br />
recently available for each respective year.<br />
Flexibility<br />
Flexibility refers to the degree to which a government can respond to rising commitments by either<br />
exp<strong>and</strong>ing its revenues or increasing its debt. Indicators <strong>of</strong> flexibility include:<br />
a) Province’s Interest Cost as a Percentage <strong>of</strong> Revenues<br />
• This ratio measures the extent to which past borrowings may impact the Province’s ability to<br />
provide for the economic <strong>and</strong> social needs <strong>of</strong> its citizens.<br />
• The following graph indicates that the Province’s interest costs as a percentage <strong>of</strong> revenues has<br />
increased in 2010 to 12.2%. The increase in the current year is a result <strong>of</strong> a decrease in revenue,<br />
primarily the Atlantic Accord (2005), combined with an increase in debt expenses from 2009.<br />
Over the past five years, the Province’s interest costs as a percentage <strong>of</strong> revenues has decreased<br />
from 17.0% in 2006. This reduction is mainly attributable to the Province’s increasing revenue<br />
base since 2006, as well as its decreasing interest costs.<br />
• The average <strong>of</strong> this ratio over the past five years is 12.5%. Although declining, interest costs<br />
continue to remain a significant expense incurred by the Province.