Volume I - Finance - Government of Newfoundland and Labrador
Volume I - Finance - Government of Newfoundland and Labrador
Volume I - Finance - Government of Newfoundland and Labrador

You also want an ePaper? Increase the reach of your titles
YUMPU automatically turns print PDFs into web optimized ePapers that Google loves.
26<br />
UNDERSTANDING THE FINANCIAL HEALTH OF THE PROVINCE OF NEWFOUNDLAND AND LABRADOR<br />
24<br />
Percentage<br />
16<br />
15.8<br />
14.9<br />
12.4<br />
15.4<br />
13.2<br />
8<br />
0<br />
2006 2007 2008 2009 2010<br />
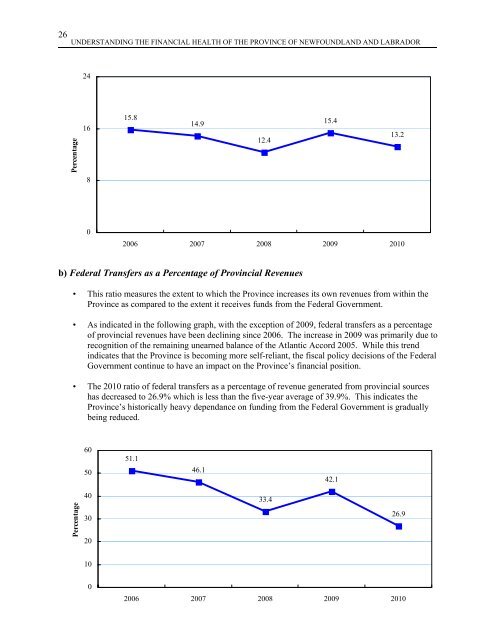
b) Federal Transfers as a Percentage <strong>of</strong> Provincial Revenues<br />
• This ratio measures the extent to which the Province increases its own revenues from within the<br />
Province as compared to the extent it receives funds from the Federal <strong>Government</strong>.<br />
• As indicated in the following graph, with the exception <strong>of</strong> 2009, federal transfers as a percentage<br />
<strong>of</strong> provincial revenues have been declining since 2006. The increase in 2009 was primarily due to<br />
recognition <strong>of</strong> the remaining unearned balance <strong>of</strong> the Atlantic Accord 2005. While this trend<br />
indicates that the Province is becoming more self-reliant, the fiscal policy decisions <strong>of</strong> the Federal<br />
<strong>Government</strong> continue to have an impact on the Province’s financial position.<br />
• The 2010 ratio <strong>of</strong> federal transfers as a percentage <strong>of</strong> revenue generated from provincial sources<br />
has decreased to 26.9% which is less than the five-year average <strong>of</strong> 39.9%. This indicates the<br />
Province’s historically heavy dependance on funding from the Federal <strong>Government</strong> is gradually<br />
being reduced.<br />
60<br />
50<br />
51.1<br />
46.1<br />
42.1<br />
Percentage<br />
40<br />
30<br />
20<br />
33.4<br />
26.9<br />
10<br />
0<br />
2006 2007 2008 2009 2010