2001â2002 - California Sea Grant - UC San Diego
2001â2002 - California Sea Grant - UC San Diego
2001â2002 - California Sea Grant - UC San Diego

Create successful ePaper yourself
Turn your PDF publications into a flip-book with our unique Google optimized e-Paper software.
Sonograms of the <strong>Sea</strong>floor<br />
On land, wildlife habitats are<br />
usually, and obviously, defined by<br />
flora, climate and altitude. In the inky depths<br />
of the sea, habitats are delineated quite<br />
differently—by substrate type, water depth<br />
and seafloor geomorphology.<br />
Since seawater covers these habitat areas,<br />
how do scientists “see” what is on the bottom?<br />
Right now, techniques rely on bouncing<br />
sound waves off the seafloor and “listening”<br />
to their echoes.<br />
The modern techniques for imaging the<br />
seafloor began in the early 1990s in Monterey<br />
Bay National Marine <strong>San</strong>ctuary, as NOAA,<br />
NOAA Fisheries, the U.S. Geological Survey<br />
and others began characterizing the complex<br />
canyon topography and associated rockfish<br />
habitats at the sanctuary.<br />
In the mid-1990s, <strong>Sea</strong> <strong>Grant</strong>, the<br />
Monterey Bay National Marine<br />
<strong>San</strong>ctuary and the <strong>California</strong><br />
Department of Fish and Game supported the<br />
newly formed Center for Habitat Studies at<br />
Moss Landing Marine Laboratories to<br />
characterize fish habitats around the Big<br />
Creek Ecological Reserve. By the late 1990s,<br />
the <strong>Sea</strong>floor Mapping Laboratory of <strong>California</strong><br />
State University was established.<br />
More recently <strong>Sea</strong> <strong>Grant</strong>, in collaboration<br />
with the <strong>California</strong> Department of Fish and<br />
Game, has funded scientists to digitize and<br />
interpret geophysical data collected by oil<br />
companies, data that up until recently were<br />
proprietary and not available for<br />
scientific study.<br />
Why are the maps of use? Many<br />
reasons. Top among them: the<br />
<strong>California</strong> Department of Fish and<br />
Game Commission in September of<br />
2002 adopted the state’s first<br />
Nearshore Fisheries Management<br />
Plan for 19 species of finfish, most<br />
of them rockfish. The maps that are<br />
being produced will help resource<br />
managers identify areas that<br />
support these species. There is also<br />
a federal mandate to protect<br />
“essential fish habitats.”<br />
36°51′<br />
36°50′<br />
121°58′ 121°57′<br />
121°58′<br />
121°57′<br />
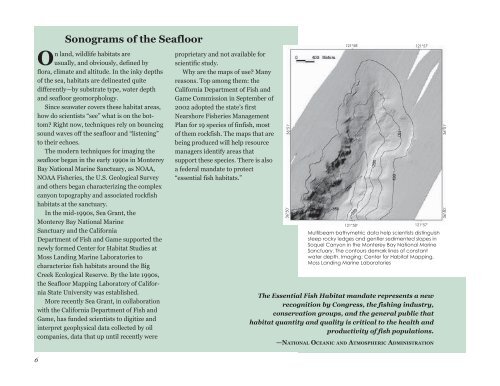
Multibeam bathymetric data help scientists distinguish<br />
steep rocky ledges and gentler sedimented slopes in<br />
Soquel Canyon in the Monterey Bay National Marine<br />
<strong>San</strong>ctuary. The contours demark lines of constant<br />
water depth. Imaging: Center for Habitat Mapping,<br />
Moss Landing Marine Laboratories<br />
The Essential Fish Habitat mandate represents a new<br />
recognition by Congress, the fishing industry,<br />
conservation groups, and the general public that<br />
habitat quantity and quality is critical to the health and<br />
productivity of fish populations.<br />
—NATIONAL OCEANIC AND ATMOSPHERIC ADMINISTRATION<br />
36°50′ 36°51′<br />
6