Transactions A.S.M.E.
Transactions A.S.M.E.
Transactions A.S.M.E.

Create successful ePaper yourself
Turn your PDF publications into a flip-book with our unique Google optimized e-Paper software.
<strong>Transactions</strong><br />
of the<br />
A.S.M.E.<br />
Turbine Discharge Metering at the Safe Harbor Hydroelectric Development . . . .<br />
................................................................................................................... J. M. Mousson 369<br />
Speed Regulation of Kaplan T u r b in e s ..........................................................J. D. Scoville 38 5<br />
Development of the Automatic Adjustable-Blade-Type Propeller T u r b i n e ....................<br />
.......................................................................................... ............................ R. V. Terry 395<br />
Production of Seamless Tubes by Combined Effects of Cross-Rolling and Guide Disks<br />
............................................................................................................................ W. T rinks 4 1 1<br />
The Flow of Saturated Water Through Throttling O r i f i c e s ...........................................<br />
................................................................................. M. W. Benjamin and J. G. M iller 4 19<br />
Train Acceleration With Steam Locomotives..................................................... L. B. Jones 4 3 1<br />
Discharge Coefficients of Long-Radius Flow Nozzles When Used With Pipe-Wall<br />
Pressure T a p s ...................................... H. S. Bean, S. R. Beitler, and R. E. Sprenkle 439<br />
Remarks on the Analogy Between Heat Transfer and Momentum Transfer...................<br />
.................................................... L. M. K. Boelter, R. C. Martinetli, and Finn Jonassen 447<br />
Effect of Ambient Temperatures on the Coefficients of Venturi Meters . W. S. Pardoe 4 5 7<br />
JULY, 1941<br />
VOL. 63, NO. 5
<strong>Transactions</strong><br />
of The American Society of Mechanical Engineers<br />
Published on the tenth of every month, except March, June, September, and December<br />
OFFICERS OF THE SOCIETY:<br />
W il l ia m A . H a n l e y , President<br />
W . D . E n n i s , Treasurer<br />
C . E . D a v ie s, Secretary<br />
COMMITTEE ON p u b l i c a t i o n s :<br />
C . B. P e c k , Chairman<br />
F . L . B r a d l e y A . R . St e v e n s o n , J r .<br />
C . R . So d e r b e r g<br />
G e o r g e A . St e t s o n , Editor<br />
E . J . K ates<br />
ADVISORY MEMBERS OF THE COMMITTEE ON PUBLICATIONS:<br />
W . L . D u d l e y , Se a t t l e , W a s h. N . C. E b a u g h , G a in e s v il l e , F l a . O. B . Sc h ie r , 2 n d , N e w Y o r k , N . Y.<br />
Junior Members<br />
C . C . K ir b y , N b w Y o r k .'N . Y. F r a n k l in H . F o w l e r , J r ., C a l d w e l l , N .J .<br />
Published monthly by The American Society o f Mechanical Engineers. Publication office at 20th and Northampton Streets, Easton, Pa. The editorial<br />
department located at the headquarters o f the Society, 29 W est Thirty-Ninth Street, N ew York, N . Y. Cable address, "Dynamic,” N ew York. Price $1.50<br />
a copy, $12.00 a year; to members and affiliates, $1.00 a copy, $7.50 a year. Changes o f address must be received at Society headquarters two weeks before<br />
they are to be effective on the m ailing list. Please send old as w ell as new address.. . . By-Law: The Society shall not be responsible for statements or opinions<br />
advanced in papers or . . . . printed in its publications (B13, Par. 4 )___ Entered as second-class matter March 2, 1928, at the Post Office at Easton, Pa.,<br />
under the Act o f August 24, 1 9 1 2 ... . Copyrighted, 1941, by The American Society of M echanical Engineers.
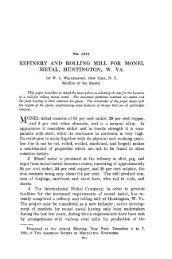
T urbine D ischarge M etering a t the Safe<br />
H a rb o r H ydroelectric D evelopm ent<br />
B y J. M. M O USSO N,1 BALTIM O RE, M D .<br />
T h is paper d isc u sse s th e s u ita b ility , c a lib r a tio n , a n d<br />
r elia b ility o f c erta in p ie zo m e ter sy s te m s in sta lle d in lo w -<br />
head u n its o f h ig h ca p a c ity . A n a c c o u n t is a lso g iv en o f a<br />
research t o d e te rm in e a n d d evelop a su ita b le ty p e o f flow <br />
m eter to be op erated b y th e d ifferen tia l pressu re from th e se<br />
p iezo m eter sy s te m s for c o n tin u o u s in te g r a tio n , in d ic a <br />
tio n , a n d gra p h ic record in g o f u n it a n d p la n t d isch a rg es.<br />
T h e ty p e o f e q u ip m e n t in sta lle d is p r e se n ted in d e ta il, a s<br />
w ell as it s a d a p ta tio n a s a n a u to m a tic g u id e t o o p e r a tio n ,<br />
r esu ltin g in a p p reciab le b en efits th r o u g h h ig h er o p era tin g<br />
efficien cies.<br />
I n t r o d u c t io n<br />
A L T H O U G H continuous autom atic accounting of unit disf<br />
- \ charge is not new, several recent improvements and developments<br />
have entirely changed the aspect of desirability<br />
for apparatus of this kind, as many of the shortcomings of earlier<br />
installations, limiting their usefulness, have been successfully<br />
overcome.<br />
While, in some plants, autom atic water accounting has been<br />
carried out for years, the necessary equipment has often been<br />
regarded as a luxury, particularly, as its sole purpose was usually<br />
confined to collecting runoff data a t the project site to augment<br />
records of existing gaging stations or, perhaps, replace those of<br />
stations rendered inoperative in a project area due to construction<br />
of a particular plant. Since the accuracy of river gaging is<br />
essentially not very high, and decidedly lower than th a t required<br />
for turbine-discharge measurements for acceptance tests, it has<br />
been standard practice to keep unit- and powerhouse-draft<br />
records by means of computations based on power output. A t<br />
the same time, however, it has been generally recognized th a t the<br />
installation of input-measuring apparatus would be highly desirable,<br />
if and when unit-discharge and station-totalizing equipment<br />
of sufficient accuracy and within economical reach were<br />
available to serve as a yardstick for plant operation, both as to<br />
proper and efficient loading of the units and to detect troubles<br />
affecting their efficiencies.<br />
To illustrate the difficulty of the solution to this problem, it<br />
may be mentioned that, while equipm ent of this kind was contemplated<br />
a t Safe Harbor a t the outset of construction in 1930,<br />
as a t th at time already certain provisions had to be incorporated<br />
in the substructure, on the generator-room floor, in the conduit<br />
system, and in the control room, nevertheless, the various investigations<br />
and development work required a substantial am ount<br />
of time and it was not until late in 1938 th at suitable equipment<br />
was finally installed.<br />
possible consistency, sensitivity, and suitability of various apparatus.<br />
In the first place, it had to be established th a t the index<br />
method, based on differential piezometer deflection, is of sufficient<br />
accuracy as a basis of continuous water measurements.<br />
P ie z o m e t e r I n s t a l l a t io n<br />
In each of the substructures of the six main units comprising<br />
the initial development, there were installed three piezometers of<br />
the W inter-Kennedy type2 in the turbine scroll and two piezometers<br />
of the Peck type3 on one of the stay vanes of the speed<br />
ring, Fig. 1. While one of the W inter-Kennedy taps was placed<br />
in the high-pressure low-velocity region, the two other taps were<br />
located radially opposite thereto a t the speed ring in the lowpressure<br />
high-velocity region, one just above the speed ring and<br />
the other tapped in the crown of the speed ring.<br />
The Peck piezometer locations are shown in Fig. 2, the im pact<br />
tap in the nose and the low-pressure tap in the flank of the stay<br />
vane. In the first four main units to be installed, the Peck impact<br />
tap was located a t the nose tip. On the fifth main unit it<br />
was placed a t a slight angle to the longitudinal axis of the stay<br />
vane, ,/ i in. from the nose tip, and on the sixth unit to be installed<br />
a t a still larger angle, th a t is, 45 deg and 2*/i« in. from the stayvane<br />
tip. A t the same tim e, some shift in upstream direction of<br />
the Peck low-pressure tap was also made on the latter two units.<br />
In addition, two auxiliary piezometer openings were located at<br />
2 “ Im proved T ype of Flow M e ter,” by I. A. W inter, Proc. A m erican<br />
Society of Civil Engineers, vol. 59, p a rt 1, 1933, pp. 565-584.<br />
* “ Tw o M ethods of M easuring W ater to H ydraulic T u rb in es,”<br />
Power, vol. 77, M arch, 1933, pp. 126-127.<br />
1— IN V E S T IG A T IO N S PU R S U E D<br />
The various investigations carried out dealt not only with the<br />
exploration of the principle to be employed, but also with the<br />
1 H ydraulic E ngineer, Safe H arbor Pow er C orporation. M em .<br />
A .S.M .E.<br />
C ontributed b y th e H ydraulic D ivision and presented a t the<br />
A nnual M eeting, N ew Y ork, N. Y „ D ecem ber 2-6, 1940, of T h e<br />
A m e r ic a n S o c ie t y o f M e c h a n ic a l E n g i n e e r s .<br />
N o t e : S tatem en ts and opinions advanced in papers are to be F i g . 1<br />
understood as individual expressions of th eir authors, and n o t those<br />
of th e Society.<br />
369<br />
W i n t e r - K e n n e d y P i e z o m e t e r -S y s t e m I n s t a l l a t io n a t<br />
M a i n U n i t s<br />
(Taps Ri, Rs, and R*.)
370 TRANSACTIONS OF T H E A.S.M.E. JULY, 1941<br />
the downstream nose of one of the intake piers of each main unit<br />
for possible use should pumping w ith the units ever be resorted<br />
to for peak storage requirements during low flow. Both service<br />
units were provided with two piezometers of the W inter-Kennedy<br />
type. To prevent air pockets, all piping leading to the individual<br />
piezometer openings was placed w ith a continuous slope and copper<br />
piping was used to prevent corrosion. In the pipe tunnel<br />
beneath th e generator-room floor, a piezometer board with verti-<br />
F i g . 2<br />
L o c a t i o n o f P e c k P i e z o m e t e r s o n M a i n - U n i t S p e e d - R i n g<br />
S t a y V a n e s<br />
( T a p s Y i a n d Y i . )<br />
cal glass tubes was installed at each unit where the deflections<br />
could be measured in feet of water.<br />
After placing each unit in service, it was essential, as a first step,<br />
to determine which combination of two piezometers would prove<br />
most consistent. This was done by plotting the differential pressure<br />
of any two taps against th at of any one of the other possible<br />
pairs. From Fig. 3, it may be noted th at the three Winter-<br />
Kennedy taps and the Peck im pact tap showed a markedly better<br />
consistency than the Peck low-pressure tap F 2, the latter being<br />
responsible for the erratic behavior in three of the plots. On the<br />
other five main units, the results were similar with the exception<br />
th at even the Peck im pact tap, located closer to the nose or at<br />
the very nose tip of the stay vane, was considerably less steady.<br />
For all main units, the W inter-Kennedy taps showed a high degree<br />
of consistency.<br />
This result should not be interpreted as a general weakness of<br />
the Peck type of system. Investigating the origin of this erratic<br />
behavior, th a t is, through analysis of the results with the various<br />
Peck tap locations, as shown in Fig. 2, it was found th at the cause<br />
for instability, particularly of the low-pressure tap, was rather in<br />
the design of the stay vanes than in the type of piezometer system.<br />
The Safe H arbor stay vanes are comparatively short and have a<br />
straight longitudinal axis. Since, on the one hand, the lowpressure<br />
tap was erratic in all units, irrespective of the shift<br />
upstream, and, on the other hand, the consistency and magnitude<br />
of deflection of the im pact tap increased decidedly by the shift<br />
away from the nose tip, it could be concluded th at the stay vanes<br />
of the speed ring were not pointed head on into the flow but at a<br />
considerable angle, causing a region of local disturbance on one<br />
side of the stay vanes, wTith the unstable region extending almost<br />
to the very tip of the vane. In the light of these results and, in<br />
view of the experience obtained elsewhere with piezometers of<br />
the Peck type, it would appear th a t a considerable improvement<br />
in stay-vane design is yet to be accomplished by lengthening,<br />
better streamlining, and curving these vanes. It is noteworthy<br />
F i g 3<br />
A n a l y s i s o f P i e z o m e t e r D e f l e c t i o n s O b t a i n e d a t N o. 2 U n i t
MOUSSON— TURBINE DISCHARGE M ETERING AT SAFE HARBOR HYDROELECTRIC DEVELOPMENT 371<br />
F ig . 4<br />
C a l i b r a t i o n o r P i e z o m e t e r P a i r { R i- R i) a t N oa. 4 a n d 5 U n i t s b y M e a n s o f T w o - T y p e C u r r e n t - M e t e r M e t h o d<br />
that, in more recent installations, some improvements in this<br />
direction already have been made.<br />
While the piezometers were used initially simply as a relative<br />
index to determine the proper relation between turbine-blade<br />
and guide-vane positions under various operating heads for the<br />
Kaplan main units and served as a basis for the cam designs<br />
controlling the gate-blade relation, these piezometers were calibrated<br />
for absolute-discharge measurements in course of the acceptance<br />
tests by means of the two-type current-m eter m ethod.4<br />
The results obtained for the piezometer pair ( R 4- R 2 ) (refer to<br />
Fig. 1) of the W inter-Kennedy system of two main units are<br />
shown in Fig. 4. These curves relate piezometer deflection and<br />
discharge in accordance with the fundam ental equation<br />
Q = C X £>“<br />
where Q is the discharge measured in cubic feet per second and<br />
D the differential piezometer pressure in feet of water. The<br />
slope of the curves and their intercept a t zero corresponding to<br />
the exponent a and coefficient C, respectively, were determined<br />
analytically, based on the method of least squares.<br />
Of the six main units, three were tested by means of current<br />
meters.1 The piezometers of the other units were calibrated<br />
indirectly by assuming their peak efficiencies to be identical writh<br />
those of other units of the same design and manufacture actually<br />
tested. This procedure was also followed for the two identical<br />
Francis-type service units in testing one of them by means of<br />
current meters and assuming the peak efficiencies of both to be<br />
alike.<br />
It is recognized th at such a procedure is not absolutely correct<br />
because identical units have not necessarily identical peak efficiencies.<br />
However, based on experience available, it is believed<br />
th at the error thus introduced will not exceed 1 per cent for any<br />
one unit and th at the average for the entire station should be<br />
4 “ W ater G aging for L ow -H ead U nits of H igh C a p acity ,” by J.<br />
M. M ousson, T rans. A .S.M .E ., vol. 57, 1935, pp. 303-316.<br />
even closer, because the actual efficiencies of these units might be<br />
higher or lower. The calibrations of the piezometer pair (R<br />
R>) of the W inter-Kennedy systems on the six main and the two<br />
service units are given in Table 1.<br />
TABLE 1<br />
CALIBRATION OF PIEZOM ETER PAIR (R«-fli) OF<br />
W INTER-KENNEDY SYSTEMS<br />
Main unit<br />
no. Coefficient C<br />
Departure from<br />
average, per cent<br />
Calibration<br />
procedure<br />
2 5107 — 0.80 Current meters<br />
3 5090 — 1.13 Based on No. 5 unit<br />
4 5267 + 2 .3 0 Current meters<br />
5 5070 — 1.52 Current meters<br />
6 5185 + 0 .7 2 Based on No. 4 unit<br />
7 5170 + 0 .4 3 Based on No. 5 unit<br />
Average 5148<br />
Service<br />
unit No.<br />
41 330.8 —0 .8 6 Based on No. 42 unit<br />
42 336.6 + 0 .8 6 Current meters<br />
Average 333.7<br />
Recognizing the fact th a t piezometers are very sensitive and<br />
greatly affected by local disturbances, due to irregularities of the<br />
water passage, as well as due to m inute changes in the shape<br />
of the piezometer opening, the differences in the coefficients are<br />
relatively small.6 The variation in the exponent a of the equation<br />
(Q = C X -D") was also very small, varying between 0.500 =*=<br />
0.005, so th a t for all practical purposes the square root was found<br />
to be of sufficient accuracy.<br />
To guard against unexpected trouble in the future, which would<br />
render one or the other piezometer unreliable or useless, all taps<br />
were calibrated during these tests. For instance, Fig. 5 shows the<br />
calibration of No. 2 unit Peck im pact tap Fi and W inter-Kennedy<br />
low-pressure tap (Ri) combination (F i-ft).<br />
The calibrations of the piezometers also perm itted arriving at<br />
some conclusion regarding the degree of consistency and relative<br />
precision of these systems, Table 2. The consistency or average<br />
6 “ Piezom eter In v estig atio n ,” by C . M . Allen and L. J . H ooper,<br />
T rans. A .S .M .E ., vol. 54, 1932, pp. 1-11.
372 TRANSACTIONS OF T H E A.S.M.E. JULY, 1941<br />
F ig . 5<br />
C a l i b r a t i o n o f P i e z o m e t e r P a i r (Yi-Rt) a t N o . 2 U n i t b y M e a n s o f T w o - T y p e C u r r e n t - M e t e r M e t h o d<br />
F i q . 6<br />
C h e c k o n C o n s i s t e n c y o f P i e z o m e t e r s U s i n g T u r b i n e - R u n n e r B l a d e O p e n i n g a s a P a r a m e t e r<br />
departure of one test point was determined analytically to ±0.25<br />
per cent for the measurements with the type I current meter,<br />
shown in Fig. 4. The mean departure of one measurement was<br />
=*=0.34 per cent. The mean departure of all measurements was<br />
±0.06 per cent and the relative precision =*=0.04 per cent. Considering<br />
th a t these values include not only the errors of the piezometer<br />
system bu t also those of the current-m eter measurements,<br />
it is believed th a t the accuracy of the systems is fully adequate<br />
as a basis for continuous-flow measurements.<br />
As a next step it was essential to see whether or not the<br />
piezometers would maintain their calibrations over a period of<br />
years. The results for one unit and one pair of piezometers of<br />
the W inter-Kennedy system are shown in Fig. 6, using the<br />
runner-blade angle of the Kaplan units as a parameter. In this<br />
instance a somewhat wider dispersion of the test points as compared<br />
w ith th a t in Figs. 4 or 5, is to be expected as the measure<br />
of blade angle is not very accurate due to the inevitable lag in<br />
the blade-operating mechanism. The results indicate, however,<br />
th a t during the period of observation no change in calibration<br />
had taken place. Of particular interest are the test points obtained<br />
in 1934, prior to proper adjustm ent of the blade-gate relation<br />
which for some reason had become slightly incoordinated.
MOUSSON—TU R B IN E D ISCHARG E M E T E R IN G AT SAFE HARBOR H Y D R O ELEC TRIC D EV ELO PM EN T 373<br />
T A B L E 2 D E T E R M IN A T IO N O F C O N S IS T E N C Y A N D R E L A T IV E<br />
P R E C IS IO N O F P IE Z O M E T E R P A IR ; C A L IB R A T IO N O F<br />
N O . 4 U N IT<br />
Square<br />
Turbine<br />
Root<br />
Discharge<br />
of<br />
fo r Type I P ie sc o e ter<br />
Test C urrent Meter D eflectio n<br />
Run 4 l c . f . s . ^84-82<br />
D epartures<br />
Per<br />
6<br />
Cent<br />
1 7518 1.448 5192 -20 0 .3 8 400<br />
2 5946 1 .U 0 5216 ♦ 4 0 .08 16<br />
3 4752 .917 5182 -30 0 .58 900<br />
4 4768 .915 5211 - 1 0.02 1<br />
5 3687 .708 5208 - 4 0 .08 16<br />
6 3735 .718 5202 -10 0 .1 9 100<br />
7 3182 .604 5268 ♦56 1.07 3136<br />
8 3145 .605 5198 -14 0.27 196<br />
9 3163 .608 5202 -10 0 .1 9 100<br />
10 5245 1.006 5214 ♦ 2 0 .0 4 4<br />
11 6594 1.268 5200 -12 0 .2 3 144<br />
12 6571 1.262 5207 - 5 0.10 25<br />
13 8729 1.664 5246 ♦34 0.65 1156<br />
14 8697 1.666 5220 ♦ 8 0 .15 64<br />
15 8415 1.613 5217 ♦ 5 0.10 25<br />
16 8401 1.612 5212 0 0 .00 0<br />
17 7875 1.510 5215 ♦ 3 0 .06 9<br />
18 7444 1.424 5228 ♦16 0 .31 256<br />
19 7426 1.427 5204 - 8 0 .15 64<br />
20 6611 1.278 5173 -39 0 .75 1521<br />
21 6651 1.276 5212 0 0.00 0<br />
22 5987 1.153 5193 -19 0.36 361<br />
23 5994 1.155 5190 -22 0.42 484<br />
24 5887 1.127 5224 ♦12 0 .2 3 144<br />
25 5858 1.127 5198 -14 0 .2 7 196<br />
26 5289 1.011 5231 ♦19 0.36 361<br />
27 5301 1.015 5223 ♦11 0 .2 1 12 1<br />
28 4726 .906 5216 ♦ 4 0 .08 16<br />
29 4712 .906 5201 - 1 1 0 .21 121<br />
30 4174 .797 5237 ♦25 0 .4 8 625<br />
31 4173 .801 521D - 2 0 .0 4 4<br />
32 3632 .697 5211 - 1 0.02 1<br />
33 3634 .697 5214 ♦ 2 0 .04 4<br />
34 3115 .595 5235 ♦23 0 .44 529<br />
35 3091 .595 5195 -17 0 .3 3 289<br />
36 2657 .510 5210 - 2 0.04 4<br />
37 2664 .510 5224 ♦12 0 .2 3 144<br />
Re su ite<br />
Avg<br />
-5212<br />
C onsistency or average d ep artu re of one measurement “ ±0.25*<br />
374 TRANSACTIONS OF T H E A.S.M.E. JULY, 1941<br />
system useless, even w ith frequent flushing by compressed air or<br />
filtered water. At the same time, this apparatus did not lend<br />
itself particularly to totalizing, because a like periodicity of the<br />
drum motion on different units would not correspond to equal<br />
unit discharges, due to the difference in the piezometer calibrations.<br />
Theoretically, it could be compensated for by introducing<br />
different gear ratios for the individual counters or by changing<br />
the size or location of the orifice connecting the two drum cham-<br />
of the instrum ent errors by making standard water-eolumn tests.<br />
Three major sources of errors were revealed. A first error was<br />
traced to the eccentricity of the integrating disk. This error was<br />
not constant but had a periodic sinusoidal characteristic completing<br />
the cycle in '/a hr, corresponding to the time required<br />
for 1 revolution of the disk. While for one of the flowmeters<br />
the amplitude of this sinusoidal-error curve varied between<br />
+0.63 and —0.38 per cent, the other flowmeter showed diskerror<br />
variations between —0.82 and +1.39 per cent. The<br />
second error, which could not be controlled, was the variable frequency<br />
of the station-service system from which the clock driving<br />
the integrating disk obtained its power supply. Since the<br />
frequency varied about 1 per cent, it was sufficient to make the<br />
disk error inconsistent with time, by causing a phase shift<br />
in the disk-error curves.<br />
The third source of error was due to the lap of the counter<br />
gears and the weight of the rotating countersweep hand, its<br />
weight tending to accelerate the motion in the downstroke and<br />
retard it in the upward swing. This phenomenon superimposed<br />
F i o . 7 D i a g r a m m a t i c S k e t c h or T y p e 3 F l o w m e t e r<br />
(B y co u rte sy of th e L eeds & N o rth r u p C o m p a n y .)<br />
bers or even through adjusting the amplitude of the cyclic rotational<br />
drum movement. In view of the various disadvantages<br />
and complications, this type of meter, though accurate, could not<br />
be given any further consideration.<br />
Two flowmeters of the second type were purchased and installed<br />
tem porarily on separate units in the pipe tunnel beneath the<br />
generator-room floor. Prior to shipment, these meters were<br />
calibrated by the m anufacturer for the respective piezometer<br />
systems. As a first step, hourly readings of the m eters were compared<br />
with analytically determined unit discharges based on<br />
output. As expected, the flowmeters showed consistently larger<br />
unit discharges, the discrepancy being more the greater the<br />
fluctuation in loads carried by the units. W ith the units operating<br />
on hand control and blocked to generate a t a constant output,<br />
there was close agreement between metered and analytical discharges.<br />
These results m ay be attributed to the concave shape of<br />
the unit-efficiency curves.<br />
Next, these flowmeters were used to make turbine-efficiency<br />
tests of 5- and 10-min duration, the flowmeters being read every<br />
15 sec and the watt-hour-meter-disk revolutions and the time in<br />
seconds being recorded by a chronograph. On each unit, the<br />
test points thus obtained spread considerably over a band about<br />
3 per cent in term s of efficiency. This discovery led to analysis<br />
F ig . 8 T e m p o r a r y I n s t a l l a t i o n o f E x p e r i m e n t a l T y p e 3<br />
F l o w m e t e r a t No. 5 U n i t<br />
another error of periodic characteristic upon the first error referred<br />
to. To make m atters more complicated, the frequency of<br />
the second periodic error was not constant but varied with the<br />
discharge, being a function of the speed of the countersweep hand<br />
and, therefore, decreasing with increasing discharge.<br />
Although results of short-duration efficiency tests, using compensating<br />
measures for the errors referred to, gave greatly improved<br />
results, it was realized th a t such procedures were too complicated<br />
to be adopted as a routine measure on all units, because<br />
the effort involved, in analyzing instrum ent errors for meters to
MOUSSON—TU R B IN E DISCHA RG E M E T E R IN G AT SAFE HARBOR H Y D R O ELECTRIC D EV ELO PM EN T 375<br />
DISCHARGE IN C. F S.<br />
DEFLECTION IN INCHES<br />
F io 9<br />
E r r o r C u r v e o f E x p e r i m e n t a l T y p e 3 F l o w m e t e r<br />
be installed on all units and the use of difficult and complicated<br />
compensating procedures for each meter, was far too great in<br />
comparison with the accuracy of the results obtained.<br />
An experimental flowmeter of the third type was installed<br />
temporarily on one of the units, Fig. 8, and operated in parallel<br />
with one of the m eters of the second type. Hourly readings on<br />
both meters were compared w ith each other as well as w ith discharge<br />
computations based on power output. The two flowmeters<br />
agreed within 0.5 per cent in average, the third type of m eter<br />
being closer to the analytically determined discharge.<br />
Short-duration efficiency tests on the third type of m eter<br />
showed a very small spread of test points and a very good agreement<br />
with the results of the turbine acceptance tests. The execution<br />
of these tests could be simplified considerably by being<br />
able to record the flowmeter countershaft revolutions, Fig. 7, by<br />
means of electrical impulses on the chart of a recorder simultaneously<br />
w ith the revolutions of the w atthour-m eter disk and<br />
second impulses. The w atthour-m eter-disk revolutions were obtained<br />
by means of a photoelectric-cell arrangement, a small<br />
electric bulb being placed on one side of the disk and the photoelectric<br />
cell on the opposite side. The beam of light causing the<br />
impulses fell through the balancing hole in the watthour-meter<br />
disk. The second impulses were obtained also by means of a<br />
photoelectric-cell arrangement mounted on the m aster clock for<br />
frequency control of the system, the beam of light being cut by<br />
the pendulum.<br />
Next, the m eter errors of the third type of flowmeter were<br />
analyzed by means of the standard water-column tests. As may
376 TRANSACTIONS OF T H E A.S.M.E. JULY, 1941<br />
be seen, the error curve as shown in Fig. 9 had the typical shape<br />
of a rotational integrating device. While the test points were<br />
rather consistent, nevertheless it was concluded th a t further<br />
improvement of the m eter should be carried out to flatten and<br />
lengthen the horizontal leg of the error curve and improve its<br />
accuracy to such a degree th a t even analytical compensating<br />
measures would not be required for short-duration efficiency<br />
measurements on the turbines.<br />
Additional tests were carried out to determine the responsive-<br />
ness and sensitivity of the second and third types of flowmeters<br />
w ith varying load on the generating unit. The results, shown in<br />
Fig. 10, dem onstrate the consistency of the third type of flowmeter,<br />
as it follows the watthour-disk-revolution indications consistently<br />
in contrast to those of the second type.<br />
In view of the fact th a t the totalizing with the third type of<br />
m eter was a simple electrical problem and well-established<br />
principle, it was decided to use the third type of flowmeter for<br />
the Safe H arbor installation, provided satisfactory improvements<br />
were made by the m anufacturer in the error characteristics.<br />
F i g . 11<br />
T y p i c a l F l o w m e t e r I n s t a l l a t i o n<br />
2—F L O W M E T E R E Q U IP M E N T IN S T A L L E D AT SA FE<br />
H A R B O R<br />
During 1936 and 1937, various studies were made on remote<br />
unit-discharge-totalizing equipment. The manufacturer’s attention<br />
was drawn also to the possibility of using this type of<br />
equipm ent as part of unit- and station-efficiency indicating-andrecording<br />
apparatus. By 1938, the plans for such an installation<br />
had crystallized to a point where it was felt safe to proceed with<br />
the installation of the flowmeter equipm ent for all units, as well<br />
as the flow-totalizing apparatus for the entire station.<br />
The flowmeters selected were installed in cabinets originally<br />
provided on the generator-room floor, located adjacent to and<br />
forming an integral p art of the gage boards of each unit, Fig. 11.<br />
This installation comprised eight flowmeters, one for each of<br />
the six main units and one each for the two service units. On all<br />
units the flowmeters were connected to the Winter-Kennedy<br />
piezometer pair (R t-R t) and calibrated, based on the data<br />
given in Table 1.<br />
I t should be noted th a t the error characteristics of these meters<br />
had been m aterially improved, so th at no correction of any<br />
sort had to be applied over the entire range of turbine discharge<br />
actually used. The improvement in the error characteristics can<br />
best be realized by comparing the check calibrations of three<br />
flowmeters after installation, Fig. 12, with the results obtained<br />
with the experimental flowmeter in 1934, which is shown in Fig. 9.<br />
Another desirable advantage of these meters is th at the checking<br />
or recalibration is greatly simplified by calibrated weights to<br />
be hung on one arm of the tilting mercury manometer, thus<br />
eliminating the use of standard water columns. As demonstrated<br />
by the data plotted in Fig. 12, the results obtained by each method<br />
are, for all practical purposes, identical.<br />
The power supply for the flowmeter motor integrators was obtained<br />
from the 120-v 60-cycle station-service system at outlets<br />
t-<br />
300 0 4 0 0 0<br />
D ISCH A R G E IN C.F.S.<br />
5 0 0 0 6 0 0 0 7000 800 0 9000 10000<br />
....... ..... * 1— o H<br />
o<br />
F. i<br />
£ 1 Meter Installed at No. 3 Unit (Q *5090 Yfi)<br />
__________<br />
- D IS C H A R G E IN C.F.S.<br />
O .. 3 0 0 0 4000 5000 6000 7000 8000 9000 10000<br />
h-<br />
< O<br />
£ 0<br />
(0<br />
cc<br />
Meter Installed at No. 6 U n it ( Q * 5/85 VP)<br />
u.<br />
o<br />
D ISCH A R G E IN C.F.S.<br />
£r 3000 4 0 0 0 5000 6000 7000 80,00 9000 10000<br />
g . _ » --------------<br />
Meter Installed at No. 7 Unit (Q*5170YP)<br />
............................ 1 ----- - - I<br />
DEFLECTION IN INCHES<br />
Legend.<br />
Date of Tests.<br />
o Test with Water Column No. 3 Unit - Feb. 8,1940.<br />
x Test with Weights<br />
No. 6 Unit - SeptZ/,/939-<br />
No. 7 Unit - Sept. Zf, 1939.<br />
F i q . 12<br />
C h e c k C a l i b r a t io n s o f T h r e e T y p e 3 F l o w m e t e r s A f t e r I n s t a l l a t io n
MOUSSON—TU R B IN E D ISCHARG E M E T E R IN G AT SAFE HARBOR H Y D R O E LECTRIC D EV ELO PM EN T 377<br />
F i g . 13<br />
D is c h a r g e T o t a l iz in g R e l a y s<br />
available at each unit gage board. The totalizing apparatus was<br />
installed on a panel of the relay board in the control room, Fig.<br />
13. Its principal parts consist of four impulse totalizing relays.<br />
Three of these serve as unit-discharge totalizers for a group of<br />
three turbines each and one as m aster totalizer for the entire sta-<br />
F i g . 15 S t a t io n T o t a l D is c h a r g e I n d ic a t o r a n d R e c o r d e r<br />
I n s t a l l e d o n I n s t r u m e n t B o a r d i n C o n t r o l R o o m<br />
F i q . 14 T o t a l iz in g R e l a y s a n d S t a t io n T o t a l D is c h a r g e<br />
C o u n t e r I n s t a l l e d o n R e l a y B o a r d i n C o n t r o l R o o m<br />
tion, giving the sum total of the three unit totalizing relays. The<br />
spare position on the first totalizing relay will be used for the flowm<br />
eter at No. 1 unit, now being installed. While the input-output<br />
ratio of the unit totalizing relays is 5:3, the m aster totalizer<br />
has a ratio of 3:1. Since each impulse sent out by the interrupter<br />
on the countershaft of the individual flowmeters represents 20,000<br />
cu ft, each impulse received by the station total discharge counter<br />
from the m aster totalizing relay corresponds to 100,000 cu ft.<br />
The station-total counter is mounted below the totalizing relays<br />
on the same panel, Fig. 14. Individual unit discharges can be read<br />
on the individual impulse counters of the unit totalizing relays.<br />
Mechanical counters were provided on all flowmeters in order to<br />
facilitate the checking of impulse transmission and relay operation,<br />
as well as for rechecking the calibrations of the flowmeters<br />
themselves.
378 TRANSACTIONS OF T H E A.S.M.E^ JULY, 1941<br />
F i g . 16<br />
T y p ic a l L o a d in g ! S c h e d u l e f o b S a f e H a b b o e M a i n U n it s<br />
A total station discharge graphic recorder and discharge indicator,<br />
combined in one instrum ent, was installed on the instrument<br />
panel located opposite the totalizing-relay panel, Fig. 15.<br />
The upper range limit of the graphic recorder and the indicator<br />
was chosen as 80,000 cfs, representing the approximate maximum<br />
station draft of the Safe H arbor development for a num ber of<br />
years in the future.<br />
3— B E N E F IT S O B T A IN E D T H R O U G H F L O W M E T E R<br />
IN S T A L L A T IO N<br />
During 1939, various investigations were made based on the<br />
data obtained by the flowmeter installation. The operators were<br />
required to read the individual unit discharges and the stationtotal<br />
draft every hour on the hour, together with the unit and<br />
station integrating w atthour meters, as well as forebay and<br />
tailw ater indications. The operators, however, were still charged<br />
with computing the individual unit and total-station drafts based<br />
on power output, as had been standard practice. I t was felt th at<br />
a long-term comparison was essential to obtain the proper basis<br />
for continuous-flow records a t Safe Harbor, the transition period<br />
furnishing the ratio between computed and autom atically recorded<br />
station drafts under the various seasonal loading schedules.<br />
Once sufficient data have been accumulated, it is expected th at<br />
the operators will be relieved altogether from computing the discharge<br />
based on output.<br />
The data obtained by the operators were also used to investigate<br />
unit and station operating efficiencies. An investigation of<br />
this kind was all the more essential, as during approximately 290<br />
days of the year the available river flow a t Safe H arbor is<br />
less than the station draft required w ith all six main and two<br />
service units installed operating a t maximum capacity. After<br />
placing the seventh main unit in service, which is now under construction,<br />
the corresponding period will increase to 305 days. It<br />
was interesting to note th a t the availability of an input yardstick<br />
had a decidedly stim ulating effect on the operating personnel.<br />
While, during the first m onth of flowmeter operation, th at is,<br />
January, f939, the ratio of actual loss in generation to expected<br />
loss was greater than unity on all but 8 days, this ratio did not<br />
exceed unity during 18 days in May, 1939, under similar river-flow<br />
conditions and loading schedules. I t has been estim ated th at<br />
an improvement of this magnitude is responsible for an increase<br />
in generation of at least 0.3 per cent, or approximately 1,700,000<br />
kwhr per year with the present installation of six main units and<br />
1,900,000 kwhr per year with the seventh main unit placed in<br />
service, so th at the flowmeter installation will pay for itself in a<br />
very short time.<br />
W ith a close continuous check on unit operating efficiencies<br />
available, it was also possible to keep the losses due to trash on<br />
the intake screens appreciably below those which must have been<br />
prevailing during previous years. Prior to the installation of the<br />
flowmeters, the screen losses were determined from time to time<br />
by measuring the screen head loss. Now, as soon as any of the<br />
units show a drop in operating efficiency, as indicated by the<br />
hourly readings, the screen losses are determined independently.<br />
After cleaning the racks, the operating efficiency invariably increases<br />
to the expected level. Although it is difficult to estimate<br />
the increase in station economy due to this means of obtaining an<br />
earlier indication of the loss in efficiency due to plugging up of<br />
the screens, nevertheless, it is believed that the benefits thus<br />
derived are substantial.<br />
Since the availability of the particular type of flowmeters perm<br />
itted short-duration turbine-efliciency tests to be carried out by<br />
one man, therefore justifying itself as a routine measure, it was<br />
also possible to investigate in detail the efficiency characteristics<br />
of each main turbine over the entire range of operating heads.<br />
Such a procedure was particularly desirable as these turbines<br />
are of the K aplan type, requiring an adjustm ent of the cam controlling<br />
the gate-blade relation for the various operating heads,<br />
the operators being required to change to a new cam setting after<br />
each 1 ft of change in head. While these compensating devices<br />
on all main units were originally designed and calibrated, based<br />
on a minimum of information due to the costly testing procedures<br />
even with the use of the index method writh piezometers, the<br />
flowmeters available made it possible to check and recalibrate<br />
these compensating devices w-ith a large amount of detailed information<br />
obtained with a minimum of effort. The scope of the<br />
work involved can best be realized by mentioning that, although<br />
five of the six main units were of identical design, nevertheless,<br />
the characteristic of each unit was found to be sufficiently different<br />
from the others to w arrant individual cams, consequently<br />
requiring individual calibration of the cam-adjustment device<br />
for variation in head. The results of this investigation reflected<br />
favorably upon the operating efficiencies of the individual units<br />
and the station as a whole.<br />
As a next step, a detailed study was undertaken to determine<br />
the magnitude and duration of avoidable inefficient operation in<br />
percentage of total operating time. From the ideal loading<br />
schedule for the main units, as shown in Fig. 16, and valid for a<br />
gross head of 55 ft, it is apparent th at the band of permissible<br />
load variations of each unit decreases with increasing number of<br />
units on the line. W ith capacity requirements above the most<br />
efficient station operating range with all available units operating,
MOUSSON—TURBINE DISCHARGE METERING AT SAFE HARBOR HYDROELECTRIC DEVELOPMENT 379<br />
all individual unit loadings are increased by equal amounts up to<br />
the point of maximum capacity.<br />
By analyzing the chart of the total station discharge recorder,<br />
Fig. 15, in the light of the operator’s log, it was noted that considerable<br />
periods elapsed between the time of placing units on or<br />
off the line and the ideal loading schedule. The losses thus sustained,<br />
though by no means excessive, when compared with some<br />
other stations were nevertheless appreciable, amounting to<br />
about 10 per cent of the total operating time on the average.6’7<br />
It was realized that there was considerable room for improvement<br />
provided proper means were available for giving instantaneous<br />
warning when reapportioning of load to individual units is<br />
required. It is obvious that in this connection some thought was<br />
again given to efficiency-indicating-and-recording apparatus,<br />
but another and far simpler and less expensive solution was discovered.<br />
4—INSTALLATION OF LOAD-LIMIT LIGHTS<br />
The characteristics of the Kaplan-type main turbines installed<br />
at Safe Harbor are such that the most efficient discharge<br />
range of these units is, for all practical purposes, independent of<br />
the head if the loading schedules, valid for each head similar to<br />
that in Fig. 16, are adhered to. Thus the discharge, with one unit<br />
operating within the permissible load range, varies between 4000<br />
and 8200 cfs irrespective of the head, and the discharge ranges<br />
TABLE 3 DISCHARGE LIM IT SETTING FOR LOAD LIM IT<br />
LIGHTS<br />
Discharge Discharge-range Main units to<br />
range, no. setting, cfs be operated, no.<br />
1 0 - 4000 0<br />
2 4000- 8200 1<br />
3 8200-14900 2<br />
4 14900-21400 3<br />
5 21400-27500 4<br />
6 27500-33900 5<br />
7 33900-40800 6<br />
8 40800-48000 7<br />
with any given number of units operating are also constant, i.e.,<br />
independent of the head for all practical purposes. In view of<br />
these characteristics and taking proper account of station-service<br />
unit draft requirements, it was possible to provide for an automatic<br />
and instantaneous load-limit indicating apparatus as an<br />
integral part of the total station discharge indicator and recorder,<br />
shown in Fig. 15.<br />
Essentially, this device consists of a contact-making cam arrangement<br />
controlling two warning lights, one located on the<br />
operator’s desk and the other on the instrument board above the<br />
station total discharge recorder. For each load range between<br />
two discharge limits, Table 3, there is available one contact-making<br />
cam assembly independently adjustable as to what part of<br />
the total-discharge range it will control. A control switch is provided<br />
with one position for each discharge range, that is, number<br />
of units to be operated, connected so as to keep the light extinguished<br />
when set for the number of units to be in operation for<br />
best efficiency, as long as the discharge is in the corresponding<br />
range. If the discharge crosses the limits of this range, the lights<br />
will be lighted from the contact assembly of the adjacent range<br />
either until the switch has been reset to the number of units, corresponding<br />
to this new range, or the discharge has returned within<br />
the range. With the control switch being kept set correctly, that<br />
is, corresponding to the number of units in operation for best<br />
efficiency in each discharge range, the illumination of the lights<br />
will indicate inefficient operation.<br />
• “How We Raise Hydro Efficiencies,” by E. B. Strowger, Electrical<br />
World, vol. 103, April 14, 1934, pp. 535-538.<br />
7 “Waterwheel Testing and Operating Records of Plant Discharges,”<br />
Proceedings National Electric Light Association, vol. 85,<br />
1938, pp. 872-904.<br />
It may be noted that eight discharge ranges have been provided,<br />
the reason being that the seventh main unit is now being installed<br />
and that an indication is also desirable when the station as a<br />
whole, with all seven main units operating, has reached the upper<br />
limit of the range of most efficient operation.<br />
In addition, the scope of the total discharge station indicator<br />
and recording instrument will be increased by means of adding<br />
a load-operating-range scale, each division of this scale corresponding<br />
to the permissible range of discharge for a certain<br />
number of units in operation as shown in Table 3. By means of<br />
this improvement, it will be possible to observe at a glance how<br />
many units should be in operation at any time. When reaching<br />
a load limit as indicated by the warning lights and observing the<br />
shape of the discharge curve plotted by the station-discharge recorder,<br />
it also will be immediately apparent whether an upper or<br />
lower limit has been reached, requiring one unit to be put on<br />
or off the line, respectively.<br />
To keep a definite record of inefficient operation, the station<br />
total discharge recorder is also to be equipped with an additional<br />
pen element operating simultaneously with the load-limit lights.<br />
This added provision will also enable the operators to ascertain<br />
the duration of the period of inefficient operation prior to noticing<br />
the lighted load-limit lamps, so that the allowable 10-min interval<br />
of borderline operation is not exceeded. Some inefficient operating<br />
time is necessarily unavoidable and, for the present and some<br />
time past, we have felt that a 10-min period of allowable inefficient<br />
operating time is reasonable.<br />
The installation of this load-limit light apparatus is now in<br />
progress and it is expected that, due to its availability, avoidable<br />
inefficient operation will be reduced to a negligible amount, resulting<br />
in an additional and substantial increase in operating<br />
efficiency and station output.<br />
D iscussion<br />
M. M. B o r d e n .8 The type 2 flowmeter referred to was not<br />
constructed with certain precise operations, involving gear-centering<br />
and tooth-spacing in particular, which are applied to instruments<br />
the totalized flows of which are to be read at intervals<br />
of a few minutes rather than several times a day.<br />
A case in point is taken from the record of one of several such<br />
meters, which were furnished for an electric power station.<br />
In this instance the maximum errors of the totalizer when<br />
read at 5-min intervals varied from —0.8 to + 0 .9 per cent with<br />
an average for a 90-min period of + 0.16 per cent.<br />
For 10-min intervals between readings, such point errors;<br />
varied from + 0.65 to —0.65 per cent and the 90-min averagewas<br />
+0.16 per cent.<br />
For 30-min intervals between readings, the point errors werefrom<br />
a maximum of + 0 .3 to —0.1 per cent, with a 90-min average<br />
of + 0.1 per cent.<br />
The errors were determined by comparing the readings of the<br />
fast-moving hand of the totalizer with its 4-in. graduated circle<br />
with the record of the water weighed in the laboratory tanks.<br />
The type 2 instrument permitted comparison of the instantaneous<br />
rate of water flow with the corresponding instantaneous indications<br />
of the electrical output and of the head on the wheels.<br />
The water-flow rate indication of this meter is made without the<br />
use of gearing and may be read by a pointer moving in front<br />
of an equally spaced flow scale of whatever radius is required.<br />
While the W -K relationship appears to have a normal flow of<br />
0.5 for n, the operating principle of the type 2 meter allows it to<br />
be furnished with a uniformly spaced flow scale for any value of n<br />
which the particular field rating might necessitate.<br />
8 Chief Engineer, Simplex Valve & Meter Company, Philadelphia,<br />
Pa. Mem. A.S.M.E.
380 TRANSACTIONS OF THE A.S.M.E. JULY, 1941<br />
E. S. Bristol.9 This paper presents an interesting review of The relay equipment for totalizing station-water flow is of the<br />
the steps taken in a persistent investigation that finally resulted standard impulse type employed for electrical-demand metering,<br />
in a flow-measuring installation of a rather unusual nature. It is with minor modifications to suit the high rate of operation required.<br />
of interest also to note how the various obstacles were overcome<br />
Flow is totalized every 2 min, so that a high rate of<br />
through careful study and how the information yielded by the impulses per minute is necessary in order to obtain reasonably<br />
final metering system was analyzed to obtain improved station close setting of the totalizing recorder. The pen of this recorder<br />
performance.<br />
Additional information with respect to the type 3 flowmeter<br />
moves at the expiration of each 2-min interval to a position corresponding<br />
to average rate of station-water flow during that interval.<br />
described by the author, will make more apparent the characteristics<br />
The totalizing action employs positive forward and return<br />
contributing to the degree of accuracy reported. Referring<br />
electrical impulses, with corresponding forward and return solenoids<br />
to Fig. 7 of the paper, it is seen that the flowmeter is a<br />
force balance in which a force dependent upon piezometer pressure<br />
on the totalizing relays. As a result, no false counts occur if<br />
a transmitting contact chatters and produces more than one im<br />
difference is opposed to centrifugal force from a rotating- pulse in the same direction. After each forward impulse,<br />
the<br />
flyball system. The meter is a relay-type mechanism, in which<br />
the balance arm functions only as a detector to regulate electricpower<br />
supply to the integrator motor. A knife-edge support is<br />
provided for the balance arm which is not required to operate<br />
any indicating, recording, or integrating elements, but which<br />
merely functions to actuate a magnetically operated mercury<br />
switch. The alternate closing and opening of the mercury<br />
switch results in an on-off control of the integrator motor, such<br />
that its speed oscillates slightly above and below the required<br />
average value for any particular pressure differential. The<br />
tilting manometer thus has a continuous rocking action, similar<br />
to that of many speed governors, which reduces to a minimum<br />
any tendency of the mercury to stick to the manometer tubes<br />
as well as any frictional effects.<br />
The flyball system, actuated by the integrator motor, is of<br />
the neutral type, such that force transmitted to the manometer<br />
arm is independent of the flyball angular position over the working<br />
range. This characteristic avoids change in calibration<br />
when the manometer arm assumes slightly different average<br />
positions, as required to change the on-off time cycle of the<br />
mercury switch in maintaining required motor speed, despite<br />
variations in voltage, frequency, etc.<br />
The integrating element of this type of meter inherently possesses<br />
the same accuracy as the meter itself, since direct coupling<br />
of the integrator to the variable-speed motor, driving the flyball<br />
system, avoids the introduction of any intermediate errors.<br />
Separate means of adjustment are provided for calibrating the<br />
high and low ends of the meter range, thus making it possible to<br />
match closely the characteristics of the primary-flow element,<br />
such as the turbine-scroll piezometers employed at Safe Harbor,<br />
or the venturi tube, flow nozzle, or thin-plate orifice more commonly<br />
used. The high-range adjustment consists of a threaded<br />
rod for changing the point of attachment of the vertical flyball<br />
link to the horizontal manometer arm. The low-range adjustment<br />
consists of a moving balance weight on the manometer arm.<br />
By means of these adjustments, the meter calibration can be<br />
readily changed in the field to suit an experimentally determined<br />
coefficient of the primary element, in applications where facilities<br />
are available for checking the latter in its service location.<br />
Figs. 9 and 12 of the paper indicate the nature of the variations<br />
which can be made in the meter calibration. The experimental<br />
meter of Fig. 9 was slow at the higher flows, so that the manometer<br />
balance weight was offset in the increase direction to improve<br />
the over-all relation. The three calibration curves of production<br />
meters, in Fig. 12, show much improved settings at high<br />
flows, with both high and low deviations at low flow, depending<br />
upon the particular low-range-adjustment setting. As pointed<br />
out by the author, once the relation between water-column readings<br />
and check-weight readings has been determined, the latter<br />
can be used in routine accuracy checks with resultant saving in<br />
maintenance time.<br />
8 E ngineering D ep artm en t, Leeds & N o rth ru p C om pany, P hiladelphia,<br />
P a. M em . A .S.M .E .<br />
associated return impulse must go through to reset the receiving<br />
element, before a successive forward impulse can be of any effect.<br />
The author refers to the possible use of the flowmeter equipment<br />
as a component of efficiency-measuring equipment for<br />
individual generating units or for the complete station. To<br />
obtain an indication or record of efficiency, elements must be<br />
added which will properly combine effects representative of<br />
electrical output and hydraulic head with the water-flow measurement<br />
and provide an ultimate indication of the ratio of electrical<br />
output to the product of water flow multiplied by head.<br />
These operations can be performed electrically, using an emf<br />
from a thermal converter or torque balance to represent electrical<br />
load, an emf from a slide-wire, positioned in accordance with rate<br />
of flow, and an emf proportional to head, as derived from floatactuated<br />
slide-wires at the forebay and tailrace. By applying<br />
these emf values to suitable potentiometer recording equipment,<br />
a continuous record can be obtained of the efficiency of an individual<br />
unit or of the entire station.<br />
In closing, it may be mentioned that the type 3 flowmeter is<br />
not restricted to hydraulic applications, but is also employed in<br />
steam-flow service.<br />
F. N agler.10 The water-power industry has been all too<br />
slow in analyzing its own performance. Its system seems to be<br />
much less exact than that of a flour mill, a country grocery store,<br />
or a gold mine. All too frequently, however, because of the difficulty<br />
of sampling the ore, mining operations are tabulated on<br />
the basis of adding the bullion produced to the assumed or measured<br />
gold content in the tailings, that sum being reported as<br />
the “head.” Water-power management has not been so greatly<br />
different in the conduct of its own affairs.<br />
The ideal state would be to charge to the plant the flow in<br />
the river and credit to the plant the kilowatthours produced.<br />
The apparatus methods described in the paper are, apparently,<br />
sufficiently directed to that very end.<br />
Is it not inevitable that any piezometer located on the nose<br />
of the vane will be more erratic, under variable-flow conditions,<br />
than one located on a surface where the flow is directed? This<br />
does not refer so much to the variation of flow from the operation<br />
of the guide vanes, as to variations resulting from influences<br />
further upstream. Typical sources would be the condition of the<br />
racks but, more particularly, the condition of operation of adjacent<br />
units. In any event, careful observation of the indicated<br />
results should permit attention to be called quickly to any abnormal<br />
flow condition which might be harmful.<br />
Apparently, Fig. 16 of the paper tells quite a story, not so<br />
much for a plant containing six units, but particularly for plants<br />
which contain more. Flatness of the efficiency-gate-opening<br />
curve naturally plays less and less part in efficient operation of<br />
plants as the number of units increases. Should this be applied<br />
still further to the regulation of units, a series of curves would<br />
10 C hief Engineer, C anadian A llis-Chalm ers, L td ., T oronto, C anada.<br />
Life M em ber A .S.M .E .
MOUSSON—TU R B IN E DISCHARGE M E T E R IN G AT SAFE HARBOR H Y D R O E LECTRIC D EV ELO PM EN T 381<br />
result very much as shown in Fig. 7 of a paper11 by the writer on<br />
speed regulation.<br />
J. F. R o b e r t s .12 This paper should be of great interest to<br />
engineers who have tried to keep accurate discharge records at<br />
hydroelectric plants. Apparently, the author’s organization<br />
has been successful in obtaining the cooperation of the operating<br />
engineers. In his earlier experience the writer frequently encountered<br />
opposition or at least lack of interest in this regard.<br />
Since turbine flowmeters invariably show a greater discharge,<br />
as compared with computed discharges based on kilowatthour<br />
output, the operators sometimes preferred the latter method, as it<br />
gave them credit for a higher operating efficiency than actually<br />
existed.<br />
The desirability of turbine flowmeters is now universally recognized<br />
by operators as essential in large modem hydroelectric<br />
plants. How many modern steam plants are built a t the present<br />
time without accurate coal, feedwater, and steam flowmeters?<br />
Electrical engineers would not think of omitting both integrating<br />
and recording w atthour meters, yet some of these same engineers<br />
formerly belittled the use of turbine-discharge flowmeters, preferring<br />
to rely on the unit-performance curves made up when the<br />
units are new and under ideal test conditions.<br />
The Tennessee Valley Authority has had excellent results with<br />
the W inter-Kennedy type of taps shown in the author’s Fig. 1.<br />
One set of these taps was calibrated on a 16-in. test model of a<br />
45,000-hp 48-ft head, fixed-blade propeller turbine, obtaining the<br />
following calibration: Q — 6562 D0-481 where D is the deflection<br />
in feet of water, the quantity of water being measured by a<br />
weir.<br />
Gibson tests on similar taps on a 66,000-hp 165-ft head Francis<br />
turbine gave the following equation for two similar units:<br />
W inter-Kennedy taps is measured, Q is equal to C X O" where a<br />
is practically 0.5. If a test is made a t various blade angles a t<br />
several gate openings, during which the head, kilowatt output,<br />
and deflection are measured, curves can be plotted as shown in<br />
Fig. 17 of this discussion.<br />
The ordinates KW-s/D are proportional to the unit efficiency if<br />
plotted for a constant head. In effect, such a curve is an overwhere<br />
D is the deflection in inches of mercury.<br />
J. W. S c o v i l l e .13 The stay vanes of a speed ring are a necessary<br />
evil, and their angle and shape have been objects of considerable<br />
investigation in so far as turbine efficiency is affected. The<br />
angle is necessarily a compromise, since a turbine has to operate<br />
at any gate opening. The angle and shape are such th at the best<br />
efficiency is not reduced nor maximum output affected adversely.<br />
Necessarily no consideration has been given to the effect on the<br />
Peck piezometers. The w riter has noticed th a t the coefficient<br />
for the Peck taps varies with gate opening on K aplan turbines in<br />
several plants which have been tested. This fact does not necessarily<br />
preclude their use for index testing in connection w ith the<br />
determination in the field of the proper blade-gate relationship<br />
of a Kaplan turbine. The W inter-Kennedy system is equally<br />
suitable for this purpose.<br />
The author mentions but does not stress the fact th a t the<br />
piezometers were used for such index testing. I t is possible by<br />
such methods to obtain the correct blade-gate relationship of a<br />
Kaplan turbine without going to the expense of a water-measurement<br />
test.<br />
As the author points out, if the deflection between Peck or<br />
11 “C hanging R equirem ents in H ydraulic T urbine Speed R egulatio<br />
n ,” by F . N agler, T rana. A .S.M .E ., vol. 52, 1930, H Y D -52-2.<br />
12 P rincipal M echanical Engineer, Tennessee V alley A uth o rity ,<br />
Knoxville, T enn. M em . A .S.M .E .<br />
13 A ssistant C hief Engineer, S. M organ S m ith & C om pany, Y ork,<br />
Pa. M em . A .S.M .E .<br />
F i a . 17 C u r v e s S h o w i n g R e l a t i o n B e t w e e n H e a d , K i l o w a t t<br />
O u t p u t , a n d D e f l e c t i o n , R e s u l t i n g F b o m T e s t s M a d e a t<br />
V a r i o u s B l a d e A n g l e s a n d S e v e r a l G a t e O p e n i n g s<br />
all power-efficiency curve a t an unknown scale. The tangent<br />
point of the envelope to the individual curves a t the several blade<br />
angles A to E determines the proper gate opening at these blade<br />
settings. If, as the author suggests, the peak efficiency is estim<br />
ated, the efficiency curve is then determined, as well as all<br />
necessary data for the proper operation of the unit. Thus, the<br />
advantages of a field test m ay be obtained on a unit where it is<br />
impossible to make an accurate w ater measurement. Such an<br />
index test m ay be made on any plant a t a saving in cost over a<br />
more extensive one in which a w ater measurement is made.<br />
E. B. S t r o w g e r .14 The author shows th a t a t Safe H arbor the<br />
exponent a in the equation representing the W inter-Kennedy deflection-discharge<br />
relation was determined by experiment to be<br />
0.5, this equation being Q = C X D“. W ith a equal to 0.5 it is<br />
apparent that, in the case of the Safe H arbor units, the force due<br />
to the piezometer differential varies w ith the square of the flow.<br />
Since centrifugal force varies as the square of the speed, the<br />
author was able to utilize an integrator carrying a flyball system,<br />
so arranged th a t the centrifugal force due to rotation of the integrator<br />
is opposed to the force of a tilting mercury manometer,<br />
resulting in a direct linear relationship between flow and integrator<br />
speed. If the value of the exponent had been found to be<br />
other th an 0.5, the relationship between flow and integrator<br />
speed would not be linear and the integration of the flow would<br />
have been more complicated. Possibly in this case a slight correction<br />
in the flyball system could be made to produce the desired<br />
direct relationship.<br />
Table 4 of this discussion is presented to show a number of<br />
W inter-Kennedy tap calibrations which have been made by the<br />
Gibson method of testing on 50 units in 12 different hydroelectric<br />
power plants. The exponent a for these taps is shown to vary<br />
from a minimum of 0.476 to a maximum of 0.538 and the arith-<br />
14 H ydraulic Engineer, Buffalo, N iag ara and E astern Pow er C orporation,<br />
Buffalo, N . Y . M em . A .S .M .E .
382 TRANSACTIONS OF T H E A.S.M.E. JU LY, 1941<br />
T A B L E 4<br />
R A T IN G S O F C E R T A IN W I N T E R -K E N N E D Y T A P S B Y<br />
T H E G IB S O N M E T H O D<br />
(Q = C X D “)<br />
Bo. o f<br />
P lant Unit Date of Teat Test Rune Taps Used 0 a<br />
1 1 6/ 18/31 26 - 865.9 0.529<br />
2 k 9/10/31 **5 - 1923.3 .505<br />
3 1 9/25/30 1*5 9I19.0 .503<br />
1 4/21/32 29 3 4 .1 .500<br />
k lt/22/32 29 - 34.1 .500<br />
k 3 4/23/32 29 - J ^ .l .500<br />
5 2 3/15/33 50 (Rlt-Rl) 2759.9 .508<br />
5 2 3/15/33 30 (RI1-R2 ) 3313.1 .508<br />
5 9 3/H /33 30 (Rlt-Rl) 2644.3 .518<br />
5 9 3/11/33 30 (RI1-H2) 2989.8 .518<br />
5 A 3/13/33 31 (Rlt-Ro) 557.9 .521<br />
5 A 3/13/33 31 (Rlt-Rl) 599-5 .521<br />
5 1 1 8/ 16/ 31+ 32 - 2734.0 .513<br />
6 1 8/15/33 26 (RI1-R2) 646.9 •535<br />
6 1 8/15/33 26 (HI.-R3 ) 739.1 .535<br />
6 2 8/16/33 25 (Slt-H2) 650.1 .535<br />
6 2 8/16/33 23 (RI1-R3 ) 754.9 .535<br />
6 3 8/17/33 25 (R4-R2 ) 668.1 .538<br />
6 3 8/17/33 25 (RU-R3 ) 740.3 .538<br />
6 If 8/18/33 25 (RI+-R2) 647.8 .538<br />
6 k 8/18/33 25 (Rl*-R3> 753.1 .538<br />
7 5 9/18/33 k2 (Bote 1) 2728.9 .U96<br />
7 2 10/22/35 1*7 (Bote 2) 1212.9 .521<br />
8 1 4/16/37 30 (R2-R1 ) 977.5 .508<br />
8 1 4/16/37 30 (R3-R1 ) 835.7 .508<br />
8 1 4/16/37 30 (Rlt-Rl) 686.0 .508<br />
8 2 V19/37 31 (R2-R1 ) 1012.2 .503<br />
8 2 4/19/37 31 (R5-R1 ) 893.0 .503<br />
8 2 V19/37 31 (Rlt-Rl) 710.9 .503<br />
8 3 4/21/37 30 (R2-R1 ) 1029.6 A95<br />
8 3 4/21/37 30 (R3-R1 ) 870.9 .^95<br />
8 3 lt/21/37 30 (Rlt-Rl) 732.8 A95<br />
8 k 4/23/37 22 (R2-R1 ) 1035.5 .505<br />
8 k 4/23/37 22 (R3-R1 ) 894.5 .505<br />
8 U lt/2?/37 22 (Rlt-Rl) 721.2 .505<br />
9 3 10/12/37 35 (R5-R2) 8 17 .1 .508<br />
9 3 10/12/37 35 (R5-Rlt) 941.8 .515<br />
9 8 10/15/37 35 _ 354.1 .508<br />
9 8 10/15/37 35 - 436.7 .*♦76<br />
9 5 10/ 11/38 21 (R6-Rlt) 873.1 .505<br />
9 5 10/ 11/38 21 (R6-R3) 801.8 .508<br />
9 5 10/11/38 21 (R6-R2) 724.6 .505<br />
10 2 10/ 20/37 32 (R6-R1) 1310.5 .508<br />
10 2 10/20/37 32 (R6-R3 ) 1653.7 .510<br />
10 1 10/25/37 32 (R6-R1 ) 1354.6 .508<br />
10 1 10/25/37 32 (R6-R3 ) 1704.8 .503<br />
1 1 2 11/19/37 28 2653-7 .500<br />
l i 3 11/30/37 28 - 2614.2 .505<br />
1 1 l 12/1/37 28 2628.4 .503<br />
12 k 1/ 28/38 37 - 1709.7 -1*81<br />
cuss is the performance of the prime mover or the differential<br />
pressure taps, located on opposite sides of the turbine scroll<br />
case, of wThich considerable data have been accumulated.16<br />
The W inter-Kennedy piezometer system, shown in Fig. 1<br />
of the paper, depends upon the effect of centrifugal force of the<br />
water as it flows about the vertical axis of the unit, and therefore<br />
registers as a function of the flow past the piezometer section only<br />
and is not affected by the coefficient of friction of the walls of the<br />
conduit, the angle of the turbine gates, or the head on the power<br />
plant. Whenever possible, pertinent data relating to the performance<br />
of the taps, wTith respect to these factors, have been<br />
obtained and it may be said th a t the results have been highly<br />
satisfactory.<br />
An example of the comparison of performance of the prime<br />
mover and the type 2 m eter is illustrated in Fig. 18 and Table 5<br />
16 Ref. (2) of paper.<br />
T A B L E 5<br />
P E R F O R M A N C E O F D IF F E R E N T IA L -P R E S S U R E T A P S<br />
A N D F L O W M E T E R U N D E R V A R Y IN G H E A D<br />
d R e<br />
Q A t<br />
d uced<br />
524-ft<br />
to<br />
head<br />
Servo- d In . 453-ft d F rom d e te r Q B y<br />
m o to r- m e rcu ry head cu rv e m ined flow D e p a r<br />
p isto n a t by for by m eter tu re ,<br />
stro k e, 524-ft E q u a tio n 453-ft m anom e dial, per<br />
in. head [1 2 ] 16 head te r ty p e 2 cent<br />
0 .0 0 0 .0 0<br />
2 .1 7 0 .5 5 0^48 o !4 e 330 335 + 1 .5<br />
3 .0 8 1 .19 1 .03 0 .9 9 485 480 — 1 .7<br />
3 .9 7 2 .1 5 1.8 6 1 .8 5 640 636 — 0 .7<br />
4 .8 6 3 .3 6 2 .9 1 2 .9 1 775 790 -1- 1 .8<br />
5 .7 7 5 .0 8 4 .4 0 4 .4 0 935 940 + 0 .5<br />
6 .6 7 6 .5 6 5 .6 8 5 .8 3 1070 1082 + 1 . 2<br />
7 .3 3 7 .8 5 6 .7 9 6 .9 8 1165 1175 + 0 .8<br />
8 .0 2 9 .1 5 7 .9 2 8 .2 3 1255<br />
8 .8 7 10 .6 8 9 .2 4 9 .6 0 1350<br />
8 .4 5 10 .2 0 8 .8 2 8 .9 5<br />
7 .5 6 8 .3 6 7 .2 3 7 .4 1<br />
6 .6 7 6 .7 3 5 .8 2 5 .8 3 1080<br />
5 .9 8 5 .4 0 4 .6 7 4 .6 7 970<br />
5 .3 1 4 .2 6 3 .6 9 3 .6 9 865<br />
4 .4 2 2 .7 5 2 .3 8 2 .3 8 710<br />
3 .5 3 1 .7 4 1.51 1 .3 5 580<br />
2 .2 6 0 .8 8 0 .7 6 0 .5 0 425<br />
0 .0 0 0 .0 0<br />
N o read in g s ta k en<br />
N o t e : T h e orig in al ca lib ratio n of th e flow m eter ta p s w as m a d e O ctober<br />
15, 1937, a t a gross h ea d on th e p la n t of 453 ft. T h e m e ter reg ister w as<br />
ca lib ra te d to ag ree w ith th e se d a ta . T h e check te s t b y th e index m ethod<br />
w as m a d e on D ecem ber 27, 1939, a n d th e head on th e p la n t a t th a t tim e had<br />
in creased to 524 ft.<br />
Not® 1. S\m of th ree d efle c tio n s. (E4-P2) + (X2-R2) + (X1 -R2)<br />
Bote 2 . Function of four d efle c tlc n a . 2(Xi+X2 + Rlt + T i - 2Ri - 2R2)<br />
metic average of all values shown is 0.511. While the theoretical<br />
value of the exponent is probably 0.5, in m any cases the character<br />
of the flow in the vicinity of the taps or the condition of the<br />
tap equipm ent m ay be such as to cause the value of the exponent<br />
to depart slightly from the theoretical value. A ttention is particularly<br />
called to the values of a for unit 8 of plant No. 9 where<br />
the test on one set of taps showed a value of 0.508 and the same<br />
test on another set showed a value of 0.476.<br />
I. A. W i n t e r . 16 The writer has had occasion to check the<br />
performance of type 2 and type 3 flowmeters, and finds th at<br />
both instrum ents are capable of a high degree of accuracy and<br />
reliability with, apparently, the advantages of integration<br />
slightly in favor of the type 3 meter and the advantages of<br />
indication and servicing slightly in favor of the type 2 meter.<br />
T h at p art of the paper which the writer is best qualified to dis<br />
16 Senior Engineer, U nited S tates B ureau of R eclam ation, D enver,<br />
Colo.<br />
F i g . 18 R e l a t i o n o p T u r b i n e -S e r v o m o t o r - P is t o n T r a v e l t o<br />
D i f f e r e n t i a l P r e s s u r e C o r r e c t e d t o a C o m m o n H e a d o f 4 5 3 F t
M O l'S i( >N—TU R B IN E DISCHA RG E M E T E R IN G AT SAFE HARBOR H Y D R O ELEC TRIC D EV ELO PM EN T 383<br />
F i g . 1 9<br />
C o m p a r i s o n o f F l o w m e t e r P e r f o r m a n c e f o r I d e n t i c a l T u r b i n e - S c r o l l C a s e s<br />
TABLE (i<br />
FLOW M ETER CONSTANTS AND D EVIATIO NS FOR<br />
FIG. 19<br />
Constant c in Deviation from<br />
equation average c = 972 for<br />
Unit<br />
Q = cd»•* 6 units, per cent<br />
N1 988 + 1.6<br />
N2 953 — 2 .0<br />
N3 986 + 1.4<br />
N4 968 — 0.4<br />
A6 976 + 0 .4<br />
A7 962 — 1.0<br />
of this discussion, showing the relation of turbine-servomotorpiston<br />
travel to differential deflection in inches of mercury, as<br />
observed on differential-pressure taps, installed in unit A-8 at<br />
the Boulder power plant. The curve for gross head of 453 ft<br />
was determined by Mr. Gibson, using the time-pressure method<br />
of water measurement. The curve, designated as 535-ft gross<br />
head, represents comparable measurements when reduced to a<br />
common head of 453 ft in accordance with Equations [11] and<br />
[12],16 stating th at the deflection readings m ay be reduced to a<br />
common head directly as the ratio of the common to test heads<br />
or Hr to H,. This curve shows very good agreement between<br />
the original calibration made in 1937 and the check test made in<br />
1939. The maximum deviation of these curves is about 2 per<br />
cent, which is to be expected, since there is a change in the coefficient<br />
of discharge of the turbine, due to the constant speed of the<br />
runner under varying heads and, also, there is a change in the<br />
coefficient of discharge of the turbines in the opposite direction,<br />
due to the roughness of the turbine orifices increasing in the twoyear<br />
period between tests, thereby lowering the coefficient of<br />
discharge. The index test at 535-ft head included readings of the<br />
flowmeter dial, for comparison with the observed quantities<br />
determined by the manometer readings shown in Table 5. This<br />
table shows the maximum deviation between the flowmeter dial<br />
and the manometer reading to be plus 1 '/a per cent and the average<br />
throughout the range of the curve is less than 1 per cent.<br />
This would appear to be a satisfactory performance of the meter<br />
after two years of continuous operation and without special adjustm<br />
ent for the tests.<br />
Fig. 19 of this discussion is of special interest in comparison of<br />
the discliarge-differential-pressure relation as obtained on units<br />
of the same design. This figure shows results of calibration made<br />
on six units with identical scroll cases at the Boulder power plant,<br />
each developing in excess of 115,000 hp, when operating at a<br />
head of 475 ft or higher. Three sets of flowmeter taps were<br />
calibrated by the time-pressure method of water measurement<br />
(Gibson tests), and three sets were calibrated by the index<br />
method, using one unit tested by Mr. Gibson as a basis and assuming<br />
the other units to have the same coefficient of discharge.<br />
It is not to be expected th at the performance of the taps for<br />
similar units will be in better agreement than the data shown in<br />
Fig. 19, due to the lack of exact cross-sectional area of the casings<br />
at the metering section, and the lack of similarity of the runner<br />
and turbine gates which affects the coefficient of discharge at<br />
different points around the turbine speed ring. I t is also likely<br />
th at the coefficient of discharge m ay vary as much as 5 per cent<br />
for similar turbines, due to differences in orifice areas in the<br />
runner, inherent w ith the difficulties of producing large steel<br />
castings. The change in discharge of the unit due to a change<br />
in the controlling-turbine areas m ay be accounted for by making<br />
precise calibrations of the runner, in order to apply the proper<br />
correction factor because of the lack of similarity when extrapolating<br />
test data from similar units.<br />
A study of accumulated data for various tests of turbine-flowmeter<br />
installations indicates th a t exponent a of 0.5 gives more<br />
consistent results than exponents determined by other flow<br />
means. This is in agreement with the author’s conclusion,<br />
based upon the study of results obtained by means of precise<br />
current-m eter measurements. W ith these data as precedent, it is<br />
recommended th a t exponent a, used in the flowmeter calibrations,<br />
be accepted as 0.5 and the constant for each individual<br />
run be determined on this basis w ith the general equation for<br />
the entire range of flow determined by means of weighted averages<br />
so th a t the greater degree of accuracy obtained for the<br />
higher water measurements m ay be given full weight in the final<br />
equation. The data given in Fig. 19 are determined upon this<br />
basis.<br />
A u t h o r ’s C l o s u r e<br />
In making more pertinent data available, the various contributions<br />
to the discussion constitute a valuable addition to the<br />
paper. Mr. Borden’s comments confirm the conclusions regarding<br />
the type 2 meter, as the amplitudes of the sinusoidal-error<br />
curves for the two m eters of this type investigated are of the<br />
same magnitude as for the m eter mentioned by Mr. Borden.
384 TRANSACTIONS OF T H E A.S.M .E. JULY, 1941<br />
While the amplitude for one of the type 2 m eters was found to<br />
be (0.63 + 0.38) or 1.01 per cent, th a t of the other was (1.39 +<br />
0.82) or 2.21 per cent. Based on the 90-min test period and readings<br />
a t 5-sec intervals, Mr. Borden’s meter, of the same type<br />
picked at random, apparently has an error amplitude of a t least<br />
(0.8 + 0.9) or 1.7 per cent.<br />
Regarding Mr. Bristol’s contribution, it m ay be pointed out<br />
th a t the type 1 m eter may also lend itself to efficiency-indicatingand-recording<br />
apparatus, as the electrical impulses obtained from<br />
the mercoid switches limiting the swing of the drum, Fig. 20 of<br />
this closure, could be used for the positioning of slide-wire elements.<br />
A t the same time, it should not be lost sight of th at<br />
F i g . 2 0<br />
S c h e m a t ic V i e w o f T y p e 1 M e t e r<br />
load-limit indications, based upon hydraulic input or efficiencyindicating-and-recording<br />
apparatus, are not the only two alternatives<br />
to improve operating efficiencies. Alarm devices, similar<br />
in principle, m ay be based upon power output rather than upon<br />
hydraulic input and, if need be, w ith m anual or autom atic adjustm<br />
ent for head. Still other alarm devices may take advantage<br />
of gate opening using the stroke of the servomotor piston of the<br />
gate mechanism as a prim ary element.<br />
Mr. Nagler touches upon a subject of wide interest. For many<br />
years there have been two schools of thought. One of these advocates<br />
th a t only vital machinery together w ith the very minimum<br />
of auxiliary equipm ent be installed w ith the intent of simplifying<br />
operation and keeping the investm ent as small as possible<br />
without impeding service. Those adhering to this point of view<br />
usually claim th a t many of the more modern power stations are<br />
over-equipped with auxiliary instrum ents and apparatus of all<br />
sorts, complicating operation unnecessarily. The second school<br />
and no doubt the more progressive one believes th a t the omission<br />
of certain apparatus is false economy and th a t auxiliary instruments<br />
are justified, provided they either pay their own way<br />
through increased generation or by making data available which<br />
may ultim ately lead to improved service through furnishing the<br />
basis for performance investigations and thus contribute to an<br />
advancem ent in the art. It is thought, however, th at no single<br />
policy may be advocated as, depending upon local conditions,<br />
either course may be well justified.<br />
Mr. Roberts very aptly points out th a t the metered turbine<br />
discharge will be invariably larger than the discharge determined<br />
indirectly, based upon output. Since this difference is inherent<br />
with the convex shape of unit-efficiency curves, it seems rather<br />
puzzling why any operator should object to metering.<br />
Regarding Mr. Scoville’s discussion, it is believed th at the<br />
best speed-ring design is very likely also the most favorable to<br />
the installation of Peck piezometers. The most advantageous<br />
shape of the stay vanes necessarily is such th a t it produces no<br />
vortexes which would adversely affect the turbine efficiency. It<br />
is under these ideal conditions, free of vortexes, th at piezometers,<br />
in this case those of the Peck type, are most reliable.<br />
Index testing was not particularly stressed as it had been discussed<br />
in detail in a previous paper4 to which reference was made<br />
in this paper. However, a calibration of the piezometers by<br />
means of a quantitative water-gaging method, suitable to local<br />
conditions, is thought to be essential for a complete field test.<br />
Exclusive reliance on a step-up formula from laboratory results<br />
is as yet not feasible if a high degree of accuracy is desired for<br />
input data obtained by means of piezometers. W ith duplicate<br />
units of identical m anufacture, the piezometer calibrations of at<br />
least one unit should be obtained by means of absolute water<br />
measurements, writh the taps of the other units to be calibrated<br />
indirectly by assuming the efficiencies of both to be alike.<br />
The question raised by Mr. Strowger for a possible adjustm ent<br />
on the type 3 meter for exponents differing by a small amount<br />
from 0.5 has been answered by Mr. Bristol. An adjustm ent is<br />
possible on the flyball system.<br />
The statem ent made by Mr. W inter, regarding the performance<br />
of type 2 and type 3 flowmeters is interesting, particularly<br />
so because our experience has been different in th at the<br />
type 3 m eter was found to be not only more accurate but, at the<br />
same time, needed considerably less servicing than the type 2<br />
meter.<br />
In view of the conclusions reached with respect to the magnitude<br />
of the exponent, the additional piezometer-calibration data<br />
made available by Messrs. Roberts, Strowger, and W inter are of<br />
utm ost importance. I t is believed, however, th at equal weight<br />
should not be given to each individual piezometer calibration<br />
cited. While some of the calibrations were obtained by means<br />
of graphic procedures, others were arrived at by means of analytical<br />
computations, using the method of least squares. Only<br />
the latter method is thought to be sufficiently accurate to warrant<br />
serious consideration, if a high degree of accuracy is desired.<br />
At the same time, the calibration method employed must be<br />
given some weight, together with the number of test points,<br />
magnitude of test-point dispersion inherent in the various absolute<br />
water-measuring methods, as well as local conditions. In<br />
this connection, attention m ay be drawn to the remarkable consistency<br />
of the results obtained w ith the water-gaging method<br />
employed at Safe H arbor, as it compares most favorably with<br />
th a t of any other method known at this time. W hether or not<br />
the exponent is actually 0.5 or a value very close to it may depend<br />
to a certain extent upon local conditions but there seems<br />
to be an agreement th a t for practical purposes an exponent of 0.5<br />
may be entirely adequate in most cases from a metering point of<br />
view.
Speed R egulation of K aplan T urbines<br />
By J. D. SCOVILLE,1 YORK, PA.<br />
In th is paper hydraulic-turbine speed-regulation data<br />
are presented and com pared w ith calculated perform ance.<br />
Field tests m ade a t th e B onneville and G untersville power<br />
plants are cited. T he effect o f air ad m ission during load<br />
rejection is discussed. R unaw ay-speed te sts in th e field<br />
are com pared w ith m odel data.<br />
T<br />
HE problem of speed regulation has been the subject of<br />
numerous publications, although but meager field-test data<br />
have been presented for comparison with theoretical performance.<br />
It is the purpose of this paper to present the results of<br />
tests made on the adjustable-blade or Kaplan turbines at the<br />
Bonneville and the Guntersville hydroelectric plants, two recent<br />
power projects developed, respectively, by the United States War<br />
Department and by the Tennessee Valley Authority.<br />
Kaplan turbines require special consideration in the matter<br />
of speed-regulation studies for three reasons:<br />
1 The blades of the runner change pitch simultaneously with<br />
the movement of the gates for change of load.<br />
2 The runner must frequently be placed below tail water to<br />
prevent cavitation.<br />
3 The runaway speed is higher than that of other types of<br />
turbines.<br />
Obviously, if the machine remains connected to a large system<br />
after a load change, the frequency variation cannot be calculated,<br />
since the flywheel effect of all the connected rotating machinery<br />
is one of the determining factors and is unknown. Consequently,<br />
when load is rejected from or imposed on a hydroelectric unit,<br />
its regulation must be calculated either on the basis of being connected<br />
with rotating machinery of limited extent and of known<br />
characteristics or on the basis of an isolated generator, operating<br />
on a load with no contributing W R2 effect. The tests to be described<br />
were made in such a way that only the W R1 of the rotating<br />
elements of the unit itself affected the regulation. When the<br />
load of a hydrogenerator is changed, the speed change depends<br />
upon the mechanical characteristics and condition of the governor,<br />
the flywheel effect of the turbine and generator, the hydraulic<br />
conditions at the plant, and certain hydraulic characteristics of<br />
the turbine itself.<br />
C a l c u l a t in g S p e e d D r o p<br />
The speed drop for a sudden increment of load on a unit is<br />
transition period, increases in a straight line.<br />
true, but the error is not serious.<br />
where S 'd = speed drop, corrected for pressure drop<br />
S 'r = speed rise, corrected for pressure rise<br />
AH = average pressure drop, or rise as the case may be,<br />
expressed as a decimal<br />
The maximum pressure change can be obtained ( l) a by the<br />
use of the Allievi charts or other methods. This maximum pressure<br />
rise should be used in the design of penstock and casing, but<br />
for the purpose of correcting speed regulation, the average pressure<br />
rise should be used. Hence, T is the total time of gate movement<br />
when applied to the Allievi charts. The actual change in<br />
discharge should, of course, be used to compute the change in<br />
velocity. The momentum formula is also applicable in obtaining<br />
the average pressure rise, where<br />
A H =<br />
L V<br />
TG H q<br />
This is not quite<br />
where Sr = speed rise for same load as given, rejected, and with<br />
the same time of gate movement<br />
N r — runaway speed expressed in relation to normal speed<br />
If the turbine is operating in an open flume, the regulation calculated<br />
from the foregoing formulas will apply. If there is a<br />
closed channel or penstock leading to the wheel, pressure changes<br />
will occur during the gate movement and the speed rise or drop<br />
will be increased. The average pressure change during the load<br />
ehrkiilrl Ko ncorl<br />
and<br />
For partial load changes the time of gate movement will not<br />
be in proportion. There is a “dead time” which includes the time<br />
to transmit the speed change from the flyballs to the pilot valve,<br />
to the relay valve, to the gate servomotor and, in the case of the<br />
Kaplan, to the blade servomotor, also to accelerate the oil in<br />
the piping and the mass of the gate mechanism. This should not<br />
be confused with the sensitivity of the governor. Table 1 shows<br />
approximately how the governor time varies with load.<br />
where S d = speed drop, per cent<br />
HP = load change<br />
T = time of gate movement, sec<br />
WR* = flywheel effect of rotating elements, lb-ft2<br />
N = normal speed of unit<br />
The product of this formula is an approximation, since in it the<br />
assumption is made that the input to the generator, during the<br />
'Assistant Chief Engineer, S. Morgan Smith Company. Mem.<br />
A.S.M.E.<br />
Contributed by the Hydraulic Division and presented at the<br />
Annual Meeting, New York, N. Y., December 2-6, 1940, of T h e<br />
A m e r ic a n S o c ie t y o f M e c h a n ic a l E n g i n e e r s .<br />
N o t e : Statements and opinions advanced in papers are to be<br />
understood as individual expressions of their authors and not those<br />
of the Society.<br />
T A B LE 1<br />
V A R IA T IO N O F G O V E R N O R T IM E W IT H LOAD<br />
G ate<br />
per cent<br />
100 1.5 2.0 3 .0 4 .0 6.0 8.0<br />
75 1.35 1.7 2 .5 3 .2 4 .7 6.2<br />
50 1.2 1 .5 1.9 2 .4 3 .4 4 .4<br />
25 1.05 1.2 1.4 1.7 2.2 2 .7<br />
10 0.95 1.0 1.1 1.2 1.4 1.6<br />
It is recognized that the formulas given are approximate. If<br />
a more exact method of computation is desired, the step-by-step<br />
method of computation may be used, in which the energy transfer<br />
between the water column and the runner is considered during<br />
short intervals of time during the load change. In using this<br />
method account must be taken of the relationship between the<br />
blade and gate movements and also of the lag of the blades, caused<br />
by the necessity of accelerating the blade mechanism and the oil<br />
2 Numbers in parentheses refer to the Bibliography at the end of<br />
the paper.<br />
385
386 TRANSACTIONS OF T H E A.S.M.E. JULY, 1941<br />
in the piping. For a detailed discussion of this method, reference<br />
is made to a paper (2) by Strowger and Kerr.<br />
A p p l i c a t i o n o f M e t h o d t o B o n n e v i l l e T u r b i n e s<br />
The formulas and data have been applied to the Bonneville<br />
turbines and compared with field-test'data obtained during the<br />
initial period of operation. These tests were made by the turbine<br />
m anufacturer in cooperation with the United States Army Engineers,<br />
by w7hom this project was built. At th at time, 1938, there<br />
were two K aplan turbines of 66,000-hp capacity, driving 48,000-<br />
kva generators and one 5000-hp K aplan wheel connected to a<br />
4000-kw generator. A cross section througli the station-service<br />
unit is shown in Fig. 1. The main turbines are the highest powered<br />
Kaplan wheels in the world and operate under a maximum<br />
head of 69 ft. For this reason, a substantial submergence was<br />
necessary to prevent cavitation. Fig. 2 is a cross section through<br />
the powerhouse, which shows the intake, turbine, and draft<br />
tube.<br />
W a t e r R h e o s t a t U s e d t o L o a d G e n e r a t o r<br />
During the early operating period, the transmission lines were<br />
not completed so that, in order to load the generators, it was<br />
necessary to build a water rheostat capable of absorbing about<br />
50,000 kw (3). W ith this apparatus, both load-on and load-off<br />
tests could be made w ithout the introduction of any flywheel<br />
effect other than th at of the machine itself.<br />
P r o c e d u r e f o r T e s t i n g<br />
The station-service unit W’as tested first. The blades of this<br />
runner can only be adjusted with the machine shut down. Therefore,<br />
tests of speed rise and drop wTere made at several blade<br />
positions. The blades were adjusted to a given position, the generator<br />
loaded to a predetermined output, and then the circuit<br />
breaker was tripped. The speed rise wras recorded by a Horne<br />
tachograph w'hieh was connected electrically to the generator<br />
through a transformer and w^hich, by means of a flyball-operated<br />
pen, recorded the variation of speed during the transition period.<br />
A recording Bristol pressure gage was attached to the penstock<br />
adjacent to the turbine scroll to obtain the pressure change during<br />
the gate movement.<br />
After a load-rejection test was made and the data obtained,<br />
the machine was again brought up to normal speed and voltage,<br />
and the circuit breaker closed. Since the rheostat wras in the<br />
same position, instantaneous load-on regulation data were thus<br />
obtained from the Horne tachograph and the Bristol pressure<br />
gage. Altogether 34 load rejections and additions were made, at<br />
five blade settings and several gate openings each. Fig. 3 summarizes<br />
the data. It will be noted th at while the computed speed<br />
rise checks fairly well with the test results, the speed drop from<br />
test is substantially less than the computed value. In this connection,<br />
it should be noted that, wrhen some load less than the<br />
maximum turbine output is imposed, the gates by overtraveling<br />
make available more power input to the generator to prevent
SCOVILLE—SPE ED REG U LA TION OF KAPLAN TU R B IN ES 387<br />
F i g . 2<br />
C r o s s S e c t io n T h r o u g h P o w e r h o u s e ; B o n n e v i l l e P r o j e c t<br />
speed drop; hence, the calculated value is on the safe side for<br />
all loads except for the maximum at each blade setting. Of course,<br />
it must also be realized th at the mechanical condition of the governor<br />
has considerable bearing on the actual speed change. I t<br />
should again be pointed out that, since the service-unit runner<br />
had manually adjustable blades, the tests cited were, in effect, on<br />
a fixed-blade runner a t several angles.<br />
T e s t s o n M a i n U n i t s<br />
The main units are completely autom atic Kaplans, th a t is,<br />
the blades move with the gates, taking predetermined positions<br />
for each gate opening. Tests were made on both of these units<br />
in the same manner as on the service unit, using the Horne tachograph<br />
and the Bristol recording pressure gage to obtain the necessary<br />
data. The w ater rheostat provided the load and was quite<br />
satisfactory except that, due to its location in the forebay, surges<br />
set up by the larger sudden load-on conditions caused severe<br />
power swings. More than 32,000 hp could not be taken on for<br />
this reason. Up to 60,000 hp, load rejections were made with no<br />
trouble, since the surges occurred after the rheostat was separated<br />
from the line.<br />
Fig. 4 shows the test results compared with the computed<br />
speed change and indicates fairly close agreement. The load-on<br />
regulation is relatively not quite so good as for the service unit.<br />
This can be explained by the fact th a t the blades do not move<br />
quite as rapidly as the gates and by the dead time in starting<br />
them. They are in the flat position before load is imposed and<br />
m ust open before any substantial am ount of power can be developed.<br />
The blades of the service unit were open and ready to<br />
assume load.<br />
It was found that, for large load rejections, the governor did<br />
not again come to rest without several oscillations. Fig. 6 illustrates<br />
this on unit No. 1, showing the record of speed change<br />
versus tim e taken by the Horne tachograph. As a m atter of<br />
fact, the unit a t first got completely out of governor control and<br />
the gates oscillated over their entire range and had to be stopped<br />
with the hand load limit. The reason for this is probably as follows<br />
: Since the runner is considerably submerged, after the gates
388 TRANSACTIONS OF T H E A.S.M.E. JULY, 194L<br />
F i g . o<br />
S e c t i o n T h r o u g h P o w e r h o u s e ; G u n t e r s v i l l e P r o j e c t<br />
o f t h e T e n n e s s e e V a l l e y A u t h o r it y<br />
F i g . 3<br />
S u m m a r y o f L o a d - R e j e c t i o n a n d A d d it io n D a t a<br />
F i g . 4<br />
L o a d - T e s t R e s u l t s C o m p a r e d W i t h C o m p u t e d S p e e d<br />
C h a n g e
SCOVILLE—SPEED REG U LA TION OF KAPLAN TU R B IN ES 389<br />
are closed, the runner operates as an axial-flow pump against a<br />
shutoff head equal to the barometric pressure plus the submergence.<br />
I t attem pts to pump the water between the runner and<br />
gates downward, and absorbs a large am ount of power in doing<br />
so. This causes a rapid deceleration in speed, which requires a<br />
large gate movement and initiates hunting of the governor.<br />
This condition was much improved by the installation of a lowgate-limit<br />
stop which prevented the gates closing below the<br />
speed-no-load position when load was rejected, thus preventing<br />
the speed from reaching an excessively low value.<br />
A slow closure a t the end of the servomotor stroke aids the<br />
.situation, if it is so designed as to perm it the rapid opening of<br />
the gates the instant the governor so requires.<br />
The introduction of air into the space between the runner and<br />
the gates destroys the vacuum there and reduces the braking<br />
effect on the runner so th at the deceleration after the gates are<br />
closed is not so rapid.<br />
T e s t s a t G u n t e r s v i l l e P l a n t<br />
The foregoing was illustrated during tests on the turbines in<br />
the Guntersville plant of the Tennessee Valley Authority. These<br />
are Kaplan wheels of 42,000-hp capacity under 42-ft head at<br />
69.2 rpm, driving 30,000-kva generators. Fig. 5 shows a sectiou<br />
through one of the units in this plant.<br />
As there was no w ater rheostat available, only load-rejection<br />
tests were made. The speed rise during load rejection was<br />
measured by the same Horne tachograph as was used a t Bonneville.<br />
A Bristol recording pressure-vacuum gage was attached to<br />
the turbine top plate at A, Fig. 7. A spring-loaded air valve is<br />
connected at about the same elevation and so arranged that, when<br />
the vacuum under the top plate reaches a predetermined value,<br />
the valve opens and admits atmospheric air.<br />
Fig. 8 shows the variation in pressure under the top plate at<br />
A on unit No. 3 during load rejections of from 7000 to 27,000 kw.<br />
It is shown here that, a t the higher load rejections, a vacuum<br />
of 26 in. of mercury was reached during closure of the gates but<br />
that, by the admission of air, it quickly dropped to about 8 in.<br />
A second load rejection of 27,000 kw was made on this unit,<br />
with the air valve closed, the effect being shown in Fig. 9. The<br />
vacuum reached 30 in. of mercury and then slowly dropped to a<br />
fluctuating value of 16 to 20 in., after an interm ediate sharp<br />
drop to 8 in. It is this rapid change in vacuum which sometimes<br />
causes the rotating element to jum p from the thrust bearing. The<br />
admission of air reduces this tendency considerably.<br />
F i g . 6 R e c o r d o f S p e e d C h a n g e V e r s u s T i m e ; U n i t N o . 1<br />
F ig . 7<br />
R e c o r d in g P r e s s u r e -V a c u u m G a g e A t t a c h e d t o<br />
T u r b i n e T o p P l a t e a t A<br />
F i g . 8 V a r ia t io n i n P r e s s u r e U n d e r T o p P l a t e a t A; U n i t N o .<br />
3, D u r in g L o a d R e j e c t i o n s o f 7 0 0 0 t o 2 7 ,0 0 0 K w<br />
F i g . 9<br />
E f f e c t o f L o a d R e j e c t i o n o f 2 7 ,0 0 0 K w o n U n i t W i t h<br />
A i r V a l v e C l o s e d<br />
F i g . 10 S p e e d - T im e C h a r t s F r o m T a c h o g r a p h F i g . 11 E x a m p l e o f N o r m a l S p e e d R e g u l a t io n
390 TRANSACTIONS OF T H E A.S.M.E. JULY, 1941<br />
The speed-time charts from the tachograph are shown in Fig.<br />
10, the first four diagrams being for load rejections with the air<br />
valve in normal operation and the fifth curve for load rejection<br />
with the air valve closed. I t will be noticed th a t the oscillation<br />
of speed below and above normal, after closure, is substantially<br />
less with the admission of air.<br />
Fig. 11 is given as an example of normal speed regulation.<br />
This is a small unit not comparable in size with either Bonneville<br />
or Guntersville but shows the type of speed-time curves which are<br />
desirable. These are about the character of curves which w-ould<br />
be obtained on a Francis turbine during load rejections.<br />
In the event of governor failure, when the gates are wide open<br />
and, if for some reason, they remain in th a t position after the<br />
load has been tripped off, runaway speeds can be reached.<br />
Maximum speed occurs if the gates are wide open and the blades<br />
about half open. This is an abnorm al condition, as the blades<br />
should be in the steep position a t full gate. Under the latter<br />
condition, the overspeed is much reduced. The maximum speed<br />
which can be reached occurs a t some interm ediate gate-and-blade<br />
position and is about 85 per cent of the value of full-gate—halfblade<br />
position.<br />
Overspeed tests were made on both turbines at Bonneville and<br />
the results checked within, 1 per cent and 5 per cent, the predicted<br />
values from model tests. I t was found from these tests th at runaway<br />
speed is affected by plant a, where<br />
in which<br />
H, = suction head on runner; minus if runner is below tail<br />
water, and plus if above<br />
H = head operating on turbine<br />
During the runaway-speed tests in the field, it was noticed th at<br />
there was a large opening tendency of the blades. This is a desirable<br />
feature since, a t large blade angles, the overspeed is still<br />
further reduced.<br />
C o n c l u s i o n s<br />
The problem of speed regulation of large K aplan turbines involves<br />
sareful consideration of a number of factors which are not<br />
of particular concern in the ordinary Francis turbine. I t is<br />
hoped th at this paper has illustrated some of these and th at more<br />
information will become available, as it is of interest not only<br />
to turbine and governor manufacturers but also to plant operators.<br />
D iscussion<br />
J . M . M o u s s o n . 3 This paper deals almost exclusively with<br />
load rejection. Although this phase of speed control is by no<br />
means the most im portant, it is perhaps the most spectacular.<br />
A great deal is claimed for air admission and yet, in the light of<br />
the data presented, there could perhaps be some doubt as to the<br />
effectiveness of air. Apparently, the author’s case rests on a<br />
comparison between the two tests made with and without air admission<br />
at one 42,000-hp turbine of the Guntersville developm<br />
ent under load rejection of 27,000 kw and shown in Fig. 10 of<br />
the paper. Based on these data alone, not much can be said in<br />
favor of air admission. While a 3 per cent gain in speed minimum<br />
may be observed with air, the speed maxima as well as the number<br />
of speed oscillations are identical in both tests.<br />
Believing in the beneficial effect of air and to support the<br />
author’s conclusion, some data obtained W'ith an oscillograph on<br />
No. 3 unit at Safe H arbor in 1934 are presented. This turbine<br />
is rated at 42,500 hp under a head of 55 ft and operating at 109.1<br />
rpm.<br />
A comparison of the first two graphs in Fig. 12 of this discussion<br />
shows that, whereas, a load rejection of 18,000 kw without<br />
air injection produced 3 distinct cycles of speed oscillation,<br />
only i y 2 cycles could be noted with air admission. This is indeed<br />
a striking example of the benefit of air injection, as it accomplished<br />
a 50 per cent reduction in speed oscillation and an<br />
almost equal reduction in time required to obtain speed equilibrium.<br />
From a comparison of governor performance at Bonneville<br />
and Guntersville presented in Figs. 6 and 10 of the paper, respectively,<br />
it is evident th at there m ust be either a fundamental<br />
difference in the governor design or in hydraulic conditions.<br />
Does the author attribute the improved performance at Guntersville<br />
to the gate-limit stop mentioned by him which prevents the<br />
gates from closing below speed-no-load position, together with<br />
provisions for a slow closure at the end of the servomotor stroke,<br />
so designed as to perm it the rapid opening of the gates, if required<br />
by the governor?<br />
While air injection did show very beneficial results at Safe<br />
Harbor, equally satisfactory governor-performance improvement<br />
wras obtained with a cam mechanism installed on the governor of<br />
3 H ydraulic Engineer, Safe H arb o r W ater Pow er C orporation,<br />
B altim ore, M d. M em . A .S.M .E .<br />
B IB L IO G R A P H Y<br />
1 “ Sym posium on W ater H am m er,” A .S .M .E ., 1933.<br />
2 “ Speed C hanges of H ydrau lic T urbines for Sudden C hanges of<br />
L oad ,” by E . B. Strow ger and S. L. K err, T ran s. A .S .M .E ., vol. 48,<br />
1926, pp. 209-232.<br />
3 “ W ater R h e o sta t Is T e st L oad for B onneville,” b y R . L.<br />
E arn h ea rt, Electrical W est, vol. 81, Sept., 1938, pp. 42-44.<br />
4 “ Speed R egulation in H ydroelectric P la n ts,” by W . F . Uhl,<br />
T rans. A .S .M .E ., vol. 34, 1912, pp. 379-432.<br />
5 “ E ffect of Speed R egulation an d W ater H am m er on th e D e<br />
sign of Relief V alves, Penstocks and Surge T a n k s,” Proceedings<br />
N .E .L .A ., Serial R e p o rt of H ydrau lic Pow er C om m ittee, vol. 84,<br />
1927, pp. 587-612.<br />
6 “ M echanics of H ydrau lic-T u rb in e Pressure R e gulation,” by<br />
A rnold P fau, T ran s. A .S .M .E ., vol. 52, 1930, pap er H Y D -52-4,<br />
pp. 29-45.<br />
7 “ W ater Pow er E ngineering,” by H . K . B arrow s, M cG raw -H ill<br />
B ook C om pany, In c., N ew Y ork, N . Y ., chap. 10, “ Speed and<br />
Pressure R egulatio n ,” pp. 519-543.<br />
8 “ H ydro-E lectric H andbook,” by W . P . C reager and J. D .<br />
Ju stin , Jo h n W iley & Sons, Inc., N ew Y ork, N . Y ., 1927, chap. 28,<br />
“ H ydraulic T urb in es,” b y W . M . W hite, pp. 576-658.<br />
F i g . 12<br />
S p e e d a n d G a t e - O p e n i n g C h a r a c t e r i s t i c s U n d e r L o a d<br />
R e j e c t i o n F r o m O s c i l l o g r a p h R e c o r d s
SCOVILLE—SPEED REGULATION OF KAPLAN TU R B IN ES 391<br />
from approximately 2.5 per cent to approximately 10 per cent<br />
below 15 per cent gate.<br />
After the tests on unit No. 3, all of the governors at Safe H arbor<br />
were equipped with a cam of this type. Subsequent experience<br />
in operation has fully justified their installation. It is believed<br />
that, while the method of air injection is satisfactory, its<br />
application as a continued feature to operation is not economical,<br />
due to the large reserve of compressed air required for emergency.<br />
The use of a cam mechanism or some other mechanical feature<br />
accomplishing the same results as described is preferable.<br />
F ig . 14<br />
C a m M o u n t e d o n C o m p e n s a t i n g C r a n k o f Sa f e H a r b o r<br />
G o v e r n o r<br />
unit No. 3, introducing a large speed drop for the light-load<br />
range. The third graph in Fig. 12 shows the speed oscillation<br />
obtained with this device under load rejection of 17,000 kw.<br />
This cam device is mounted on the compensating crank, Figs.<br />
13 and 14 of t his discussion, in such a manner as to contact with<br />
the equalizing mechanism at a gate opening of 15 per cent on the<br />
closing stroke, causing an upward push on the speed rod and<br />
opening the pilot valve in the direction to open the gates. While<br />
the gates are still rapidly moving in the closing direction, forces<br />
are thus set up in the governor system opposing the closing motion,<br />
resulting in a dissipation of stored kinetic energy in the<br />
moving mass by the time the gates reach zero opening. The<br />
gates at once assume speed-no-load position with no further oscillation.<br />
In effect the cam increases the inherent speed drop<br />
F. N a g l e k .1 The type of comparisons made by the author<br />
are not encountered as frequently as they should be for the good<br />
of the hydroelectric-power field. These comparisons form an<br />
excellent answer to the criticism th at the basic speed-change<br />
formula, given a t the beginning of the paper, is only approximate.<br />
It is very definitely, however, a workable approximation,<br />
certainly as accurate as necessary for the purpose in question.<br />
Three of the four variables in th at formula, th a t is, WR2 X<br />
N2, divided by HP, are constant for any particular unit and<br />
regulation depends principally upon them. It is, ordinarily,<br />
much simpler to speak of them as the regulating constant, since<br />
they represent the ability of a unit to regulate the speed. Expressed<br />
in the inverted form immediately preceding, they ordinarily<br />
vary between 5,000,000 and 10,000,000. It is of special<br />
interest th a t certain sizes and speed ranges of units m ust have<br />
additional flywheel effect added to the generator to raise this<br />
regulating constant to a feasible figure, whereas, other types,<br />
particularly in the high-speed and large-capacity ranges, inherently<br />
possess a regulating constant sometimes larger than is<br />
necessary. This is dictated by generator design.<br />
Putting this regulating constant in the denominator of the<br />
author’s basic speed-drop formula leaves the speed regulation<br />
dependent upon the governor tim e T. Modern governor<br />
guarantees mean little or nothing beyond the statem ent that, if<br />
the regulating constant is a certain amount, if the unit is disconnected<br />
from the load, and if a certain governor time is used,<br />
certain figures, which have practically nothing to do with the<br />
regulation of a system, can be computed.<br />
Usually, the governor time, T, ranges somewhere between 2<br />
sec and 10 sec. M ost governors are purchased on the basis th at<br />
they will close the gates in from 2 to 4 sec. Some of the largest<br />
operating companies, thereafter, normally adjust all of their<br />
governors so th a t they cannot close in a shorter time than 7 or 8<br />
sec. Here we have a situation carried over from the days of<br />
isolated units, entirely comparable with insisting on a whip<br />
socket on the automobile dashboard. Bids m ay be compared on<br />
the basis of a few per cent difference in speed-change guarantees<br />
in the face of the realization, should thought be given to it, th at<br />
these figures will probably be doubled in actual operation and<br />
probably with definite improvement to the system frequency.<br />
The writer would suggest that, in the future, consideration be<br />
given to a simple statem ent of the regulating constant as an indication<br />
of the influence of the unit on system regulation and a<br />
statem ent of the guaranteed minimum governor tim e as an indication<br />
of the governor capacity. The absurdity of present-day<br />
governor guarantees will be somewhat reduced thereby.<br />
Referring to the formula for average pressure rise immediately<br />
preceding Table 1, a somewhat closer approximation of the<br />
pressure rise and pressure drop, through the ranges usually experienced<br />
in practice, is obtained by adding 10 per cent to AH<br />
for pressure rises and subtracting 10 per cent from AH for pressure<br />
drops. This brings the approximate formula fairly closely<br />
in line with Allievi.<br />
4 Chief Engineer, C anadian A llis-Chalm era, L td ., T oronto,<br />
C anada. Life M em ber A .S.M .E .
392 TRANSACTIONS OF T H E A.S.M.E. JULY, 1941<br />
I t is significant th at the author’s charts of speed regulation<br />
show no results with load thrown on. This is logical because, in<br />
actual plant operation, except in connection with isolated units,<br />
as on a mining load, it is seldom th a t a unit ever has to meet<br />
sudden large increases in load. I t is of interest th at the author<br />
made tests with the load thrown on. The writer has used a<br />
water rheostat similarly, but was rather intrigued with the fact<br />
that, whereas, a load of, say 20,000 kw could be dropped instantly<br />
by pulling a switch, the same load was not picked up if<br />
the switch was immediately reclosed. There seemed to be a<br />
definite lag in the ability of the water rheostat to pick up the<br />
load it had just dropped. It would be of interest to have the<br />
author’s comments on whether he observed any similar action in<br />
connection with load thrown on.<br />
In conclusion, the writer would again emphasize the desirability<br />
of some change in the attitude of both purchasers and manufacturers<br />
in making governor guarantees. The formulas presented<br />
by the author have served their purpose for about 30<br />
years, during which time probably 90 per cent of our turbinehorsepower<br />
capacity has become connected to the larger systems.<br />
Those systems operate the year round with 1 or 2 per cent maximum<br />
speed change. The units cannot receive large increases<br />
in load and, if they lose their load, they are disconnected from<br />
the system and have no influence on it. I t m ay logically be<br />
concluded, therefore, th at governor guarantees up to 25 or 30<br />
per cent speed change are a clumsy attem pt to effect a set of regulating<br />
conditions which m ay be much more simply and accurately<br />
expressed by regulating constant and governor time. Progressive<br />
purchasers are already looking at these basic figures,<br />
and greater progress would probably be made in the hydraulicturbine<br />
field if more attention were directed toward them rather<br />
than to outmoded and academic speed-regulation tables.<br />
J. F. R o b e r t s . 6 This paper covers quite fully the various<br />
factors which m ust be coordinated in order to obtain satisfactory<br />
regulation of K aplan-type turbines. In the case of the Guntersville<br />
turbines of the Tennessee Valley Authority with which the<br />
w riter was particularly interested, it was possible to vary both<br />
the rate of movem ent of the runner blades and of the wicket<br />
gates, and, thus, in the field, determine th a t combination which<br />
would result in the most satisfactory combination.<br />
As finally adjusted, the wicket gates were set to open and close<br />
in from 8 to 10 sec with the runner blades opening in about 8 sec,<br />
but requiring about 40 sec to close. While faster operation of<br />
the wicket gates is possible, it was found th a t on such a large<br />
system the frequency of the system varies slowly even for a sudden<br />
loss of 30,000 kw. More rapid operation of the wicket gates<br />
imposes heavy loads and shocks on the wicket-gate mechanism<br />
w ithout apparent improvement to the system-speed regulation.<br />
I t also causes greater pressure variations, particularly in the<br />
draft-tube water column which, while possibly not dangerous to<br />
the structures, are unpleasant and, in this case, apparently unnecessary.<br />
I t is interesting to note th at the author’s tests demonstrated<br />
it to be almost impossible to obtain a flat blade angle of the runner<br />
a t full wicket-gate opening and runaway speed. This means<br />
th at on future projects it m ay be possible to make an appreciable<br />
saving in generator costs, since generators designed for full gate<br />
and flat-blade runaway m ust be designed for about 270 per cent<br />
of normal speed, as compared w ith about 200 per cent speed for<br />
full gate and steep pitch on the runner blades.<br />
E. B. S t r o w g e r . 6 The author has presented test data on the<br />
6 P rincipal M echanical Engineer, Tennessee V alley A uth o rity ,<br />
K noxville, T enn. M em . A .S.M .E .<br />
6 H ydraulic Engineer, T he N iagara F alls Pow er C om pany,<br />
Buffalo, N . Y. M em . A .S.M .E.<br />
F ig . 15<br />
Not*.<br />
Initial load demand at T<br />
final load demand at “ B"<br />
E x c e s s E n e r g y C a u s e d b y L o a d C h a n g e<br />
speed regulation of Kaplan turbines which are of value to hydraulic<br />
engineers engaged in water-power development, since<br />
but little if any such data have been published in the technical<br />
press to date. His approach has been through an approximate<br />
equation for reasons stated in the paper. In discussing the<br />
m atter, he has referred to a paper (2) by S. L. K err and the writer,<br />
dealing with the step-by-step method of computing speed rise or<br />
speed drop for sudden load changes, in which a rational approach<br />
has been attem pted and in which application of this method has<br />
been made to Francis turbines with good results. The writer<br />
therefore wishes to discuss the possibility of the application of<br />
this step-by-step method to Kaplan turbines.<br />
Let us first consider a few simple but fundamental relationships.<br />
Referring to Fig. 15 of this discussion, assume an isolated<br />
unit operating on a load with little or no connected Wr2 so that<br />
the only steadying influence on the speed would be the flywheel<br />
effect of the generator rotor. Suppose a load change takes place,<br />
as shown in Fig. 15 (a), the load dropping from A to B, and let us<br />
assume th at the length of penstock and of draft tube is negligibly<br />
small. The turbine load then decreases approximately as a<br />
straight line with respect to .time, as the governor closes the turbine<br />
gates to the new position of load demand. In this case, the<br />
excess rate of energy transfer from the penstock to the turbine<br />
above th a t demanded is gradually decreased as the governor<br />
moves the gates toward the new position and a rise in speed of<br />
the rotating parts takes place. This rise in speed actually makes<br />
the gates overtravel so th at for a short time a deficiency of energv<br />
is transm itted to the rotating parts, followed by another small<br />
amount of excess energy, after which the travel of the gates has<br />
become damped to the extent th at equality is again established<br />
between rate of energy supply and rate of energy demand.<br />
In the case assumed, i.e., with the unit operating on an isolated<br />
load having no Wr2, the excess energy produced in the penstock<br />
must be balanced by the deficiency of energy, before the<br />
initial speed is re-established. It should be noted that, if no<br />
governor adjustm ent is made, the speed of the unit will not return<br />
exactly to its initial value, but the final value of speed will<br />
be slightly higher, depending upon the load dropped and the in-
SCOVILLE—SPEED REG U LA TION OF KAPLAN TU R B IN ES 393<br />
lierent speed-drop setting of the governor. This can also be seen<br />
in Figs. 6,10, and 11 of the paper. The speed rises to a maximum<br />
value at the end of time T, as shown in Fig. 15 of this discussion.<br />
This maximum is not reduced by the subsequent overtravel of<br />
the gates either for loads off or for loads on. The overtravel,<br />
however, brings the speed back approximately to the normal<br />
value, after the maximum speed is reached faster than would be<br />
the case with no overtravel.<br />
Fig. 15 (b) shows a similar load change with the introduction<br />
o ithe element of governor dead time, and indicates th at dead<br />
time increases the excess energy which m ust be absorbed by the<br />
rotating parts and, therefore, results in a greater change in speed.<br />
Now, passing to the usual installation where a physical length<br />
of penstock and draft tube m ust be considered, as illustrated in<br />
Fig. 15 (c), the rate of change in energy transfer from runner to<br />
rotating parts is not uniform and, consequently, the turbine<br />
load plotted with respect to tim e is not a straight line. In fact,<br />
the power produced by the turbine actually rises a t the beginning<br />
of gate movement and then decreases as shown. T hat part<br />
of the excess energy shown double-hatched in Fig. 15 (c) is caused<br />
arises as to how to evaluate the integral in these equations.<br />
For turbines w ith appreciable length of penstock, the evaluation<br />
of this integral depends upon the w ater hammer produced, the<br />
relation between runner efficiency and gate opening, the relation<br />
between runner efficiency and speed, and the rate of gate motion.<br />
For open-flume settings and where the load varies in a straight<br />
line with respect to time, the integral m ay be closely approxim<br />
ated in the case of Francis runners by<br />
where HP = initial load in horsepower for speed rise and final<br />
load for speed drop<br />
Consequently, for open-flume settings, these relations become<br />
for Francis wheels<br />
F i g . 16<br />
S a m e D i a g r a m a s F ig . 15 (c), E x c e p t G o v e r n o r D e a d<br />
T im e I s C o n s i d e r e d t o B e Z e r o<br />
b y the water hammer, produced in the penstock and draft tube,<br />
due to the destruction of velocity, and m ay be a rather large percentage<br />
of the total excess which must be absorbed. The speed<br />
of the isolated unit changes, as shown on the diagram.<br />
Now let us consider Fig. 16 of this discussion, which presents<br />
the same diagram as shown in Fig. 15 (c) except th a t the governor<br />
dead time is considered to be zero. The energy absorbed by a<br />
rotating mass in changing the speed from Ni to N2 may be expressed<br />
by<br />
The expression 550 J'q Pdt represents the total energy delivered<br />
from the water column to the runner during the gate closure and<br />
may be equated with the foregoing expression, representing the<br />
energy absorbed by the rotor. If the resulting equation is then<br />
solved, we obtain the following expressions for percentage of<br />
speed rise and percentage of speed drop.<br />
It should be noted th at these expressions contain the same<br />
variables as the first equation given by the author but th at the<br />
expression is radically different in form. The question now<br />
In the case of Francis runners, the step-by-step method of<br />
calculation lends itself to the evaluation of this quantity, because<br />
the power input to the runner can be calculated for each small<br />
interval of time during the gate motion. However, for Kaplan<br />
turbines, as pointed out by the author, there m ay be a lag of the<br />
motion of the blades behind th at of the gates, which changes the<br />
steady-state gate-opening-efficiency relationship and, consequently,<br />
the quantity considered cannot be evaluated for this<br />
type of turbine w ithout determining the effect of the lag and<br />
other factors which influence the efficiency of energy transfer<br />
from the w ater column to the runner during the gate movement.<br />
Possibly this effect can be determined experimentally for a number<br />
of Kaplan turbines and an average coefficient obtained. In<br />
the case of the Bonneville main unit, the w-riter attem pted to do<br />
this for the full-load point on the curve of the author’s Fig. 4,<br />
and obtained the relation t/JJr Pdt = 0.39 X HP T. This<br />
showed, in the case of this particular Kaplan, that, even with<br />
some water-hammer energy present, less than 50 per cent of the<br />
energy represented by the product of HP and T was effective in<br />
speeding up the rotor during the load rejection. This means<br />
th a t the area under a straight-line curve of horsepower versus<br />
time represents too much energy transfer and shows the error,<br />
in one particular case, of the assumption made in deriving the<br />
approximate equation, i.e., a straight-line variation of these<br />
quantities during the transient.<br />
To compare a typical Francis speed-rise problem with th at of<br />
the Kaplan turbine, the writer made some computations for a<br />
Francis turbine having about 690 ft of penstock and obtained<br />
the figure of 0.61 as the coefficient of the quantity {HP ■T) in<br />
Equation [4], This is of the right order because for an openflume<br />
setting of a Francis turbine, it would be reasonable to expect<br />
to obtain a coefficient of about 0.5.<br />
As a check on the rationality of the equations presented here,<br />
the writer determined the coefficient of the product (HP T) in<br />
the case of the speed-drop problem of the Bonneville service<br />
unit shown by the author’s Fig. 3. A coefficient was determined<br />
by using the test data for a load of 5000 hp and then, since this<br />
unit had manually adjusted blades, the speed-drop points for<br />
75 per cent gate and 50 per cent gate were computed using this<br />
coefficient, but applying estim ated values of power for the two<br />
gate positions. A curve of speed drop was obtained, which<br />
checked the experimental curve at the part-load points within<br />
about 2 per cent and the shape of the curve was thus much closer
394 TRANSACTIONS OF THE A.S.M.E. JULY, 1941<br />
to the test curve of Fig. 3 of the paper than that of the computed<br />
curve of Fig. 3.<br />
In conclusion it may be possible to apply the step-by-step<br />
method to Kaplan turbines by obtaining a graphic record of the<br />
movement of both the guide vanes and the runner blades during<br />
load changes and with the use of complete turbine characteristic<br />
curves, by evaluating the energy transfer from water column to<br />
rotor. As an alternative it may be possible to obtain average<br />
values of the coefficient as described for wheels of a given manufacturer<br />
or of a given design for load rejections at say 100 per<br />
cent gate, 75 per cent gate, and 50 per cent gate and these data<br />
would enable one to predetermine the speed-rise power curve<br />
similar to Fig. 4 of the paper for any projected installation, knowing<br />
of course the size of the unit, governor time, W r2, etc. These<br />
suggestions are made in an attempt to apply a method of computation<br />
which takes into account the fundamental relations of<br />
energy transfer which take place during the load change between<br />
the penstock and the rotor.<br />
A u t h o r ’s C l o s u r e<br />
Mr. Mousson’s discussion substantiates the author’s contention<br />
as to the advantage of admission of air to a Kaplan turbine<br />
during load rejection. Fig. 14 shows an alternate method used<br />
at Safe Harbor to prevent the secondary speed and gate swings.<br />
It is believed, however, that this method is not as good as that of<br />
air admission. The author knows of at least one occasion where<br />
one of the Safe Harbor units jumped from the thrust bearing<br />
during load rejection. Air admission would eliminate that<br />
trouble. It should be pointed out that air is injected under<br />
pressure at Safe Harbor, whereas atmospheric air would serve the<br />
same purpose. In spite of about 15 ft of submergence of the<br />
runner, atmospheric air was readily taken into the No. 3 unit at<br />
Bonneville and produced speed-change diagrams during load rejection<br />
exactly similar to those illustrated in Fig. 10 of the paper<br />
which were obtained on one of the Guntersville units. This is<br />
evidence that the secondary swings in speed which occurred on<br />
unit No. 1 were eliminated by the use of air on unit No. 3. It is<br />
believed that this answers Mr. Mousson’s question.<br />
Figs. 3 and 4 show speed drop as well as speed rise for load<br />
change on one of the Bonneville main units and on the service<br />
unit. Mr. Nagler states that there seems to be a definite lag in<br />
the ability of the water rheostat to pick up the load it had just<br />
dropped. The curves of Figs. 3 and 4 indicate somewhat less<br />
speed drop than was computed. There may be something in<br />
Mr. Nagler’s statement. However, this was about aa close to<br />
instantaneous load on regulation as could be obtained on the<br />
tests.<br />
The author agrees with Mr. Roberts that it is highly desirable<br />
to be able to vary the rate of blade and gate travel independently.<br />
Mr. Strowger wants to attack the problem of speed change by<br />
computing the water-hammer energy during gate closure and<br />
adding it to the normal energy put into the runner during this<br />
period. He is, of course, quite right in this as the energy which<br />
produces speed change is the sum of these two minus the increased<br />
generator windage and friction. However, as pointed<br />
out in the paper, there is a variable lag in the blade movement<br />
in addition to the dead time of the governor. Lack of certain<br />
and definite information makes it difficult to apply Mr. Strowger’s<br />
method on Kaplan turbines.
D evelopm ent of the A utom atic A djustable-<br />
Blade-Type Propeller T urbine<br />
B y R. V. T E R R Y ,1 N EW PO R T NEW S, VA.<br />
In th is paper th e d esig n a n d te s tin g o f a u to m a tic a d <br />
ju sta b le-b la d e-ty p e propeller tu r b in e m o d e ls are tr ea te d ,<br />
follow ed by a n a n a ly sis a n d d isc u ssio n o f th e m o d e l-te st<br />
resu lts. F our in sta lla tio n s are d escrib ed , a g g r eg a tin g a<br />
rated o u tp u t o f a b o u t 44,000 h p in five u n its . O p era tin g<br />
experien ce a n d r esu lts w ith field u n its are co n sid ered .<br />
M en tio n is a lso m a d e o f fu r th e r d e v e lo p m en t w ork n o w in<br />
progress. In c o n c lu sio n a su m m a ry is g iv en o f th e p r in <br />
cipal fea tu res o f th is n ew ty p e h y d ra u lic tu r b in e .<br />
T<br />
I n t r o d u c t i o n<br />
H E idea of adjusting the pitch of the blades of hydraulicturbine<br />
runners to suit the load is relatively old. Such a<br />
runner was described2 in 1867. For about 25 years development<br />
has been in progress on the Kaplan adjustable-blade propeller<br />
type turbine. T hat type has reached a high degree of<br />
perfection in employing an oil-pressure system, associated with<br />
the governor-pressure system, to operate the runner blades in<br />
synchronism with the gates. From the m any published articles<br />
on adjustable-blade turbines, the advantages of varying the<br />
pitch of the blades are well known. The principal advantages are<br />
as follows:<br />
(a) Increase in capacity above normal.<br />
(b) Sustained efficiency over the larger part of the load range.<br />
(c) Reduction of the minimum head a t which the turbine will<br />
develop power.<br />
M) Greater stability of operation, particularly at low and intermediate<br />
loads.<br />
In 1928, the author began studies for an adjustable-blade type<br />
of runner wherein the blades would move autom atically with<br />
changes in flow through the runner, as well as with changes of<br />
speed and head. I t was his rather radical idea3 so to pivot the<br />
blades with reference to their centers of pressure th a t they would<br />
tend to adjust themselves to the most efficient angle for each<br />
condition of gate opening and head for constant-speed operation.<br />
I t was early found th at the blades m ust be pivoted considerably<br />
ahead of their centers of area. In fact this was predicted<br />
from a study of the characteristics of airfoils and hydrofoils.<br />
In order th a t the blades might have a tendency to adjust them <br />
selves autom atically and w ith minimum operative moments, it<br />
was also found desirable to pivot them slightly ahead of their<br />
centers of pressure. This resulted in a tendency for the blades<br />
to open a t all times, a t least in normal operation at or near the<br />
best efficiency conditions. As the test program progressed, certain<br />
definite trends and characteristics were found which influenced<br />
subsequent designs. As the development gradually unfolded,<br />
unproductive leads were encountered, as well as new and<br />
desirable characteristics disclosed.<br />
It is assumed th at those interested are somewhat familiar with<br />
turbine design and with some of the term s used in aeronautics<br />
dealing w ith airfoils. In Fig. 1 (upper left) is given typical velocity<br />
diagrams for an average blade section. Diagram Ui, ci, wt<br />
is for the inlet edge of the blade, while diagram ui, ci, w< is for<br />
the discharge edge. Terms Wi and u)2 represent the respective<br />
velocities relative to the blade and wa is the vectorial average of<br />
Wi and W2. The function ui = ui is the tangential velocity of the<br />
blade. Terms Ci and Ci are the absolute velocities a t inlet and<br />
discharge, respectively.<br />
M o d e l T e s t s<br />
Surprisingly satisfactory results were secured with the first<br />
models built and tested in 1930, which encouraged further experimentation.<br />
Other groups of tests have been conducted at intervals<br />
for the last 10 years. Altogether, more than 200 tests<br />
have been made on about 30 different models, using about 15<br />
sets of blades, some of which were altered as the test program<br />
progressed. The model tests were made on 16V2-in-diam runners<br />
under heads varying from 9 to 12 ft, in the Newport News H y<br />
draulic Laboratory.<br />
1 H ydraulic Engineer, N ew port News Shipbuilding and D ry D ock<br />
C om pany, N ew port News, V a. M em. A .S.M .E .<br />
2 U. S. P a te n t No. 67,994, issued to O. W . Ludlow in 1867.<br />
3 U. S. P a te n ts N os. 1,858,566 and 1,907,466. *<br />
C ontributed by th e H ydraulic D ivision and presented a t the<br />
A nnual M eeting, N ew Y ork, N . Y ., D ecem ber 2-6, 1940, of T h e<br />
A m e r ic a n S o c ie t y o f M e c h a n ic a l E n g i n e e r s .<br />
N o t e : S ta te m e n ts a n d o p in io n s a d v a n c e d in p a p e rs a re to be<br />
u n d e rsto o d as in d iv id u a l expressions of th e ir a u th o rs a n d n o t th o se<br />
of th e S ociety.<br />
395<br />
A typical blade section is also shown in Fig. 1, with chord C<br />
and mean camber c. The angle of attack a is the angle the inflowing<br />
w ater w, makes with the chord C. The center of pressure<br />
is shown a t point y which is at distance n from the leading<br />
edge of the blade, measured along the chord. The pivotal axis is<br />
shown by point x which is a t distance to from the leading edge of<br />
the blade. The equivalent total force on all the blades is represented<br />
by F, while T represents the axial component of F or the<br />
hydraulic thrust. The “hydraulic m om ent,” tending to open the<br />
blades, is Fa, a being n — to. The hydraulic moment is balanced<br />
by a “reactive m om ent” Rb, tending to close the blades, produced<br />
by a balance piston in the runner hub acting on the blades with<br />
lever arm b, R being the total piston load.<br />
An analysis of tests on airfoils similar in shape to turbine blades<br />
shows th at the distance of the center of pressure (point y in Fig.<br />
1) from the leading edge in proportion to chord length or n /C<br />
reaches a minimum value a t a moderate angle of attack a, approximately<br />
the most efficient angle of attack in the case of a<br />
turbine blade. The curve of n /C plotted against angle of attack
396 TRANSACTIONS OF T H E A.S.M.E. JULY, 1941<br />
is fairly flat for several degrees variation in a from the value giving<br />
minimum n/C. B ut on either side of th a t value the center of<br />
pressure travels downstream, Fig. 2. A further analysis of the<br />
characteristics of airfoils shows th a t the location of the center of<br />
pressure varies with the proportional mean camber c/C. This<br />
F i g . 3<br />
R u n n e r M o d e l W i t h S i x B l a d e s ; 1 6 ‘/ 2- I n . S iz e<br />
variation has been found to be fairly accurately expressed by the<br />
formula<br />
Thus, a blade section w ith a mean camber of 8 per cent would<br />
have its center of pressure located a t 35 per cent chord, and<br />
should be pivoted a t about 33 per cent chord. The proper camber<br />
of turbine blades gradually decreases from the hub to the<br />
periphery w ith a resulting change in the location of the center of<br />
pressure. We are primarily interested in the location of the center<br />
of pressure of the blade as a whole rather than in its location for<br />
each individual section. I t has been found more practicable in<br />
producing simple blade shapes to place the axis further downstream<br />
near the hub and further upstream near the periphery,<br />
producing an over-all result as though detail considerations were<br />
given to pivoting each section upstream from its individual center<br />
of pressure. The runner blade is usually divided into four<br />
annular sections of approximately equal discharge and consideration<br />
given to the average result.<br />
Fig. 3 shows a typical runner model w ith six blades, while<br />
Fig. 4 shows a sectional view of the model, and Fig. 5 a typical<br />
layout of a runner blade.<br />
As m ay be expected, it was found th a t blades in echelon,<br />
grouped around a common hub, and enclosed in a housing, do not<br />
act exactly as they do in the case of single airfoils tested in infinite<br />
space. The echelon arrangement, together with the reactive<br />
nature of a turbine runner, tends to move the center of pressure<br />
somewhat downstream. This tendency has been found to<br />
increase with the camber, number of blades, and w ith blade width
TER R Y —D EV ELO PM EN T OF AUTOM ATIC A D JU STABLE-BLA DE-TYPE PR O PELLER T U R B IN E 397<br />
or overlap. An idea of the degree of movement of center of pressure<br />
may be had from Table 1.<br />
T e s t s f o r M o d e l D e v e l o p m e n t<br />
The test procedure for developing a model was as follows:<br />
1 Design the blades, based upon data secured from previous<br />
tests and from the consideration of the characteristics of airfoils.4<br />
2 Test the model for speed, power, and efficiency a t several<br />
blade positions, usually six, with the blades locked.<br />
4 “A erodynam ic C haracteristics of Airfoils— V I,” N ational A dvisory<br />
C om m ittee for A eronautics, T ech. R eport N o. 315, 1929.<br />
TABLE 1 COMPARISON OF ADJUSTABLE-BLADE R U N N ER S<br />
FROM TESTS ON MODELS 16»A IN . IN DIAM<br />
Relative blade camber /------------Normal-------- —* Small<br />
Number of blades........................................ ......4 5 6 6<br />
Type no................................................................164 165B 166B 179D<br />
Best unit speed, N i..................................... ......200 180 160 160<br />
Specific speed, N a.............................................. 160 140 120 120<br />
Pivot point, per cent of chord:<br />
At h u b ..............................................................34<br />
At periphery...................................................24<br />
37<br />
27<br />
40<br />
30<br />
36<br />
21<br />
A verage............................................................29 32 35 28.5<br />
Mean camber, per cent of chord:<br />
At h u b ..............................................................7 .7 8 .7 8 .4 7.1<br />
At periphery.................................................. 2 .3 3.1 3 .6 2 .5<br />
Center of press, per cent of chord:<br />
At mean flow line.......................................... 31.0 34 37.0 30.5<br />
From airfoil tests........................................... 30.0 31 3 2 .5 30.5<br />
Discharge angle at periphery, deg...............14.5 16 18.5 18.5<br />
Chord angle at periphery, deg................ ......17 19.5 22 21<br />
Hub diameter, per cent of outside<br />
diameter........................................................... 40 42.5 45 45<br />
Blade width (plan) -f- blade pitch:<br />
H ub............................................................. ......0.88 1.06 1.09 1.09<br />
Periphery................................................... ......0.77 0.88 1.00 0.91<br />
Blade area, per cent of annular area. . . 95 114 128 117<br />
Head range (approx), ft............................ ......10-40 25-55 40-70<br />
3 Unlock the blades so th at they are free to assume a balanced<br />
position a t different operating conditions. Calibrated springs<br />
with various amounts of compression are used to produce reactive<br />
moments tending to close the blades.<br />
4 Plot moment diagrams, one for each of several speeds, as<br />
illustrated in Fig. 6.<br />
5 Study the required reactive moments for best efficiency<br />
operation, best gate-blade relation, for each speed, and reduce<br />
them to a constant speed for variable-head operation. In analyzing<br />
the moments, gravity effects are also considered.<br />
6 P ut the model in autom atic operation w ith a suitable reactive<br />
moment w ith the wicket gates under governor control,<br />
driving an electric dynamometer, to determine its behavior under<br />
starting and runaway-speed conditions, as well as under normal<br />
power-producing conditions.<br />
7 Finally, determine the movement of the center of pressure<br />
from the test data. This is done primarily from a consideration<br />
of the measured hydraulic moments and from the calculated<br />
thrust. However, some blades are tested with two locations of<br />
the axis and the center of pressure computed from the two sets<br />
of hydraulic-moment data.<br />
F i g . 6<br />
M o m e n t D ia g r a m F r o m a M o d e l T e s t<br />
F i g . 5<br />
T y p ic a l L a y o u t o f a n A d j u s t a b l e R u n n e r B l a d e<br />
From Fig. 5, it m ay be seen th a t the general shape of blades<br />
employed w ith these adjustable runners is quite simple. A<br />
cylindrical section approximates th a t of a portion of a parabola,<br />
with which uniform deceleration of the absolute whirl component<br />
of the w ater is theoretically obtained. The maximum camber is<br />
placed a t about one third the chord distance from the leading<br />
edge of the blade. The face and back of the blades over most of<br />
their area are each produced by a system of straight lines (for<br />
horizontal sections) meeting a t a common point, a t the runner<br />
axis for the face and near the axis for the back. The blades are<br />
laid out for an interm ediate angular position, usually for 60 per<br />
cent open position. The pitch is made uniform on each radial<br />
line. However, the inlet edge of the blade is extended a t the hub,<br />
resulting in greater pitch a t th a t point. Cambers much greater<br />
than those theoretically required from a consideration of velocity<br />
diagrams are selected to allow for the bending effect of the water<br />
streams before and behind the runner.<br />
As a result of tests to date the following general conclusions<br />
m ay be draw n:<br />
1 The blades tend to follow the gates, therefore tend to<br />
open as gates open and vice versa.<br />
2 W ith proper blade shape and pivoting, a reasonably constan<br />
t reactive moment may be used for operation a t constant<br />
speed at or near best efficiency, for the various gate openings<br />
and for varying unit speeds as the head is changed.
398 TRANSACTIONS OF THE A.S.M.E. JULY, 1941<br />
3 At low unit speeds, high heads for constant speed, the required<br />
reactive moment for best efficiency operation decreases<br />
somewhat as the load increases, that is, with a constant reactive<br />
moment, the blades move less than required for perfect synchronism<br />
with the gates.<br />
4 At high unit speed, low heads, the blades tend to move<br />
more than is required for the best gate-blade relation.<br />
5 When properly pivoted, the blades have a strong tendency<br />
to open when starting the wheel from rest. This tendency is<br />
greatest with 4-blade, and decreases with 5- and 6-blade runners.<br />
6 The blades have a strong tendency to open if the runner<br />
runs away at constant head. This effect is least with 4 blades<br />
and greatest with 6 blades. The hydraulic moment at runaway<br />
speed usually ranged from 4 to 5 times normal with the models<br />
tested.<br />
At the present stage of development, it is not considered practicable<br />
or even possible to explain all the various characteristics<br />
by mathematics and hydrodynamics. The problem is too complicated,<br />
considering the numerous variables. However, a discussion<br />
of a few concepts is perhaps in order.<br />
1 Why should the reactive moment required for best efficiency<br />
be fairly constant for varying loads and heads? To start with, the<br />
turbine drives an electric generator at a constant speed. The<br />
tangential velocity is relatively high compared with the variable<br />
axial velocity. The result is a fairly constant relative velocity<br />
wa, which is the one that produces the predominant dynamic<br />
effect on the blades. For best efficiency under the various operating<br />
conditions, the angle of attack is naturally about the same,<br />
resulting in approximately the same center-of-pressure location.<br />
A constant relative velocity, together with a fixed angle of attack<br />
and center of pressure, would, of course, create a constant hydraulic<br />
moment.<br />
2 Why should the moment increase as the gates are opened?<br />
As the gates open, the angle of attack increases. This causes a<br />
slight movement of the center of pressure downstream, and an<br />
increase in the normal force, resulting in increased moment. This<br />
change in conditions overbalances the reactive moment and the<br />
blades move open. However, as the blades move open, the angle<br />
of attack and normal force decrease and the center of pressure<br />
moves upstream until a new balanced condition is reached.<br />
3 Why do the blades open when starting the turbine? With<br />
the runner at rest the water from the gates impinges directly<br />
against the runner blades at a very large angle of attack. Under<br />
this condition the center of pressure is located well downstream<br />
with reference to the axis of the blade. Because the blade is<br />
stationary and the angle of water deflection large, the force on<br />
the blade, per unit volume of water and head, is relatively high.<br />
This results in a large opening moment that overbalances the designed<br />
reactive moment at a relatively small gate opening. With<br />
4-blade runners, the blade area is considerably less than the<br />
annular area between the hub and periphery. The blades of<br />
such runners have a very strong tendency to open when starting<br />
and the blades will go wide open. With 5-blade runners, and particularly<br />
those with 6 blades, the overlap of the blades may be<br />
such that the leading edge of one blade obstructs the impingement<br />
of water on the next blade. This results in less movement<br />
of the center of pressure and a smaller opening moment. Consequently,<br />
the blades of such runners do not open as much when<br />
starting.<br />
4 Why do the blades open when the wheel runs away?<br />
Under this condition two more or less opposing actions take<br />
place. One consists of a reduction in the angle of attack which<br />
tends to reduce the blade force and moment. The other consists<br />
of an increase in the relative velocity, which tends to increase<br />
the force and moment approximately as the square of that velocity<br />
or speed. The latter action is predominant, resulting in<br />
rapidly increasing moment, particularly at the higher speeds.<br />
Here again there is a considerable change in characteristics as the<br />
number and overlap of the blades is increased. The opening<br />
tendency is stronger with the larger number of blades.<br />
Tests were also made to determine the effect of the shape of<br />
the throat ring below the axis on the power and efficiency characteristics<br />
as well as on the hydraulic moment on the blades.<br />
These included spherical, cylindrical, and intermediate shapes.<br />
As was expected, the spherical shape had an effect in moving the<br />
center of pressure downstream as the blades approached their<br />
open position. It was found better to make the ring cylindrical<br />
for 4-blade runners and somewhat curved for the 5- and 6-blade<br />
runners. At the higher specific speeds, it was found that, for a<br />
given diameter of runner, the reduction in power caused by<br />
spherical ring more than offsets any gain in efficiency at the largest<br />
blade angles. When efficiency was plotted against power,<br />
the curve for a cylindrical ring was slightly above that for a<br />
spherical ring near full load. At low and intermediate loads, no<br />
difference was found.<br />
The model tests have established a relation between the center<br />
of pressure and the axis of the runner blade which should direct<br />
attention to the advantages in utilizing the minimum force to<br />
move any type of adjustable-blade runner. When the blades are<br />
pivoted too far downstream, large moments are produced, particularly<br />
at runaway speeds. If the axis of the blade is moved upstream,<br />
closer to the center of pressure, the force needed to move<br />
the blades is smaller and the machine is safer from the standpoint<br />
of overspeed. However, without the use of antifriction<br />
bearings, there is a possibility of encountering the combination<br />
of blade-and-gate opening for maximum runaway speed and the<br />
generators have to be designed for such possibility.<br />
With the new type of adjustable-blade turbine and with the<br />
blades properly pivoted ahead of the center of pressure on roller<br />
bearings, the theoretical maximum runaway speed cannot conceivably<br />
be encountered. The maximum runaway-speed combination<br />
occurs at high gate opening with the blades nearly closed<br />
and may be from 2.3 to 2.5 times the normal speed, or even higher.<br />
With the blades allowed to open fully the runaway speed is held<br />
within 1.8 to 2 times normal, the overspeed for which standard<br />
generators are designed. Also the force required to move the<br />
blades is only a small fraction of that needed when the blades are<br />
not appropriately pivoted with respect to the center of pressure.<br />
' I n s t a l l a t i o n s<br />
By 1934, it was considered that sufficiently satisfactory results<br />
had been obtained in the laboratory to justify an experimental<br />
field installation. Arrangements were made at that time with<br />
the Kanawha Valley Power Company to furnish a 14-ft 9-in.<br />
adjustable runner instead of a fixed-blade runner at the Marmet<br />
plant6’6 near Charleston, W. Ya. This unit wras placed in operation<br />
in 1935, and has been in continuous use since that time. It<br />
is rated 7600 hp under 23 ft head at 90 rpm and has developed<br />
about 8500 hp under that head. With the exception of the runner<br />
and a few minor differences, the adjustable-blade-runner unit<br />
is identical with the adjacent fixed-blade-runner turbine rated<br />
6600 hp. Two other turbines of essentially the same design have<br />
since been put into operation for the same company, one in 1937<br />
at the Winfield plant7 rated 9150 hp at 26-ft head and one in<br />
1938 at the London plant, both near Charleston, W. Va.<br />
6 “ D esign F eatu res of London and M arm et H ydro D evelopm ents,’'<br />
by P hilip Sporn and E . L. Peterson, Power P lant Engineering, vol.<br />
41, 1937, p p . 80-87.<br />
6 “A utom atically A djustable P ropeller T u rb in e,” by R . V. T erry,<br />
Power, vol. 81, 1937, pp. 97-99.<br />
7 “ Design and O perating F eatu res of th e W infield H ydro D evelopm<br />
e n t,” by P hilip Sporn and E. L. P eterson, Power P lant Engineering,<br />
Feb., 1940, pp. 36-42, 46.
TKRRY—D EV ELO PM EN T OF AUTOM ATIC A D JU STABLE-BLA DE-TYPE PR O PELLER T U R B IN E 399<br />
The M armet turbine represented a rather large step-up in<br />
physical dimensions and power from the model, especially for<br />
equipment of such radical departure from past practice. The<br />
areas of the water passage were about 115 times and the power<br />
ab o u t300tim esthoseofthem odel. A bladeoftheM arm etrunner<br />
is shown in Fig. 7, being machined in a 120-in. lathe. The general<br />
location of the blade axis w ith reference to the blade area is well<br />
blades of the runner and the balance piston was of the rack-andgear<br />
sector type, each rack being guided in two bearings. The<br />
eight rack bearings cause some friction which creates a lag in the<br />
blade position with reference to the wicket gates and results in<br />
some differences between increasing and decreasing loads,<br />
amounting to about 10 per cent in gate opening or about 3 deg<br />
in blade position. These differences are not considered im portant.<br />
Field efficiency tests of those installations were not made because<br />
F i g . 7<br />
B l a d e f o r 1 4 -F t 9 - I n . M a r m e t R u n n e r<br />
F i g . 9<br />
S e c t i o n a l V i e w o f 9 1 5 0 - H p W i n f i e l d U n i t<br />
F ig . 8<br />
B a l a n c i n g A d j u s t a b l e - B l a d e R u n n e r f o r t h e<br />
W i n f i e l d P l a n t<br />
illustrated. Another interesting feature illustrated is the relatively<br />
large size of the blade boss w'hich is im portant in obtaining<br />
the proper strength of connection between the trunnion and blade.<br />
This is made possible by the use of an integral labyrinth seal.<br />
Fig. 8 shows the Winfield runner being balanced in the shop<br />
and Fig. 9 shows a sectional view of the Winfield unit.<br />
With these three installations, the connection between the four<br />
of the difficulty of measuring the water accurately. However,<br />
the average blade position with respect to gate opening closely<br />
follows the best relation determined from the model tests. The<br />
power output plotted against gate opening approximates a<br />
straight line, which is a desirable characteristic.<br />
The fourth installation was made during the last year a t the<br />
Austin Dam plant of the Lower Colorado R iver A uthority and<br />
consists of two units, each rated 10,000 hp, 200 rpm, 61 ft head.<br />
Preliminary field-test results show a maximum efficiency of 92<br />
per cent.<br />
I n s t a l l a t i o n a t A u s t i n D a m P l a n t<br />
This installation m ay be considered typical and will be briefly<br />
described by reference to Fig. 10. The six runner blades are of<br />
cast steel with integral trunnions pivoted on roller bearings in a<br />
cast-steel hub. Each blade is pivoted on three roller bearings,<br />
two radial bearings, and a thrust bearing. The runner hub is<br />
divided into two compartm ents. The lower compartm ent, which<br />
is packed with grease, carries the bearings and blade-connecting<br />
mechanism. The upper com partm ent consists of a bronze-lined
400 TRANSACTIONS OF T H E A.S.M.E. JULY, 1941<br />
F i g . 10<br />
C r o s s S e c t i o n T h r o u g h A u s t i n D a m T u r b i n e<br />
cylinder to house the reactive piston, the integral stem of which<br />
projects downward through the lower com partm ent for connection<br />
to the blades by spider, links, and levers. The hub is also<br />
provided w ith top and bottom covers of cast steel, the top one<br />
being arranged for connection to the shaft. The stroke of the<br />
piston and spider limits the travel of the blades to 25 deg. The<br />
piston rod is guided in two bronze-bushed bearings made equal<br />
in diam eter so th a t the reciprocation of the piston will not<br />
create a pumping action on the grease in the lower hub compartment.<br />
The space under the balance piston communicates with<br />
the draft tube through ports in the piston hub, hollow piston rod,<br />
and ports in the lower cap of the runner. Reactive pressure on<br />
top of the piston, tending to close the blades, is supplied from<br />
the headwater, through strainers and a pressure-reducing valve,<br />
to the bearing housing, thence through radial holes in the shaft<br />
and downward through the hollow shaft. This supply is combined<br />
with the water supply to the rubber bearing. The pressure supply<br />
is maintained constant by the pressure-reducing valve, the adjustm<br />
ent of which m ay be easily altered in the field as desired.<br />
Grease is supplied to the runner hub through a pipe connected<br />
internally to the piston rod and extending upw ard through the<br />
generator and turbine shafts. This pipe also actuates the blade<br />
position indicator which is mounted above the generator. The<br />
top end of the pipe is provided w ith a swivel connection for greasing<br />
the runner hub while the turbine is running.<br />
The runner hub is packed with grease during assembly. A<br />
heavy-bodied adhesive grease is used. I t is expected th a t some<br />
w ater will enter the hub. This is, however, made difficult by the<br />
use of the heavy-bodied grease and by the use of a labyrinth-type<br />
seal at the blade bosses. The roller bearings are of the 15 to 18<br />
per cent chromium type of corrosion-resisting steel with a Rockwell<br />
C hardness of about 55.<br />
In addition to creating the reactive moment, the piston in the<br />
upper part of the runner hub also serves as a very effective dashpot.<br />
The inflow to and outflow from both sides of the piston must<br />
pass through restricted openings. This dashpot action helps to<br />
steady the blade movement as well as to lim ittherate of movement.<br />
The mechanism in the runners of all installations is simple and<br />
rugged. The blades are pivoted only slightly upstream from their<br />
normal centers of pressure, approximately 1 per cent of the<br />
nominal diam eter of the runner. During normal operation<br />
this results in rather small moments about the blade axes, and<br />
relatively small forces on the internal mechanism, tending to reduce<br />
wear. The mechanism is, however, designed to carry<br />
forces about 5 times their normal value. This is done to provide<br />
for the larger forces which m ay occur during runaway speed<br />
and to take care of a hypothetical condition of having the total<br />
moments of all the blades concentrated on the mechanism of one<br />
blade.<br />
Externally, all units have the same general appearance as<br />
those employing runners with fixed blades. The generators,<br />
governors, shaft couplings, and external mechanism of the turbines<br />
are of standard construction.<br />
O p e r a t i n g E x p e r i e n c e<br />
The five units now in operation have been in continuous service
TER R Y —D EV ELO PM EN T OF AUTOM ATIC A D JU STABLE-BLA DE-TYPE PR O PELLER T U R B IN E 401<br />
since installation of from 6 months to 5 years. No trouble of any<br />
consequence has occurred with any of these units. Highly satisfactory<br />
operating results have been obtained. All units govern<br />
very well. The three K anawha Valley Power Company units<br />
are of the autom atic type remotely controlled, and handle well<br />
under th at type of operation.<br />
As proved by operating experience and as m ay be seen from a<br />
study of the model-blade moment diagram shown in Fig. 6, the<br />
blade movement with respect to gate movement is inherently<br />
stable. For a given reactive moment and head, there is a rather<br />
definite balanced position of the blades for each gate opening.<br />
When the gates are moved by the governor, the blades become<br />
unbalanced until a corresponding movement of the blades restores<br />
the balance. The blades do not overtravel because such a<br />
movement sets up a restoring moment. For slow movement of<br />
the gates during normal governing, there is enough friction in<br />
the blade mechanism to prevent unnecessary movement of the<br />
blades. For large changes in load in either direction, the blade<br />
movement follows the gate movement rapidly with very little<br />
lag.<br />
Perfect synchronism between gate-and-blade position, such as<br />
to result in the highest possible efficiency a t all loads and heads,<br />
is not obtained. However, since blade adjustm ent is autom atic<br />
for both head and load, the perfection of adjustm ent is considered<br />
adequate.<br />
When any load up to full load is kicked off the unit, the blades<br />
close approximately as fast as the gates. This is a desirable condition<br />
of operation because, when the gates are closed, the runner<br />
tends to screw up in the water and thus to lift the entire rotor.<br />
The blades being in their flat or nearly flat position greatly reduce<br />
the lifting effect.<br />
Lifting effect on shutdowns is also reduced by the admission<br />
of air through the crown plate. I t is customary to provide each<br />
unit with two rather large air valves of different types. One is of<br />
the check type which is forced open by an adjustable cam as the<br />
gates close. T hat valve takes air through a pipe from the outside<br />
of the powerhouse and is also used for venting the turbine<br />
during normal operation under load a t low gate openings. The<br />
other air valve is a spring-loaded check, taking air from the<br />
turbine pit, and is adjusted to open a t about 15 ft of water<br />
vacuum. It opens only when the dropping of load produces a<br />
high vacuum under the crown plate.<br />
With the air valves in operation and the runner blades reaching<br />
their closed position almost simultaneously with the gates, a<br />
highly satisfactory shutdown results. Practically no bump can<br />
be felt from the top of the turbine or generator when full load is<br />
dropped.<br />
The turbine runners and throat rings have proved to be remarkably<br />
free of pitting from cavitation. This rather gratifying<br />
experience is attributed to several factors. The models were<br />
subjected to extensive cavitation studies. The runner blades are<br />
of simple curvature. The position of the gates and the sectional<br />
curvature of the top of the throat ring were selected so th a t the<br />
gates do not project over the curved part of the ring when in<br />
their full-load position. This tends to reduce inflow vortexes and<br />
to produce a more uniform velocity distribution.<br />
D e v e l o p m e n t W o r k i n P r o g r e s s<br />
Additional studies and experimental work are in progress with<br />
a view toward further improvement and toward the extension of<br />
the upper head range. This also includes additional cavitation<br />
studies and further studies toward improvement of mechanical<br />
details.<br />
Among the improvements in mechanical details might be mentioned<br />
the arrangement, shown in Fig. 11, for the autom atic admission<br />
of free air to the draft tube at the runner cap. This is for<br />
F i g . 11<br />
S e c t i o n a l V i e w S h o w in g A r r a n g e m e n t f o r A u t o m a t ic<br />
A d m is s io n o f F r e e A i r t o D r a f t T u b e<br />
the purpose of giving smoother operation in cases where the<br />
water leaves the runner with a considerable whirl. Such an arrangement<br />
is advantageous in preventing vibration in the case<br />
of runaway speed or operation at greatly reduced heads, high<br />
values of unit speed. W henever a vortex forms a t the runner<br />
cone in the center of the draft tube, a vacuum is produced, even<br />
with high tail water, such as to suck in free air through the<br />
tubular passages in the piston rod and turbine shaft. These<br />
passages term inate with check valves near the upper end of the<br />
turbine shaft. The check valves are adjusted so th a t they will<br />
adm it air to the draft tube only when a strong vortex occurs at<br />
the runner cone.<br />
C o n c l u s i o n<br />
In conclusion, a sum mary of the principal features of the new<br />
type of hydraulic turbine m ay be given as follows:<br />
1 Blade-operating mechanism is entirely separate from the<br />
governor oil-pressure system and is controlled by the turbine<br />
water supply. No extra governor equipm ent is required and all<br />
oil pipes are eliminated.<br />
2 Blade-adjusting mechanism is concentrated in the turbine<br />
proper, reducing interdependence of turbine, generator, and<br />
governor design.<br />
3 Turbine and generator shaft couplings are of standard construction,<br />
the same as for fixed-blade turbines.
402 TRANSACTIONS OF T H E A.S.M.E. JULY, 1941<br />
4 For normal blade adjustm ent, forces and moments required<br />
to actuate the blades are a minimum due to location of<br />
pivot point and use of roller bearings.<br />
5 Blades open when starting turbine, tending to protect the<br />
main thrust bearing.<br />
6 Blades open a t runaw ay speed, appreciably reducing overspeed<br />
and cost of generator.<br />
7 Use of heavy grease in hub versus heavy oil.<br />
8 Inherent tendency for blades to adjust themselves to the<br />
condition of operation.<br />
9 Blades follow gates rapidly on quick shutdowns, greatly<br />
reducing lifting effect and forces on the blades.<br />
10 Provision for autom atic suppression of vibration with<br />
free air in the case of overspeed.<br />
D iscussion<br />
C. S. A d a m s .8 The information contained in this splendid<br />
paper is evidence in itself of the great contribution th at has been<br />
made to the progress of hydraulic-turbine design by the author.<br />
The amazing ingenuity of the inventive engineer should not be<br />
perm itted, however, to overshadow the tremendous am ount of<br />
m ental and physical energy which has been expended by this<br />
m an and his associates throughout the last 10 years in order to<br />
develop and perfect the original conception of the Newport<br />
News type of autom atic adjustable-blade propeller turbine.<br />
I t was the w riter’s opportunity and pleasure, when serving as<br />
designing engineer for the Lower Colorado River Authority<br />
under Clarence McDonough) general m anager and chief engineer<br />
for the Authority, to have been perm itted to study the<br />
development of this turbine through the laboratory stage;<br />
to have viewed the first commercial installations on the K anawha<br />
River in W est Virginia; to have designed the Austin hydroelectric<br />
power plant around the two most powerful of these turbines<br />
yet built; and to have installed these two turbines and to have<br />
placed them into successful operation. Through each of these<br />
* Frederic R . H arris, In c., C onsulting Engineers, N ew Y ork,<br />
N . Y .; form erly D esigning Engineer, Low er C olorado R iver A u<br />
th o rity , A ustin, Tex.<br />
stages of development and application, the hydraulic engineer<br />
can find th at this water-operated autom atic adjustable-blade<br />
turbine has definitely proved a successful reality.<br />
The writer will endeavor to sketch briefly some of the items of<br />
special interest which concern the designer, constructor, and<br />
operator of power stations th at embody this new type of turbine<br />
as well as to present a few brief facts relative to the Austin installation.<br />
The invention of the Newport News type of adjustable-bladepropeller<br />
turbine has furnished the designing hydroelectric engineer<br />
with another useful tool which can be applied advantageously<br />
to assist in the solution of problems th at occur in the design<br />
of hydroelectric power systems where the conservation and<br />
the efficient use of water in the system must be effected to the<br />
utm ost. The Newport News turbine permits a simple, neat,<br />
compact, and relatively inexpensive installation to be provided<br />
a t hydraulically proper locations in order to supply energy and<br />
power to small “off-peak” loads with a relatively high over-all<br />
plant efficiency.<br />
To cite a practical application, each of the two Austin turbines<br />
is rated at 10,000 bhp a t 200 rpm under a net head of 61 feet.<br />
This 20,000 bhp of adjustable-blade propeller turbine is an effective<br />
part of the Lower Colorado River Authority’s total of 175,000<br />
bhp which is now installed in four hydroelectric power plants<br />
on the Colorado River of Texas. In the ultim ate design of this<br />
system, it was considered necessary to install the 20,000 bhp of<br />
adjustable-blade turbines a t Austin so th at the 155,000 bhp of<br />
Francis turbines along w ith over 2,000,000 acre-ft of firm water<br />
storage could be so correlated and coordinated th at the over-all<br />
operating efficiency of the entire system under commercial<br />
loads could be at the highest possible value. A thorough study<br />
of the entire project with respect to hydrology, reservoir characteristics,<br />
and commercial power sales disclosed the definite<br />
necessity for an adjustable-blade installation.<br />
The physical conditions a t the Austin site rendered the installation<br />
of powder machinery difficult. An unusually high tailwater<br />
condition during floods and the long length of spillway<br />
required for the dam in order to accommodate flood flows, coupled<br />
with the fact th at the entire power plant had to be placed in
TER R Y —D EV ELO PM ENT OF AUTOM ATIC ADJUSTABLE-BLADE-TYPE PR O PELLER T U R B IN E 403<br />
the channel of this major stream, made necessary the most compact<br />
installation th a t could be developed. Figs. 12 and 13 of<br />
this discussion, showing the transverse and longitudinal crosssections<br />
through the power station will enable this compactness<br />
to be observed.<br />
The Newport News turbines lent themselves admirably to a<br />
neat and compact setting. An im portant factor in this particular<br />
power-plant design, in so far as the entire system was<br />
concerned, was th at the demand capacity obtainable w ith the<br />
given diameter of runner was at a maximum with the adjustable-blade<br />
type. The design also perm itted the use of 60,000-<br />
ft-lb torsional gate-shaft Woodward hydl-aulic governors in a<br />
pleasant-appearing cabinet form, as m ay be seen in Figs. 14<br />
and 15 of the interior of the powerhouse, and a minimum of<br />
space was required on the generator-room floor and in the turbine<br />
pits for the governing installation.<br />
The model tests on the Newport News runner revealed th at<br />
both a lesser runaway speed and a lower starting hydraulic thrust<br />
existed on this type of runner than on the Kaplan type of corresponding<br />
characteristics and size. These features resulted in a<br />
saving in the electric generators together with an improvement in<br />
operating conditions. The author in pivoting each of the runner<br />
vanes slightly upstream from its center of pressure, has perm itted<br />
these favorable characteristics to become innate properties of<br />
this turbine.<br />
The incorporation of these turbines into the detailed design<br />
of the Austin power station entailed but slight additional difficulties,<br />
as compared with the Francis type or the fixed-blade-propeller<br />
type of turbines. The provision for the supply of w ater to the<br />
blade-actuating mechanism is essentially the only additional<br />
service th at must be supplied. The governors and generators<br />
are essentially the same as they would be for fixed-blade units,<br />
although a hollow generator shaft is required for operating the<br />
blade position-indicating device atop the direct-connected exciters<br />
and for the admission of grease into the hub of the runner.<br />
The installation of the Austin hydraulic-turbine units proceeded<br />
without delay. The assembly and, consequently, the<br />
dismantling of the units is a relatively simple operation and,<br />
since the runners were completely assembled in the shop prior<br />
to the field installation, a minimum am ount of field-assembly<br />
work was required. No more working space in the powerhouse<br />
was required for erecting or dismantling these complete generating<br />
units than for comparable fixed-blade units. The governors were<br />
F i g . 14 I n t e r i o r V i e w o f A u s t i n P o w e r h o u s e , S h o w i n g T o r <br />
s io n a l G a t e -S h a f t H y d r a u l ic G o v e r n o r C a b i n e t s i n F o r e <br />
g r o u n d<br />
F i g . 15<br />
A n o t h e r V i e w i n t h e P o w e r P l a n t S h o w i n g t h e T w o<br />
1 0 ,0 0 0 -B h p H y d r a u l ic T u r b i n e s<br />
shipped completely assembled in their housings, and it was only<br />
necessary to set them upon their anchor bolts and connect the<br />
servomotor connecting rods to the torsional gate shafts.<br />
After the two units had been installed, a short operating period<br />
for each unit a t about one-half rated speed enabled the Kingsbury<br />
thrust and guide bearings of the umbrella type on the Westinghouse<br />
generators and the water-lubricated rubber guide bearings<br />
of the turbines to be “run in” and to determine th at the units<br />
were physically completed and also properly installed and serviced.<br />
At the end of this “run-in” period, each of the units<br />
was loaded with a water rheostat in order th at it might be put<br />
through a vigorous and thorough mechanical testing before<br />
being placed into commercial operation, and in order th at the<br />
operation of the runners could be observed and adjusted to insure<br />
performance characteristics comparable with those of the final<br />
laboratory model.
404 TRANSACTIONS OF THE A.S.M.E. JULY, 1941<br />
Load was applied to each generating unit in increments of<br />
about 1000 bhp; the unit was operated for about 5 min, then<br />
the circuit breaker was opened to remove the load; and the<br />
governor closed the regulating gates at the rate of 3 sec for a<br />
full gate stroke. As the units were started up after each run and<br />
as loads were increased to a maximum of 5 per cent above the<br />
rated capacity, it could be noticed that the blades opened almost<br />
to the fully open position, just as the regulating or wicket gates<br />
began to open, but the blades then closed slowly to the proper<br />
position. When the unit was disconnected from the bus, the<br />
blades closed at almost the same instant that the 3-sec governor<br />
closed the regulating gates. The quick-opening characteristic<br />
lessened the hydraulic thrust on the main bearing caused by the<br />
inrush of water on starting the unit, whereas the quick-closing<br />
characteristic denoted the sensitivity and fine mechanical balance<br />
of the individual vane bearings and linkage mechanisms<br />
for each of the six runner vanes of the 102-in-diam runner.<br />
After the thorough initiation and adjustment with the aid of<br />
the water rheostat, the two units were placed in commercial<br />
operation on April 1, 1940. Although the flywheel effect or W R2<br />
of the Austin generator and turbine rotors is small and the flywheel<br />
effect of the rotating machinery of the connected loads<br />
is not great, the generating units governed perfectly. The<br />
units governed so well that the frequency-controlling equipment<br />
for the entire system will be moved to the Austin power plant.<br />
The Austin plant also serves as the dispatching point for the<br />
distribution of power to the Authority’s customers which include<br />
the Texas Power and Light Company, Houston Lighting and<br />
Power Company, San Antonio Public Service Company, the<br />
City of Austin, 3500 miles of rural-electrification lines, and the<br />
Authority’s own power district which is approximately the same<br />
area as the combined states of Massachusetts, Connecticut,<br />
Rhode Island, and New Jersey.<br />
These two units have now been operating satisfactorily and<br />
continuously for 8 months. Outside of an occasional replacement<br />
of breaking pins on the wicket-gate mechanism, the units<br />
have functioned perfectly and on occasion have operated continuously<br />
at full rated load for a period of two weeks.<br />
In July, 1940, each of the turbines was given a thorough preliminary<br />
field test in order to determine its performance characteristics.<br />
The Gibson method was used for determining the<br />
quantity of water used at each test point and all observations and<br />
computations were made essentially in conformance with the<br />
A.S.M.E. Power Test Code _for Hydraulic Prime Movers. The<br />
units were tested between 9 a.m. and 8 p.m. with commercial<br />
loads. A reasonably flat horsepower-efficiency curve was obtained<br />
for each unit, but the author considered that the characteristic<br />
curves could be improved to conform more closely<br />
with the model curves by making a minor alteration to the<br />
pressure-regulating device which actuates the servomotor piston<br />
of the vane-position mechanism. This minor alteration has now<br />
been made and the load versus blade-angle relationships for each<br />
Austin turbine corresponds with those of the homologous adjustable-blade<br />
model over the entire range of load. The turbines<br />
will be given a final test in the near future in order to determine<br />
their performance curves.<br />
The maximum over-all efficiency of one turbine, as determined<br />
from the preliminary field testing, occurred at 85 per cent of the<br />
rated capacity at a value of 92 per cent, whereas, the other turbine<br />
attained a peak efficiency of 90 per cent at 85 per cent of the<br />
rated capacity. The mechanical operation, the balance of the<br />
units, the functioning of bearings, and the operation of the complete<br />
generating units, as revealed during the field tests are all<br />
considered at or even above par with the other modem hydraulicturbine<br />
installations at the Authority’s power plants.<br />
With the development, success, and the experience gained by<br />
the author in the design, manufacture, installation, and opera^<br />
tion of the existing automatic adjustable-blade turbines, the<br />
hydraulic-turbine field should now be clear for the production of<br />
larger-capacity wheels of the same type. It is anticipated, moreover,<br />
that the talents and energies which have been utilized in the<br />
development of this successful invention will enable further advances<br />
to be made in the hydraulic-turbine as well as in related<br />
fields.<br />
F. N a g l e r . 9 The author deserves a great deal of credit,<br />
as much for initiating a new policy of engineering presentation<br />
as for the extremely interesting type of turbine development<br />
indicated. In past years, few engineers were either willing or<br />
free enough from commercial considerations to be entirely open<br />
with engineering uncertainties, field troubles, and the like, to<br />
permit that frankness on which the most rapid progress may be<br />
realized.<br />
The magnitude of the actual installations described in this<br />
paper is particularly noteworthy. The writer and J. F. Roberts<br />
did some work on automatically adjustable blades during the<br />
early ’20’s. This work attempted to get around the influence<br />
of variable friction, by hanging the blades on knife-edges instead<br />
of letting them revolve in the bearings. The idea was that they<br />
would be positioned by a. combination of centrifugal force and<br />
water flow. The work was discontinued because of assumed insurmountable<br />
obstacles connected with weakness of structure<br />
and the wide variables introduced by changing friction, by variable-velocity<br />
conditions as the head changed, and, of course,<br />
by the variable velocity and direction imposed by guide-vane<br />
operation. The author, apparently, has worked out a feasible<br />
solution of these major difficulties.<br />
It would be appreciated if the author would comment a little<br />
further on the life of the antifriction bearings on the runnerblade<br />
pivots. We know that tremendous forces exist on these<br />
blades; forces, as pointed out in a paper10 by J. D. Scoville, of a<br />
magnitude sufficient to lift the entire rotor of generator and turbine.<br />
These forces come practically as a blow, Fig. 911 in the<br />
Scoville paper.<br />
In a current paper12 H. Styri brought out the point that, to<br />
insure commercial life of any ball or roller bearing, there must<br />
be an oil film present between roller and race. It is probably<br />
not particularly difficult to maintain such a film for a bearing<br />
that rotates, but the bearings in the hub of the runner are<br />
practically stationary throughout their life. The writer would<br />
expect certainty of breakdown of the oil film and inevitable<br />
peening action under such conditions. Undoubtedly, the field<br />
experience to date is the most effective answer to a question as<br />
to life of antifriction bearings under this duty. Further comment<br />
from the author on this point would be appreciated.<br />
When a piston interconnecting and influencing the position of<br />
the blades is added, as shown in Figs. 9, 10, and 11 of the paper,<br />
and external control of the pressure behind that piston taken<br />
outside the shaft, are we not approaching closely an externally<br />
adjustable blade, the connection of which to the guide-vane motion<br />
would require a relatively minor addition in the form of<br />
links or cams?<br />
It would be exceedingly interesting, if the author would show a<br />
comparison between the shape of the efficiency curves of the<br />
automatically adjustable-blade construction, and the Kaplan<br />
and the fixed-blade types.<br />
* Chief Engineer, Canadian Allis-Chalmers, Ltd., Toronto, Canada.<br />
Life Member A.S.M.E.<br />
10 “Speed Regulation of Kaplan Turbines,” by J. D. Scoville,<br />
Trans. A.S.M.E., vol. 63, 1941, pp. 385-394.<br />
11 Ibid, Fig. 9, p. 389.<br />
12 “Friction Torque in Ball and Roller Bearings,” by H. Styri,<br />
Mechanical Engineering, vol. 62, no. 12, December, 1940, p. 886.
T ER R Y —D EV ELO PM EN T OF AUTOM ATIC ADJUSTABLE-BLADE-TYPE PR O PELLER T U R B IN E 405<br />
The use of air valves, as applied to this type of construction,<br />
is of particular interest to the writer since, a t the time of presentation<br />
of this device,13 but slight attention was paid to its<br />
utility. Several major field accidents would have been prevented<br />
had this device been adopted more generally. This is<br />
particularly true on the axial-flow types of turbines, where such<br />
positive uplifts as are reported by Scoville10 are encountered.<br />
There are some instances reported of uplift w ith the Francis<br />
turbines, but the writer has not personally observed them. It<br />
would be of interest if the author would comment on this particular<br />
feature.<br />
propeller, the blades follow. W hen the gates open on the<br />
controllable-pitch propeller, a cam on the gate shaft or connected<br />
to the gate servomotor controls the blade position. The shape<br />
of this cam is determined by index tests in the field so th a t the<br />
blades are moved positively to the best position. As the head<br />
changes, a new blade-gate relationship is required. This alteration<br />
can be taken care of by an adjustm ent in the cam position<br />
which requires only a m inute or so, the turbine remaining in<br />
normal operation.<br />
J. F. R o b e r t s . 14 The description in the paper of the various<br />
tests and model and field experiments which have gone into<br />
developing the autom atic adjustable-blade-type propeller tu r<br />
bine is both interesting and enlightening. The results should be<br />
very gratifying to the author and should result in a real saving<br />
to the users of this type of turbine.<br />
The author’s remarks concerning the use of air valves are interesting.<br />
The writer has always been a strong advocate of<br />
ample size of air valves, both for fixed- and adjustable-type propeller<br />
turbines and for Francis turbines. The point where the<br />
air is adm itted to propeller-type runners has been found quite<br />
im portant and, in several cases, a change in the point of air admission<br />
has resulted in a material improvement. The writer<br />
has found that, if the air is adm itted to a propeller turbine a t the<br />
lowest point in the head cover, just above the top of the runner<br />
hub, the greatest benefit can be secured. In two cases it was<br />
found possible to get air into the turbine at the lower point when<br />
it would not take in air near the upper part of the head cover,<br />
due to a positive pressure existing at th at point.<br />
I t has also been found unnecessary to use a cam or linkage to<br />
open the air valve at definite gate openings and close it a t other<br />
gate openings since, both on Francis- and propeller-type tu r<br />
bines, the air is apparently beneficial whenever a vacuum exists<br />
which is sufficient to draw the air into the turbine. By providing<br />
the air valve with a light spring-loaded check valve so th a t it<br />
will close at zero pressure and prevent water from flowing out of<br />
the valve, but will open whenever a vacuum of 1 or 2 in. of mercury<br />
exists, the use of cams connected to the gate mechanism<br />
can be eliminated and better results obtained under both varying<br />
heads and varying gate openings.<br />
J. D. S c o v i l l e . 16 The author’s turbine is called an autom atic<br />
adjustable-blade propeller, the blades moving to a new position<br />
as the gate opening is changed because of inherent characteristics<br />
of the runner. This is distinguished from the ordinary Kaplan<br />
turbine in which the blades are moved by an oil-operated servomotor,<br />
controlled by the gates. This might be called a controllable-pitch<br />
propeller.<br />
There are certain differences between the two types which<br />
should be pointed out. The author states that, when the gates<br />
are opened on the autom atic adjustable-blade turbine, the blades<br />
go to a large angle which make starting easy. On the controllable-pitch<br />
propeller, the blades are normally in their flattest<br />
position on starting, so th a t one would expect a large gate-opening<br />
requirement to start the unit. Such is not the case. Usually<br />
10 to 15 per cent is sufficient. The unit reaches synchronous<br />
speed at about the same opening.<br />
As the gates open further on the autom atic adjustable-blade<br />
15 “ O peration of H ydro-E lectric U nits for M axim um K ilo w att<br />
H ours (The T u rb o v e n t)," by F . N agler, Engineers and Engineering,<br />
vol. 42, 1925, pp. 148-156.<br />
14 P rincipal M echanical Engineer, Tennessee V alley A uthority,<br />
Knoxville, T enn. M em . A .S.M .E .<br />
16 A ssistant C hief Engineer, S. M organ S m ith C om pany, Y ork, Pa.<br />
M em . A .S.M .E.<br />
F i a . 16<br />
C u h v e b S h o w i n g R e l a t i o n B e t w e e n L o a d C h a n g e s a n d<br />
D is c h a r g e o f C o n t r o l l a b l e - P it c h P r o p e l l e r<br />
The blades of a controllable-pitch propeller can be moved as<br />
fast as the gates for load changes. It is desirable, however, to<br />
restrict the closing of the blades. The reason will be evident<br />
from Fig. 16 of this discussion. If the load changes from 1 to 2<br />
the discharge changes from a to c, if the blade-closing tim e is<br />
very slow, but from a to d if the blades close as fast as the gates.<br />
Therefore, the pressure change is correspondingly less. This is<br />
an advantage in a plant w ith a relatively long penstock. Usually<br />
the controllable-pitch propeller is so adjusted th a t the blades<br />
close in about 60 sec, so that, during a load reduction, it is in<br />
effect a fixed-blade runner.<br />
If the controllable-pitch propeller runs away, the maximum<br />
theoretical speed will be reached with the blades in a relatively<br />
flat position and the gates wide open. I t is only possible to obtain<br />
this condition if the blades are deliberately blocked at the<br />
flat angle. Even if the oil pressure fails and the gates open for<br />
some reason, the blades will open because of the unbalance,<br />
which the author points out. The opening tendency of the<br />
blades on the Bonneville units a t runaway speed was about 4<br />
times the force required to open the blades a t normal speed.<br />
This means th a t the runaway speed of the controllable-pitch<br />
propeller cannot reach the theoretical maximum.<br />
R. E. B. S h a r p . 16 The Terry autom atic adjustable-bladepropeller<br />
turbine presents a definite and valuable contribution<br />
to turbine design and to date turbines of this type have given a<br />
satisfactory account of themselves. The study and experiments,<br />
which the author has made on the hydraulic moments acting on<br />
'* Chief Engineer, I. P . M orris D ep artm en t, Baldw in S outhw ark<br />
D ivision of T he B aldw in L ocom otive W orks, Philadelphia, P a .<br />
M em . A .S .M .E .
406 TRANSACTIONS OF T H E A.S.M.E. JULY, 1941<br />
runner blades, represent a valuable contribution in connection<br />
with the design of the adjustable-blade-propeller turbine, whether<br />
of the T erry type or of the usual K aplan adjustable-bladepropeller<br />
turbine.<br />
There is one factor, however, which the author does not mention,<br />
but which does have an effect on the net hydraulic moment<br />
acting on runner blades, and th at is the centrifugal force acting<br />
on the blades.<br />
F i g . 17<br />
R e l a t i v e P o w e r D e v e l o p e d b y K a p l a n a n d T e r r y<br />
D e s ig n s a t L e s s T h a n N o r m a l H e a d<br />
Referring to the plan view of the author’s Fig. 5, all particles<br />
in the blades are acted upon by centrifugal force which has a<br />
component tending to flatten them . The m om ent caused by<br />
this component is of course greatest a t runaw ay speed. However,<br />
the net force mentioned by the author, namely, th a t resulting<br />
from a reduction in the angle of attack and th a t resulting<br />
from the increase in the relative velocity, increases at a greater<br />
rate than the centrifugal-force moment. The result is that,<br />
with this design of blade, the net mom ent is greatly increased,<br />
tending to open the blades.<br />
When adjustable-blade-propeller turbines are operated at<br />
less than normal heads, the K aplan type of turbine, w ith the<br />
blade-gate relation positively established by a cam, develops<br />
greater power than with the author’s design; Fig. 17 of this discussion<br />
indicates this condition.<br />
The curve marked No. 6 blade position represents the maximum<br />
power th a t can be developed in the steepest blade position<br />
for this particular runner. Similarly the curves m arked No. 4<br />
and No. 2 blade positions represent the maximum power which<br />
can be developed with the blades set in these flatter positions.<br />
I t is noted th at at 30 per cent of the norm al head, for instance,<br />
the unit power developed for the No. 6 blade position is 0.15,<br />
whereas, for a flatter blade position, as read from the envelope,<br />
the maximum unit power is 0.315. This condition approaches<br />
the runaway-speed condition where the author’s blades tend to<br />
take up their steepest blade position or angle. In order, however,<br />
to develop the maximum power possible from the unit, it is<br />
seen th a t the blades should be definitely brought to a flatter<br />
position.<br />
I t is the w riter’s experience, based on comparative tests, th at<br />
a better performance as regards cavitation and maximum output<br />
obtainable are secured by having the blade axis located farther<br />
downstream than is indicated in the paper. This is due to<br />
reduced clearance between the throat ring and the runner blades<br />
in the vicinity of the trailing edge being secured with the axis so<br />
located. While this does increase the capacity required of the<br />
blade servomotor, it is considered desirable.<br />
The greatest factor in determining the capacity of runner-blade<br />
servomotors of Kaplan turbines is the friction in the runner-blade<br />
mechanism in the hub. A minimum amount of friction is therefore<br />
quite desirable on th a t type of turbine and the use of antifriction<br />
bearings in K aplan hubs would of course accomplish this<br />
result to a very great degree. The inevitable entrance of water<br />
into the hub at some time or other, however, dictates th at these<br />
bearings should be of the stainless-steel type, such as the author<br />
employs. The slow oscillating movement of the runner blades<br />
with a turn of not more than 30 deg, with indefinite more or less<br />
stationary periods in conjunction with the live character of the<br />
load, tends to cause Brinelling or local strain hardening or<br />
grooving action on the races which, in the writer’s opinion, has<br />
made the use of this type of bearing questionable, particularly<br />
in view of the present inability of bearing manufacturers to obtain<br />
a satisfactory stainless antifriction-bearing material.<br />
The author has naturally employed bearings of ample proportions<br />
and liberal ratings. However, the writer would be interested<br />
in knowing whether any of these bearings has been examined<br />
after extended field use and whether the lag mentioned<br />
in connection with the Winfield turbines can be ascribed to possible<br />
grooving of the races. The continued absence of friction<br />
is of course essential to the Terry design as a friction increase<br />
aggravates the lag between the exact position desired and that<br />
actually secured.<br />
One of the interesting features of this turbine, as the author<br />
points out, is the tendency of the blades to open to their steepest<br />
angle a t runaway speed, with consequent reduction in the runaway<br />
speed reached, as compared with w hat would be reached<br />
with a flat blade angle. Under normal conditions, the blades<br />
both of the Terry turbine and the conventional Kaplan turbine<br />
move to their steepest blade positions if the gates open wide under<br />
runaway-speed conditions.<br />
I t is a common practice among K aplan designers to assume<br />
th at the cam relation might be destroyed and the runner blades<br />
might conceivably be in the flat position with the maximum gate<br />
opening causing high runaway speed. For this to happen however<br />
a very remote chain of circumstances would have to exist.<br />
Nevertheless, it is considered sound engineering to assume that<br />
they might exist.<br />
I t appears to the writer th at the mechanism of the Terry turbine<br />
might prevent the blades from taking up their steepest<br />
position during runaway, due possibly to the jamming of one<br />
of the blade links or other parts of the hub mechanism, or the<br />
malfunctioning of the pressure-reducing valve, controlling the<br />
servomotor pressure. Therefore, with the Terry turbine no<br />
less than w ith the Kaplan, it appears desirable to allow for the<br />
maximum possible runaw ay speed with the flat blade position, in<br />
view of the possible destructive results should this condition<br />
not be provided for.<br />
A u t h o r ’s C l o s u r e<br />
Several of the discussers raised questions regarding the powerefficiency<br />
characteristics of this type of turbine. The Austin<br />
dam units were field-tested in January, 1941, according to the<br />
standards of the 1938 A.S.M.E. Test Code for Hydraulic Prime<br />
Movers. The discharge was measured by the Gibson method.<br />
The results of these tests on one unit are shown in Fig. 18 of this<br />
closure, in comparison w ith the results of tests made at several<br />
blade positions on a 16V*-in. model under 12 ft head in the hydraulic<br />
laboratory of the author’s company. It will be noted<br />
th a t the efficiency curve is quite flat, being above 90 per cent for<br />
about 62 per cent of the load range. The maximum efficiency<br />
obtained was 93 per cent. The average efficiency from the 20<br />
individual test points, within the guaranteed range of from 4000<br />
to 10,000 hp, was 91.6 per cent. The author believes that these<br />
test results are a t least equal to any th at have been obtained with<br />
turbines of the adjustable-blade type.
T ER R Y —D EV ELO PM ENT OF AUTOM ATIC ADJUSTABLE-BLADE-TYPE PR O PELLER T U R B IN E 407<br />
F i g . 1 8<br />
C o m p a r is o n o f F ie l d a n d M o d e l - T e s t P e r f o r m a n c e<br />
o f 1 0 ,0 0 0 - H p A d j u s t a b l e - B l a d e T u r b i n e<br />
Mr. Adams’ discussion, relating to the installation and operation<br />
of the Austin turbines is gratifying, particularly th a t part<br />
dealing with governing and system-frequency control.<br />
Messrs. Nagler and Sharp raise questions in regard to the service<br />
and life of the stainless-steel roller bearings employed in<br />
the runner hub. The estim ated loads, the bearing manufacturer’s<br />
ratings, and other data on the several bearings of the<br />
Austin runner are given in Table 2.<br />
TABLE 2 AUSTIN R U N N E R ROLLER BEARINGS<br />
Outer Inner<br />
radial radial Thrust<br />
Bore of bearing, in............................ 9 .0 0 5 .0 0 8<br />
Outside diameter of bearing, in.. 14.508.25 12<br />
Bearing length, in........................... . 2.752.19 2<br />
Diameter and length of rollers, in. lV s X *A X 8 A X<br />
l«A IV* l*A<br />
Number of rollers............................. 26 21 26<br />
Estimated load, lb ............................ 81,000 51,000 30,500 (Normal speed)<br />
122,000 (Runaway speed)<br />
Rated load (2 rpm), lb ................... 109,500 55,400 125,900<br />
The rated loads are based on a speed of 2 rpm, whereas, the<br />
actual service approaches a static condition under which the<br />
ratings would be somewhat increased. The ratings are also<br />
based upon a specified minimum of 52 Rockwell C hardness,<br />
whereas, the actual hardness is about 55 Rockwell C. T hat<br />
change in hardness increases their actual capacity from 70 to<br />
about 90 per cent of the capacity of carbon-steel bearings, an<br />
increase of about 28 per cent.<br />
The life of the bearings for this service is not definitely knowrn.<br />
Although the aggregate service of the five units installed is about<br />
15 years, there has been no occasion to dismantle a runner for an<br />
examination of the internal parts. If the life of the bearings<br />
should prove less than expected, bearings of 25 to 30 per cent<br />
higher capacity are now available, interchangeable with the present<br />
bearings. T hat change in capacity would give a theoretical<br />
increase of life of from 50 to 75 per cent. A still greater factor<br />
of safety or longer bearing life m ay be obtained by the use of<br />
“quill-tvpe” inner bearings or by employing a slightly larger<br />
diameter of runner hub. To date, there has been no indication<br />
pointing toward bearing failures.<br />
The seventy-two bearings used in the five units in operation<br />
were all supplied by one bearing m anufacturer who has cooperated<br />
in making this new application practicable. The materials<br />
used are of a commercial quality which appears to be<br />
quite satisfactory. The service required of the bearings is, in a<br />
way, somewhat crude as compared with th a t ordinarily required<br />
of bearings on high-speed machinery. I t is the author’s opinion<br />
th a t the bearings for this service will prove satisfactory for a<br />
much longer period, proportionately, than w ith most applications<br />
of antifriction bearings.<br />
I t would appear th a t roller bearings are inherently more suitable<br />
for adjustable-runner application than are the plain bronzebushed<br />
bearings. Since the axial length of the roller bearings is<br />
short, the loads are uniformly applied and the unit loads m ay be<br />
readily computed. W ith the much longer plain bearings, the<br />
already high average unit pressures are greatly increased by<br />
pressure concentrations due to deflection. While seizure of the<br />
plain bearings has not been common, a number of seizures have<br />
occurred, which condition constitutes somewhat of a problem.<br />
It is believed th a t any problems which m ay arise with the rollerbearing<br />
applications can be more readily solved than in the case<br />
of plain bearings.<br />
The waterproof grease used in the runner hubs is extremely<br />
tenacious, which, together with the slight angular movement of<br />
the bearings, should insure retention of a good lubricating film<br />
on the rollers. Reverse loads occur on the radial bearings when<br />
the wicket gates are closed with the turbine running. However,<br />
these loads are kept below the normal loads by the admission<br />
of air as described in the paper. The reverse loads do not<br />
occur as a blow, but rather change somewhat rapidly as the gates<br />
are closed from the speed-no-load to the fully closed position.<br />
The tim e interval is short b u t it is ample to prevent any action<br />
which might be term ed a blow.<br />
In general, the author agrees w ith the comments of Messrs.<br />
Nagler and Roberts in regard to venting turbines by air admission<br />
a t certain gate openings and on shutdowns. Considerable<br />
venting of all types of reaction turbines is highly beneficial at<br />
low gate openings. Some venting of all fixed-blade turbines<br />
at interm ediate loads up to nearly the point of best efficiency is<br />
also beneficial. From the standpoint of efficiency, venting at<br />
and beyond the point of best efficiency is ordinarily questionable,<br />
but a moderate am ount of air is often used to alleviate the<br />
effects of blade and vortex cavitation. Venting becomes of increasing<br />
importance a t values of the peripheral coefficient <br />
above its best efficiency value, as when operating under reduced<br />
heads. W ith adjustable-blade runners at normal values of a<br />
pressure usually exists under even the lower part of the headcover<br />
cone over practically the entire load range, th a t is, down<br />
to very low gate openings, making it impractical to adm it atmospheric<br />
air. A pressure lower than atmospheric m ay sometimes<br />
be produced by employing lips upstream of the vent openings.<br />
On future turbines, it is proposed to employ a scheme for venting<br />
the draft-tube vortex in a manner similar to th a t shown in Fig.<br />
11 of the paper. The use of a small am ount of compressed air has<br />
been found beneficial on certain turbines' to alleviate blade or<br />
blade discharge eddy cavitation.<br />
As Mr. Scoville points out, it is not absolutely necessary to<br />
open the blades when starting up an adjustable-blade turbine.<br />
However, exceptionally large gate openings, with resulting high<br />
thrust loads, are sometimes required to start a unit w ith the<br />
blades flat. The opening feature is certainly a distinct improvement.<br />
Cases have come to the attention of the author where<br />
the minimum angle of adjustable turbine blades had to be increased<br />
on account of starting conditions, particularly on lowhead<br />
installations. I t is also of interest to note in this connection<br />
th at some of the largest K aplan turbines in operation have been<br />
provided w ith special extra equipment to give the blades an initial<br />
tilt before starting. The 18,000-hp turbines at the Vargon<br />
plant in Sweden, w ith runners 26 ft 3 in. diam, are provided with<br />
such equipm ent,17 also the 48,000-hp turbines at the Pickwick<br />
17 “ Low H ead P roduces H igh C a p acity ,” b y G eorge W illock,<br />
Power, D ecem ber, 1939, pp. 74-76.
408 TRANSACTIONS OF THE A.S.M.E. JULY, 1941<br />
plant'8 in Tennessee with runners 24 ft 4 in. diam. The type of<br />
turbine described by the author performs this function automatically<br />
without extra equipment, due to the method employed<br />
in pivoting the blades.<br />
Mr. Scoville states that Kaplan-type turbines are usually arranged<br />
so that the blades close in about 60 sec, and claims this to<br />
be an advantage in a plant with a relatively long penstock, the<br />
advantage being a lesser pressure rise in the penstock as a result<br />
of dropping load. Upon first thought there would appear to be<br />
a considerable difference as cited. However, referring to Mr.<br />
Scoville’s Fig. 16, the time required to drop from full load to onehalf<br />
load would be reduced in the case of the Kaplan turbine by<br />
nearly the same ratio as the reduction in discharge, so that the<br />
rate of reduction in discharge per second, which determines the<br />
pressure rise, would be only slightly less for the Kaplan than for<br />
the automatic adjustable-blade type. In each case it is assumed<br />
that the loading and gate timing is the same. In the case of<br />
full-load rejection, the total change in discharge is made in the<br />
same length of time. Consequently, the average pressure rise<br />
would be approximately the same in either case. An exact<br />
analysis of the conditions will reveal that, with the automatic<br />
type, the rate of reduction in discharge may be slightly higher<br />
at the higher gate openings but that the rate reduces somewhat<br />
as the gates approach their closed position, resulting in a very<br />
desirable action, similar to that produced by cushioning the closing<br />
end of the gate stroke.<br />
In every case investigated by the author, the operating characteristics<br />
of the automatic adjustable-blade-type turbine, which<br />
affect governing, are equal or better than those generally obtained.<br />
In this connection, reference is made to the discussion<br />
by Mr. Adams in which it is pointed out that the 10,000-hp Austin<br />
turbines will be used for the frequency control of a 175,000-<br />
hp system, due partly to their excellent governing properties.<br />
The W R2 of each Austin unit is only about 3 per cent of the total<br />
of all units of the system. The penstocks at Austin are about as<br />
long as any usually encountered with adjustable-blade turbines.<br />
From tests, the pressure rise when dropping full load in 3 sec was<br />
about 34 ft and the speed rise about 31 per cent.<br />
The necessity for designing the generator for the highest possible<br />
runaway speed that could occur, if the blades were deliberately<br />
blocked at a relatively flat angle, is somewhat controversial.<br />
This question was brought up by Messrs. Scoville and Sharp.<br />
At full runaway speed the author’s analysis shows that the forces<br />
on a blade are principally in the form of a couple, consisting of<br />
upward forces near the leading edge and downward forces, of<br />
only slightly greater magnitude, near the discharge edge. If<br />
that analysis is correct, the couple moment would be the same,<br />
irrespective of the location of the axis. That is, there would be<br />
a very strong tendency for the blades to open with either the old<br />
or new location of the blade axis. However, there are two features<br />
of the automatic type which make it inherently less likely<br />
for the blades to stick in their highest speed position: (a) The<br />
friction moment of the roller bearings used is only a small fraction<br />
of that of plain bearings; (6) a low operating fluid pressure<br />
is used and the arrangement is such that the fluid cannot become<br />
“locked in,” as it could in the case of a piston-type valve, such as<br />
is employed with the high oil-pressure type of operation.<br />
Referring to Fig. 17, Mr. Sharp seems to have confused the<br />
runaway-speed characteristics of the automatic-type turbine<br />
with its operation at normal speed under reduced heads. Consequently,<br />
his conclusions in regard to the advantages of a Kaplan<br />
turbine under subnormal heads are incorrect. High unit<br />
speeds, high values of peripheral coefficient , may be produced<br />
u "A Technical Review of the Pickwick Landing Project,” Technical<br />
Monograph No. 40, Tennessee Valley Authority, March, 1939,<br />
exhibit 21.<br />
either by overspeed at high heads or by low-head operation at<br />
normal speed. It is only in the case of speeds above normal that<br />
the blades of the automatic turbine open to reduce the amount<br />
of overspeed. When operating at normal speed under reduced<br />
heads, the more or less constant pressure applied to the reactive<br />
piston causes the blades to assume flatter positions, with respect<br />
to gate opening, than their positions at the higher heads. This<br />
may, perhaps, be better visualized by stating that, as experimentally<br />
determined, the “reactive moment” required for each of the<br />
developed designs of the automatic turbine at variable heads<br />
and loads is approximately equal to the cube of the runner diameter,<br />
times the square of the speed, divided by a constant, Rb<br />
— J)^N2/K . Thus, for variable-head operation at constant<br />
speed, the application of a constant reactive pressure tends to<br />
make the gate-blade relation vary correctly with the head as well<br />
as with the gate opening, in such a way as to maintain both efficiency<br />
and power at values approaching those theoretically<br />
possible. As a result, the turbine may operate to produce power<br />
down to a very low head, the same as is accomplished with the<br />
Kaplan type by changing cams, until the value of equals the<br />
highest value obtained with the blades nearly closed. That<br />
value may be from 2.3 to 2.5 times its normal value, or even<br />
higher, depending upon the number and camber of the blades.<br />
Mr. Sharp also appears to have found from his model tests<br />
that a better shape of efficiency curve is obtained as a result of<br />
pivoting the blades further downstream than is necessary with<br />
the automatic type. The author does not find this to be the<br />
case. The results of the Austin tests, Fig. 18 of this closure,<br />
rather indicate that there is little increase in the leakage losses<br />
through the increased clearances at the periphery of the blades<br />
as they approach their open position. The reason for this apparent<br />
difference in characteristics may possibly be due either to<br />
a difference in camber or to a difference in the shape of the throat<br />
ring. The effect of increased clearance may be offset, in the<br />
author’s opinion, by giving the blades of adjustable runners a<br />
little more camber than for fixed-blade runners. With the proportions<br />
of throat ring and blade-axis location adopted for the<br />
Austin turbines, Fig. 10 of the paper, the maximum clearances of<br />
the runner with the throat ring, for the open position of the<br />
blades, are kept to quite reasonable values. The throat, minimum<br />
diameter of the water passage, is located well below the<br />
blade axis, opposite the discharge edge of the blades when open.<br />
The clearance at that point is about 2.5 per cent of the runner diameter,<br />
i.e., about the same as is used with Kaplan turbines.<br />
The corresponding clearance at the leading edge of the blades is<br />
about 1 per cent, somewhat smaller than is customary with Kaplan<br />
turbines. The smaller clearance at the leading edge should<br />
have an advantage in decreasing the danger of a trash jam at<br />
that point.<br />
Mr. Sharp has properly called attention to the effect of centrifugal<br />
force in giving the blades a tendency to move to their flattest<br />
position. This effect is more pronounced with the wider<br />
blades, such as are employed with the four-blade types, but the<br />
resulting closing moments about the blade axes are not large<br />
when compared with the hydraulic moments. In the case of<br />
the autopiatic-type turbine, it simply has the effect of reducing<br />
slightly the required reactive pressure.<br />
Mention was also made of the blade-servomotor capacity.<br />
It is interesting to compare the capacities required with the<br />
Kaplan and automatic types. The author’s analysis of several<br />
large Kaplan installations shows that the average required<br />
blade-servomotor capacity, based on piston displacement<br />
and supply pressure, may be expressed by the formula, S =<br />
20 P N ,1/' -s- \/ H , where S is the servomotor capacity in footpounds,<br />
P the brake horsepower of the turbine, N, the specific<br />
speed, and H the operating head. For the author’s type turbine
TERRY—DEVELOPMENT OF AUTOMATIC ADJUSTABLE-BLADE-TYPE PROPELLER TURBINE 409<br />
a servomotor capacity of 3.33 P N ,1^ -f- y /H , is quite ample, or<br />
one sixth that of the Kaplan. The Kaplan servomotor is doubleacting,<br />
while that of the automatic type is single-acting,<br />
resulting in a true capacity ratio of 12 to 1, on an energy-supply<br />
basis.<br />
The, Austin turbines were originally provided with a camoperated<br />
auxiliary-control device to vary the pressure supply to<br />
the balance piston, if that was found necessary. The units were<br />
at first operated at 20-psi reactive pressure without the use of<br />
that device. However, it was found from the preliminary tests<br />
that the use of the auxiliary control would result in a substantial<br />
improvement in efficiency at certain loadings. The official tests<br />
were made with the auxiliary-control device in operation, the<br />
actual reactive pressure varying from 14 to 35 psi. Such a device<br />
seems to be desirable, particularly for the higher head applications<br />
of the automatic type where the greatest variation in<br />
the required reactive moment was found from the model tests.<br />
The auxiliary control of the reactive pressure is rather simple in<br />
design and its use does not in any way affect the several basic<br />
advantages of the automatic adjustable-blade-type turbine.<br />
Several important improvements in designs have been made<br />
since the paper was prepared. These include an external control<br />
valve for varying the reactive pressure, in contrast with the<br />
internal valve used at Austin. This valve is operated by an adjustable<br />
cam on the gate-operating ring and has a follow-up connection<br />
for blade movement. It acts to position the blades positively<br />
in accordance with a predetermined gate-blade relation,<br />
irrespective of the friction of the runner mechanism and irrespective<br />
of the variations in the blade hydraulic moments with load<br />
and head that were mentioned in the paper.<br />
Design details have been prepared for a unit rated 40,000 hp<br />
120 rpm 70 ft head to operate under heads varying from 50 to 80<br />
ft. The latter head is at present considered to be the upper<br />
limit for the application of the automatic-type turbine.<br />
In closing, the author wishes again to recognize the contributions<br />
of the discussers. He also wishes to thank the personnel<br />
of the Kanawha Valley Power Company and the Lower Colorado<br />
River Authority who cooperated wholeheartedly and to whom<br />
much credit is due for the successful applications of this type of<br />
turbine.
Production of Seamless T ubes by C om bined<br />
Effects of Cross-Rolling and G uide D isks<br />
By W. T R IN K S ,1 PITTSBU R G H , PA.<br />
F ro m th e v a rio u s m e th o d s o f p ro d u cin g se a m le ss tu b e s<br />
th e a u th o r h a s selected th e D iesch er elo n g a to r m ill a s th e<br />
b a sis for d isc u ssio n in t h is p ap er. F or a b e tte r u n d e r <br />
sta n d in g o f th is m e th o d o f tu b e p r o d u ctio n , th e m o s t<br />
recen t D iesch er m ill in s ta lla tio n a t A llen p o rt, P a ., is d e <br />
scribed in so m e d e ta il. F o llo w in g t h is th e th e o r y o f c r o ssrollin<br />
g a n d g u id e d isk s in th e p rocess o f tu b e m a n u fa c tu r e<br />
is explain ed .<br />
A M O N G the various seamless-tube-manufacturing processes,<br />
/-% the Diescher elongator holds the center of interest because<br />
it materializes the long-unrealized dream of the M annesmann<br />
brothers to produce a finished tube by cross-rolling.<br />
In this connection, it will be remembered th at, in 1885, the<br />
Mannesmann brothers of Remscheid, Germany, introduced their<br />
epoch-making invention whereby the production of seamless<br />
tubular blanks was made feasible by cross-rolling. This practice<br />
is universally known among English-speaking technicians as<br />
“ cross-roll piercing.”<br />
Great hopes were originally expressed for the new rolling<br />
process. I t was even expected by some th a t a finished tube could<br />
be made ir. one pass from a round ingot. N ot only did this expectation<br />
fail of realization, but the use of cross-rolling in the desired<br />
heavy reduction of both wall thickness and diam eter m et<br />
the same fate. The cross-roll-piercing process did, however,<br />
most spectacularly and effectively deliver comparatively thickwalled<br />
blanks, which to be converted into finished tubes required<br />
some yet-to-be-discovered procedure. Finally, after m any discouraging<br />
highly expensive, and time-consuming endeavors, a<br />
step-by-step forging process was invented by the M annesmanns<br />
which accomplished the desired tube-forming operations.<br />
This second procedure involves w hat is universally known as<br />
the “pilger mill,” which received its name from the fact th a t the<br />
blank passed through the mill w ith a motion similar to th a t of the<br />
pilger (pilgrims) who, to dem onstrate the depth of their piety,<br />
went to the shrine at Amdernach five steps forward and three<br />
steps backward.<br />
to the U nited States, he introduced this highly creditable<br />
innovation. D uring his m any years of fruitful life in this country,<br />
he was regarded as the dean among seamless-tube experts. In <br />
troducing slippage between the rolling faces and the billet perm<br />
itted the m aterial to flow into length more easily, whereby a reasonably<br />
thin-walled blank was produced. To be converted<br />
into a product suitable for cold-drawing, this blank required<br />
but a few passes in a plug mill. To be converted into an hotfinished<br />
product required, in addition to the plug-rolling, a reeling<br />
and then a sizing operation. Thus, methods other than crossrolling<br />
had to be used by the M annesmanns as well as by Stiefel<br />
for bringing the pierced blank to final cross section and length.<br />
Almost 50 years elapsed after the M annesmanns made hollow<br />
blanks by cross-roll piercing, before Samuel E. Diescher of P ittsburgh<br />
succeeded effectively in elongating a pierced blank into a<br />
thin-walled tube by cross-rolling. As in the case of the Mannesmanns,<br />
his mill acquired a name descriptive of the operation<br />
performed, as interpreted by men skilled in the tube art; this<br />
term was “elongator.” The elongator has been briefly described<br />
in the literature, but the details of the construction, as well as<br />
the theory underlying this new method of plastic deformation,<br />
have never been published.<br />
In reviewing the rather extensive patent structure which has<br />
thus far appeared in public print, the author has discovered th a t<br />
m any of the later features of the process are inventions of the<br />
originator’s brother, August P. Diescher. Therefore, as was the<br />
case w ith the M annesmanns, here again we have the work, of<br />
brothers.<br />
D i e s c h e r E l o n g a t o r M e t h o d<br />
The Diescher elongator method requires cross-rolls arranged in<br />
a m anner generally similar to those of Mannesmann. A pierced<br />
blank enters the mill on a freely floating mandrel on which it is<br />
E a r l y P i l g e r o r P o k e M i l l s<br />
In the United States, the early pilger mills were called “poke<br />
mills,” which term arose from the fact th a t these early mills were<br />
hand-fed and required the operator to push forward or poke<br />
the mandrel with the shell on it into the mill after each roll stroke<br />
of the bell-shaped pass machined in the rolls.<br />
Those who are familiar w ith the early history of the production<br />
of seamless tubes in the U nited States will remember th at, in the<br />
piercing mill, Stiefel, a Swiss engineer employed a t the British<br />
Mannesmann Works, substituted overlapping truncated conical<br />
members, provided w ith sidewise working faces, for the barreltype<br />
cross-rolls of the Mannesmanns. When Mr. Stiefel emigrated<br />
1 Professor of M echanical Engineering, C arnegie In stitu te of<br />
Technology. M em . A .S .M .E .<br />
C ontributed by th e M etals E ngineering D ivision and presented<br />
a t the A n n u a l M eeting, N ew Y ork, N . Y ., D ecem ber 2-6, 1940, of<br />
T h e A m e r ic a n S o c ie t y o f M e c h a n ic a l E n g i n e e r s .<br />
N o t e : S tatem en ts an d opinions advanced in papers are to b e<br />
understood as individual expressions of th eir au th o rs and n o t those of<br />
the Society.<br />
F i g . 1<br />
D ia g r a m o f C r o s s - R o l l i n g P r o c e s s
412 TRANSACTIONS OF T H E A.S.M.E. JULY, 1941<br />
then cross-rolled, Fig. 1. The feature of the mandrel, moving<br />
in the forward direction during the procedure, seems to be a departure<br />
from the M annesmann concept. However, th a t feature<br />
alone would not have made the Diescher procedure feasible. To<br />
explain this requires first of all a clarification of w hat occurs in<br />
cross-roll deformation.<br />
The cross-rolling process is inherently an expanding process,<br />
because the contact area between roll and blank is long in the<br />
direction of tube travel, and is short in the direction of roll travel.<br />
As a consequence of the laws of plastic flow, the resistance to<br />
“ bulging” is much smaller than the resistance to elongation of<br />
recent to be placed in operation in the United States. Also, the<br />
Allenport works is the only plant throughout the entire industry<br />
at which there may be seen both the M annesmann and the<br />
Diescher practices. The plant equipment includes a largesized<br />
M annesmann piercing mill, working with comparatively<br />
large-diameter ingots, as contrasted w ith the prerolled rounds<br />
used in the Diescher mill. Conjoined therewith is also a pair<br />
of pilger mills, which embody the second notable Mannesmann<br />
principle of tube making. Further details of the Mannesmann<br />
contribution to the art are unnecessary for purposes of this<br />
paper since their significance is principally historical.<br />
The photograph from which Fig. 2 is reproduced was taken<br />
from a position near the racks where the elongated product is<br />
accumulated for crane transportation to locations in the plant<br />
where final processings take place as, for instance, cutting to<br />
length, sinking, upsetting, cold-drawing, inspecting, and testing.<br />
In the upper left-hand part of the illustration appear the heating<br />
furnace, the piercing mill, and the transfer equipment from the<br />
piercer outlet to the elongator inlet. Of the pair of large motors,<br />
appearing nearer the foreground and toward the left-hand region<br />
of the picture, the one farther removed from the foreground<br />
F i a . 2 E l o n g a t o r U n i t a t P l a n t o f P i t t s b u r g h S t e e l C o m <br />
p a n y , A l l e n p o r t , P a .<br />
the product. As a m atter of fact, solely by cross-rolling on a<br />
floating mandrel there could be expected at best, under the<br />
extent of deformation performed by the elongator, a tube of uncontrolled<br />
expansion and of much larger diam eter than th a t of the<br />
pierced shell. In the Diescher mill, this expansion is prevented by<br />
the elongator disks, wThich by frictional contact with the blank not<br />
only prevent uncontrolled expansion, but also pull the blank forward<br />
and convert the expanding tendency of the cross-rolls into<br />
elongation of the tube. W ith any circumferential speed of the<br />
cross-rolls and any practicable angularity of the setting thereof, a<br />
tube issuing therefrom m ust travel a t a much lower rate of speed<br />
than the circumferential speed of the cross-rolls. The inference<br />
is natural th at the elongator disks should run at a speed but<br />
.slightly higher than th a t at which the work m aterial issues, so<br />
th a t the friction will just pull the tube blank along, w ithout doing<br />
more work than necessary. However, th at inference is incorrect.<br />
The circumferential speed of the elongator disks is required to<br />
exceed greatly even the circumferential speed of the cross-rolls.<br />
Moreover, there is likely to be drawn another erroneous conclusion.<br />
I t might be reasoned th at, since the elongator disks are<br />
intended to prevent tube expansion, they should be set to prevent<br />
any and all expansion, so th a t the finished tube will hug the<br />
mandrel tightly. In reality, the work m aterial is allowed to expand<br />
away from the mandrel, at the same time, however, requiring<br />
precision control of such expansion. Both of these somewhat<br />
surprising facts m erit discussion. First, however, a detailed description<br />
of the equipm ent will be given to aid in a better understanding<br />
of the entire subject.<br />
D e t a i l s o p L a t e s t - T y p e E l o n g a t o r U n i t<br />
Fig. 2 shows the elongator unit in use at the Pittsburgh Steel<br />
Company’s plant at Allenport, Pa. This installation is the most<br />
F i g . 3<br />
A s s e m b l y o f E l o n g a t o r S t a n d<br />
drives the piercer cross-rolls and the other drives the elongator<br />
cross-rolls.<br />
Fig. 3 is a view of the elongator stand while undergoing assembly<br />
in the machine shop prior to being set up as part of the<br />
elongator unit shown in Fig. 2. In this illustration, the main<br />
stand is shown in the reverse position to th at which it occupies<br />
in Fig. 2, i.e., its entry side is seen in Fig. 3, whereas, its exit side<br />
is in view' in Fig. 2.<br />
In detail, Fig. 3 shows the main bearings at the nondriven<br />
ends of the cross-rolls; the arrangem ent of main screws, which<br />
for the sake of preventing any rocking of the main bearings are<br />
applied in pairs; and the screw rig for vertical adjustm ent of the<br />
upper guide disk. Because of the height of this rig above floor<br />
level, it is operated by hand chains and so arranged as to encircle<br />
a well located a t the middle of the housing cap through which<br />
crane slings can be lowered for removing the guide disks from their<br />
shaft mountings when their renewal is required. Between the
THIN K S—PR O D U C TIO N O F SEAMLRSS TUBES<br />
two pairs of main screws, Fig. 3 also shows a window giving access<br />
to the guide disks on the side in view, and entry for the guidedisk-drive<br />
spindles on the side opposite thereto and not in view.<br />
The hand wheel, appearing centrally below the upper guidedisk-screw<br />
rig, is for clamping the upper guide-disk carrier rigidly<br />
in position, following its adjustm ent by the screw rig mentioned.<br />
The hand wheel appearing a t the left of the one just mentioned<br />
is for adjusting the guide disk with its bearings sidewise of the<br />
vertical plane of the pass axis, the purpose of which adjustm ent<br />
will be explained later.<br />
Immediately below the hand-wheel adjustm ent last mentioned<br />
and near the bottom of the stand is a companion adjustment<br />
which serves in the same m anner as the upper one; but in<br />
this case in connection with the lower guide disk.<br />
The hand wheel arranged a t the right-hand side of the main<br />
stand and connected by a horizontal reach shaft to the worm<br />
drive, set centrally of the bottom of the housing, is for clamping<br />
the lower guide-disk carrier in a manner similar to th at previously<br />
described as pertaining to the upper guide disk.<br />
Finally, the hand wheel, on the vertical shaft centrally located<br />
in relation to the window opening a t the right-hand side of the<br />
stand, is provided for the vertical adjustm ent of the lower guide<br />
disk. All these adjustm ents are duplicated on the side of the<br />
stand which is hidden from view.<br />
The guide opening, indicated by an arrow, provides entry for<br />
the workpiece into the pass located centrally of the stand and<br />
formed by the opposed faces of the cross-rolls and of the vertically<br />
opposed faces of the guide-disk rims; on the opposite side of the<br />
stand there is another such guide which provides for the exit of the<br />
workpiece.<br />
Comparing the size of this main stand with the size of the man<br />
standing alongside it gives an idea of its massiveness. The stand<br />
must be massive to prevent harmful give to the working elements,<br />
especially in the working of a thin-walled product accurately to<br />
size.<br />
Referring again to the general view Fig. 2, it will be observed<br />
from the location of the crossover skids leading from the piercer<br />
outlet to the elongator entry, th at the workpiece, after leaving<br />
the furnace, m ust travel alongside and beyond the piercer before<br />
entering it. After leaving the piercer, then traversing the crossover<br />
skids, and entering into and finally passing out of the elongator<br />
stand, it will also be noted that, in its elongating course,<br />
the workpiece travels in the opposite direction to th at in which<br />
it proceeded through the piercer. This procedure was adopted<br />
because w ith thin-walled piercing, the shell tends to become<br />
somewhat smaller in diam eter a t its exit end than throughout its<br />
general course, which created a condition inviting chilling under<br />
the closer approach of the walls a t this narrowed end to the<br />
elongator-mandrel surface. By causing th a t end to enter the<br />
guide-disk pass first, there is not the am ount of time for chilling<br />
to take place th a t would occur if the direction of workpiece<br />
travel for both piercing and elongating was the same.<br />
Obviously, before the pierced shell m ay be entered into the<br />
elongator, a mandrel bar m ust be strung through it. In the<br />
right-hand background of Fig. 2 m ay be seen a num ber of these<br />
bars resting on the mandrel-cooling or storage bed. As soon as<br />
a mandrel has been advanced from the bed to its position within<br />
the pierced shell, both shell and mandrel enter the elongator<br />
pass and are fed through it, traveling along between the elongator-drive<br />
spindles, thence through a passageway provided in<br />
the drive-gear housing, which can be seen in the center of the<br />
illustration, and finally forward along the runout table the<br />
drive of which appears in the left-hand foreground. By flagswitch<br />
control, the three-arm star-throw out rig, appearing immediately<br />
next this runout table, directs the finished tube with<br />
the mandrel still inside it across skids to a chain transfer and<br />
from th a t mechanism to another table which is parallel with the<br />
runout table b u t operates in the reverse direction. This latter<br />
table passes the tube and mandrel toward the rear to a pinch-roll<br />
stand which can be seen a t the end of the table. A t this point,<br />
the mandrel is extracted from the tube and proceeds along its<br />
course and is finally, by means of a star throwout, transferred to<br />
the mandrel storage and cooling rack.<br />
By means of another star throwout, the tube from which the<br />
mandrel was extracted is moved sidewise into the finishedproduct<br />
storage rack, shown at the right, from which the product<br />
is removed in crane-load batches for further processing, as previously<br />
described.<br />
Beyond this tubular product storage rack and midway between<br />
it and the background is shown the elongator guide-disk-drive<br />
motor.<br />
T h e o r y o f C r o s s - R o l l in g S e a m l e s s T u b e s<br />
In a vertical plane, the cross-rolls are set a t an angle of 6 deg<br />
w ith the direction of travel of the tube. Ordinarily and with no<br />
allowance for slip between cross-rolls and tube, the latter would<br />
travel (sin 6 deg) times the circumferential roll speed. A typical<br />
roll speed is 800 fpm, which makes the tube-delivery speed equal
414 TRANSACTIONS OF THE A.S.M.E. JULY, 1941<br />
to 0.105 X 800 = 84 fpm. Actually, the tube travels a t a higher<br />
speed, i.e., approximately 100 fpm. Thus, the effect of the forward<br />
drag by the elongator disks becomes apparent.<br />
The speed a t which these disks operate gives rise to interesting<br />
speculation. The originator of the mill reasoned as follows:<br />
Thin-walled tubes tend to climb into the gap a, Fig. 4, and thereby<br />
F i g . 5<br />
D ia g r a m o f T u b e M o t io n<br />
become scrap, unless frictional resistance to revolving motion<br />
(arrow 6) is minimized. The resistance is wholly absent if, in the<br />
diagram of motion Fig. 5, origin 1 and term inal 2 of the travel of a<br />
point on the tube surface are equally distant from point 3, which<br />
is the location of point 1 of the disk when the corresponding contact<br />
point of the pipe blank has arrived a t 2. Geometrically (1)<br />
(3) is (1) (4) divided by sin a. Since equal intervals of time<br />
enter into the movements (1) (2) and (1) (3), velocities m ay be<br />
substituted. If, for instance, the peripheral speed is 800 fpm,<br />
the disk speed, according to this rule, should be 400/(sin 6 deg) =<br />
400/0.105 = 3810 fpm. Actually, a lower speed, about 2300<br />
fpm is used for the disk. A t th at speed, push by the cross-rolls<br />
is small when compared to the pull by the elongator disks.<br />
To clarify this theory yet further, the following reasoning will<br />
be helpful: Referring again to Fig. 5, it will be seen th at the<br />
cross-rolls move a point on the tube surface across the disk along<br />
the path (1) (4) (2). The problem is: How fast m ust the disk<br />
move so th at the tube blank wrill be dragged along the path (1)<br />
(4) (2) by the disk, instead of being pushed across by the crossrolls?<br />
The answer is the same as before.<br />
This derivation is based upon the elementary laws of solid<br />
friction, which teach th a t the friction coefficient is independent<br />
of the speed. However, phenomena occur in the elongator mill<br />
which, although not yet investigated quantitatively, should at<br />
least be mentioned. Contact between hot steel, such as the tube<br />
blank, and the much cooler rolls, as well as the disks, lowers the<br />
surface tem perature of the blank. Compression and deformation<br />
raise the tem perature of the blank. Local friction between rolls<br />
or disks and blank also raises the tem perature of the surface of<br />
the blank. This would be unim portant, but for the well-known<br />
fact th a t the friction coefficient between a roll and a hot-steel<br />
blank drops rapidly as the tem perature of the surface of the<br />
blank rises, and vice versa.<br />
The problem of ascertaining the surface tem perature of the<br />
blank a t the instant (and it is only an instant) of contact, is so<br />
filled with practical difficulties th at no accurate measurements<br />
are available a t the present time. One thing is certain, th at<br />
control of the frictional phenomena has played an im portant part<br />
in the development of the elongator mill. While the instantaneous<br />
surface tem peratures a t the contact are not known, the more<br />
easily observed tem peratures of the entering blank and tube at<br />
exit are known in a general way. For instance, it is known th at<br />
the tube which emerges from the Diescher mill has a higher<br />
tem perature than the blank which entered, whenever the elongation<br />
ratio substantially exceeds the value of 2 with present<br />
speeds.<br />
P o s i t i o n o p D i s k s<br />
The speed of the disks having been disposed of, we shall now<br />
consider their position. A t first, they were set with the same<br />
clearance as the cross-rolls, i.e., allowing only for the two wall<br />
thicknesses of the finished tube. Experience quickly taught th at<br />
they m ust be set with greater clearance. I t is undesirable to<br />
have the tube rolled tightly on the mandrel, for several reasons.<br />
W ith a tightly fitting tube, the mandrel becomes hot, the resistance<br />
to forward sliding of the tube on the mandrel during the<br />
rolling process is increased, and there is difficulty in removing the<br />
finished tube from the mandrel. In addition, the metal of thinwalled<br />
tubes tends to crowd into the gap or cleft between the<br />
cross-roll and the elongator disk, because the friction between the<br />
mandrel and a tightly fitting tube hinders elongation. Briefly<br />
expressed, the setting of the cross-rolls determines the wall<br />
thickness, while the setting of the elongator disks determines the<br />
diameter of the tube. An economic corollary is th at the diameter<br />
of the mandrel m ay vary within wide tolerances, with the<br />
proviso th at the mandrels used for one given roll setting must<br />
all be alike in diameter. Since the mandrels stay comparatively<br />
cool, they are not substantially deformed by the rolling process,<br />
b ut there is some wear. In consequence, no mandrel conditioning<br />
is required beyond th at attainable by centerless grinding.<br />
The problem of disk setting can be further elucidated by giving<br />
a few settings from actual practice. To roll a tube 2*/n in.<br />
diam and ‘/is in. wall thickness on a l 7/ s-in-diam mandrel, the<br />
cross-rolls m ay be set apart 2 in. a t the throat and the guide<br />
disks about 2Vs in. apart a t their closest approach. The resulting<br />
tube would be 2Vie in. diam, w ith Vi« in. wall thickness, and<br />
would provide Vi« in. of the diam to be removed in sizing to a<br />
2-in-diam product.<br />
To roll a tube 27/ a in. diam X Vsj in. wall thickness on a<br />
25/s-in. mandrel, the cross-rolls would be set apait 2I3/i6 in., and<br />
the disks about 216/ie in.; with a 29/ i 6-in. mandrel, the crossrolls<br />
could be set apart 23/« in. and the disks 3 in., although this<br />
is not the best practice.<br />
S h a p e a n d L a t e r a l P o s i t i o n o p E l o n g a t o r D i s k<br />
A few words should be said about shape and lateral position<br />
of the elongator disk. Since the tendency of the tube wall (particularly<br />
a thin tube wall) is to work into the gap between the<br />
cross-roll and elongator disk, it is highly desirable to reduce the<br />
width of th at gap to a minimum. This feat is accomplished by<br />
making the disk one-sided, e.g., with one edge longer than the<br />
other, as shown in Fig. 4. In addition, the disk is adjustable sidewise<br />
for the purpose of obtaining the best location for each size<br />
of tube.<br />
Several years ago, when the author first studied the Diescher<br />
elongator mill, he felt th a t the great relative rubbing speed between<br />
elongator disk and tube might have two undesirable effects,<br />
i.e., excessive wear of disk and excessive power consumption.<br />
In the beginning, the design and material of the disks<br />
offered a problem which, however, was soon solved by welding a<br />
rim of austenitic steel to a soft-steel center. The rim contains 25<br />
per cent chromium and 12 per cent nickel. One set of disks has<br />
rolled as many as 20,000 tubes before having to be reconditioned.<br />
Reconditioning is required, because the disks ultim ately become<br />
deformed in profile and thus become rough, whereby free circumferential<br />
flow of the tube m aterial along the disk profile is obstructed.<br />
The tube wall then tends to work into the gap or cleft,<br />
and so-called “disk wipes” occur in the finished tube. The contact<br />
tim e between disk and tube is about Vuo sec. This time does<br />
not afford opportunity for heat penetration into the disk. Several<br />
methods are in use for fastening the disks to their shafts. One<br />
m ethod is illustrated in Fig. 4.
T R IN K S—PRODUCTIO N OF SEAM LESS TUBES 415<br />
P o w e r R e q u ir e d f o r R o l l in g O p e r a t io n s<br />
W ith regard to power consumption, the following data are<br />
available. The rolling of thin-walled tubes requires more power<br />
per unit of volume times elongation in unit tim e than the rolling<br />
of the thick-walled product.<br />
The power required per net ton of product also varies with the<br />
size of product being made. For example, in rolling commonsteel<br />
pierced blanks of 3 in. diam and 0.266 in. wall to a product<br />
of 26/ s in. diam and 0.125 in. wall a t the rate of about 1.7 fps<br />
out of the elongator pass and produced a t the rate of 240 pieces<br />
20 ft long per hr, there would be required about 800 kw of power<br />
for all drives, including table drives of the elongator.<br />
Among data regarding the consumption of power in elongating<br />
per se, and therefore dealing solely with th a t required for driving<br />
the cross-rolls and guide disks, the following figures should be of<br />
value: In elongating to 0.09 in. wall thickness, about 95 hp are<br />
required per cu in. of metal displaced per sec; whereas, in elongating<br />
to double th at thickness about 70 hp are required per cu<br />
in. displaced per sec, the guide disks consuming about 25 per cent<br />
of the power consumed by the cross-rolls.<br />
Closely allied with disk wear and power consumption is the<br />
cost of tooling. The smaller the diam eter and the wall thickness<br />
of the product, the higher is the cost of tooling per ton of product.<br />
At present, the cost of all tooling in rolling the 26/s X Vs-in.<br />
wall tubing, mentioned under power consumption, is about<br />
$1.10 per net ton of product. This includes all items such as<br />
rolls, disks, mandrels, etc., and is expected ultim ately to be substantially<br />
reduced.<br />
For the sake of completeness, additional questions m ust be<br />
F i g . 7<br />
D ia g r a m o f S t a g e s i n R o l l in g O p e r a t i o n<br />
are not used. The average elongation is about 2, which means<br />
th at the tube has twice the length of the hollow blank. In this<br />
manner, piercer output and elongator output are about alike, and<br />
the highest rate of combined production results.<br />
F i g . 6<br />
T u b e P a r t ia l l y R o l l e d F r o m E c c e n t r ic B l a n k<br />
discussed briefly; one is the diameter of the cross-rolls. They<br />
must be rigid enough to roll the thinnest practical tube without<br />
noticeable deflection, even if the tem peratures among the blanks<br />
vary. Designers prefer to be on the safe side and make them<br />
somewhat larger than the needed neck diameter implied, rather<br />
than too small. The next question is th a t of greatest possible<br />
elongation. The Diescher elongator has rolled with 5 elongations,<br />
which means th a t the delivered tube is 5 times as long as the<br />
entering hollow blank. In practice, such extreme elongations<br />
C o n c e n t r ic it y o f D ie s c h e r M il l T u b e s<br />
The elongator mill has gained a reputation for producing concentric<br />
tubes. This statem ent m ay be discussed from two angles,<br />
viz., the importance of concentricity, and the reasons why the<br />
Diescher mill attains it. The importance of concentricity is<br />
realized by all consumers of tubing and therefore need not be<br />
stressed here. The next question is: Does the elongator produce<br />
concentric tubes and, if so, why? The fact th a t it produces<br />
concentric tubes m ay be judged from Fig. 6, which shows a tube<br />
th a t had been rolled p art way from an eccentric blank. The<br />
latter had been bored out of center. The reason for rolling a<br />
bored blank instead of a blank produced by cross-rolling is th a t a<br />
uniformly eccentric blank cannot be obtained from a piercing mill<br />
because, in the latter, the piercing plug meanders, following fortuitous<br />
soft spots caused by nonuniform heating or segregation.<br />
In turning now to reasons for the concentricity of tubes rolled<br />
on the elongator mill, it is conceivable th at, when the tube blank<br />
first enters, an eccentric blank would vibrate the mandrel with<br />
high frequency, whereby resisting forces are produced which, in<br />
conjunction w ith the well-known fact th at thick walls are more<br />
easily deformed th an thin walls, tend to reduce the eccentricity<br />
of the workpiece. Furtherm ore, a thick wall portion introduced
416 TRANSACTIONS OF THE A.S.M.E. JULY, 1941<br />
into the cleft between the rolls and the mandrel emanates therefrom<br />
more pronouncedly than its companion thinner wall portion,<br />
rubs harder against the elongator disks, becomes hotter, and is<br />
more easily turned into length. By the combined effect of these<br />
actions, the mandrel becomes centered by the time the tube is<br />
traversing the long finishing pass, which in Fig. 7 reaches from C<br />
to D. From then on, the remainder of the tube (which means<br />
almost the entire length) is forced through the spaces between<br />
the rolls and a concentrically held mandrel, whereby concentricity<br />
is obtained. I t goes w ithout saying th at concentricity as used in<br />
practice is a relative term, and th a t maximum approach to perfect<br />
concentricity requires maximum rigidity of the mill.<br />
C o n c l u s io n<br />
In conclusion, we m ay consider the economic side of the<br />
m atter: Under w hat conditions should existing equipm ent be<br />
replaced by an elongator mill? Up to the present time, this<br />
question has not arisen in practice, because the four mills which<br />
are now in operation were installed as additional equipment for<br />
the purpose of making a product which heretofore could not be<br />
made, i.e., a hot-rolled, seamless, concentric tube with very<br />
smooth surfaces. Upon inquiry the author discovered th at the<br />
patent owner, the Diescher Tube Mills, Inc., has a very commendable<br />
policy; new licenses seem unlikely to be solicited unless the<br />
existing mills cannot cope with the demand.<br />
Given experimental data for the curve of variation of speed<br />
versus coefficient of internal friction of steel a t the temperature<br />
a t which the m etal is to be worked, and the curve of variation of<br />
the coefficient of external friction versus speed for hot or cold<br />
steel, would it not be possible to predetermine the relative speeds<br />
of the cross rolls and the elongator rolls of the Diescher machine<br />
for optimum performance w ith engineering certainty? It is<br />
the common impression among steel men th at all mills of this<br />
general type are hard to get started in successful production on<br />
any but a product which has already been fully standardized in<br />
production. Apparently this is due to the difficulty of obtaining<br />
just the right relative tangential and longitudinal speeds. If<br />
the author can supply information which will refute this general<br />
opinion, it would be of value both to the tube manufacturer<br />
and to the m anufacturer of the tube-rolling machine.<br />
C. W. L i t t l e r . 6 From the writer’s investigations in the<br />
m atter, it is evident th a t the Diescher elongator has contributed<br />
greatly to the advancement in the art of seamless-tube manufacture.<br />
This is particularly true with reference to the ability of<br />
such a mill to m aintain uniform wall thickness within very close<br />
tolerances. I t is understood th a t elongations of 4 to 1 have been<br />
accomplished. No doubt the rotary disks add greatly to this<br />
possibility. The uniformity achieved on such a tube coming<br />
from the elongator has a beneficial effect on the reducing mill.<br />
D iscussion<br />
A. B. C ox.2 In the Diescher tube-rolling machine, as in steelrolling<br />
processes in general, successful operation is dependent<br />
upon relative values of external and internal friction. The great<br />
importance of this principle in the field of rolling materials may<br />
therefore justify some comment on this phase of the paper.<br />
At one point the author states th a t the theroetical derivation<br />
of relative speeds of cross rolls and longitudinal rolls is based on<br />
the assumption th a t the coefficient of external friction is independent<br />
of the speed, i.e., relative motion or slip, which previously<br />
had been taken as zero. The w riter knows of no experim<br />
ental data which would justify this assumption of a constant<br />
coefficient of friction for all speeds. Regardless of whether the<br />
friction is dry or lubricated, experimental data show th a t the coefficient<br />
of friction varies very widely w ith speed.3 If the<br />
coefficient of friction between hot and cold steel is constant over<br />
any considerable range of speed, a citation to the data which show<br />
this should be of interest.<br />
The author also refers to the laws of plastic flow, which brings<br />
up the subject of internal friction. I t is well known th at, in<br />
general, the resistance of a solid to deformation varies with the<br />
rate of deformation. The ease of flow, or “flowability” of the<br />
material, increases w ith increase in the rate of deformation; at<br />
least for low and interm ediate rates of deformation. Conversely,<br />
the coefficient of viscosity (or coefficient of internal friction) decreases.4<br />
This is true of all materials for which data are available.<br />
The coefficient of viscosity for all materials, solid, liquid,<br />
or gaseous, follows the same law. I t is only when data are taken<br />
over a relatively limited range of speed th a t the coefficient appears<br />
to be approximately constant in some cases. This is true<br />
even for water and for air. Hence, it is extremely probable th at<br />
the coefficient of internal friction of steel, no m atter how cold<br />
or how hot, varies greatly w ith rate of deformation.<br />
2 South Hills, Pittsburgh, Pa.<br />
3 “Journals and Bearings” section, L. S. Marks, Mechanical Engineers’<br />
Handbook, third edition, 1930. Stribeck data for a lubricated<br />
journal, pp. 243, 244.<br />
* Refer to Bibliography on subject of “Friction,” by Committee<br />
E -l, American Society for Testing Materials, 260 S. Broad Street,<br />
Philadelphia, Pa<br />
G. A. P u g h . 6 The Diescher elongator finishes pierced blanks<br />
into seamless tubes, eliminating interm ediate operations such as<br />
pilgering, plug rolling, and reeling. The plug-rolling and reeling<br />
interm ediate operations are employed by most of the tube manufacturers<br />
in this country.<br />
The urge to eliminate the plug-rolling mill, as a means of elongating<br />
pierced hollows, is a natural one, since the plug-rolling<br />
operation is irrational and contributes most of the difficulties<br />
usually considered inherent w ith the manufacture of seamless<br />
tubes. For the sake of clarity, it should be understood th at the<br />
Diescher mill has been used for tube sizes having a maximum<br />
diam eter of about 4 in. The hot finishing of tubes of light wall,<br />
smaller than 4 in. diam, has been a difficult problem and the<br />
Diescher development along this line is noteworthy. Qualities<br />
of the product, such as accuracy of wall thickness and reduction<br />
in the percentage of eccentricity, have made the unit a commercial<br />
success.<br />
On the other hand, large-diameter hot-finished tubes have been<br />
successfully finished by cross rolling, as for example, by the rotary<br />
rolling method employed by the N ational Tube Company.<br />
As one of the developments of R. C. Stiefel, mention was made of<br />
it in a paper7 presented in 1928. The use of a second piercer, as a<br />
means of elongating pierced hollows, also has been widely employed<br />
by all of the makers of large sizes of seamless tubes.<br />
I t will be interesting to note the development in the Diescher<br />
mill as tim e goes on and to w hat degree it m ay be adapted for<br />
the production of large sizes of tubes. Certainly, there m ust come<br />
a day when the economic demand and the necessity for closer<br />
wall tolerances will force engineers to adopt methods which make<br />
such attainm ents possible.<br />
C. R. S a d i . k r . s This paper has been of particular interest to<br />
the writer who was closely concerned in the installation of the<br />
6 Chief Engineer, Jones & Laughlin Steel Corporation, Pittsburgh,<br />
Pa. Mem. A.S.M.E.<br />
• Youngstown, Ohio. Mem. A.S.M.E.<br />
7 “The Manufacture of Seamless Tubes,” by R. C. Stiefel and<br />
G. A. Pugh, Trans. A.S.M.E., vol. 49-50, 1927-1928, paper IS-50-7,<br />
pp. 17-22.<br />
8 American Munitions Division of American Type Founders, Inc.,<br />
Elizabeth, N. J.
TRINK S—PRODUCTION OF SEAMLESS TUBES 417<br />
first elongator, and for several years was personally familiar<br />
with its operation. As the author states, this is the first tim e the<br />
theory underlying the “elongator” method of producing tubes<br />
has been published. The statem ents in his paper are borne out<br />
by the writer’s experience.<br />
While this paper makes mention of the concentricity of the<br />
tubes produced by this process and refers to tests made w ith an<br />
eccentrically drilled blank, the actual wall measurements of the<br />
blank in question were not stated. I t m ay be of interest to know<br />
th at these wall dimensions were as follows:<br />
t, , . / 0.120 in. minimum<br />
Before processing....................................... < „ .<br />
1.0.358 m. maximum<br />
. . . . / 0.095 in. minimum<br />
After processing......................................... < n ir,. .<br />
* 1.0 104 m. maximum<br />
Another advantageous feature of the elongator method is<br />
the smooth interior surface of the product. Internal scratches<br />
have always been the bugbear of the seamless-tube industry,<br />
and no satisfactory method has been devised for their removal.<br />
For this reason, a method of hot rolling was sought in which<br />
scratches could not occur. N aturally, attention was turned to<br />
the idea of rolling tubes over a smooth bar rather than over a<br />
plug. Of the various methods of accomplishing this, the elongator<br />
method has proved to be the most satisfactory. The reason for<br />
this will be apparent from a study of Fig. 1 of the paper. It will<br />
be noted th a t there is but a slight sliding movement between the<br />
tube and the bar, and th a t the tube is in m om entary rolling contact<br />
w ith the bar a t only two points during the operation. Thus,<br />
there exists no tendency to produce scratches or scores in the<br />
tubes. N ot only is this a very desirable feature in the production<br />
of hot-finished tubes, but where tubes are subsequently cold<br />
drawn it results in the production of superior tubes w ith fewer<br />
cold-draw passes.<br />
Another feature is that, while the process is suitable for any<br />
size tube, smaller hot-finished tubes have been successfully produced<br />
by this method than were possible before its introduction.<br />
The advantage of this will be apparent to any tube m anufacturer<br />
who has had experience with the difficulties inherent in hot<br />
sinking.<br />
A u t h o r ’s C l o s u r e<br />
The constructive character of the discussion which has been<br />
offered on the present paper is very much appreciated. Additional<br />
facts have been presented and they are helpful in the understanding<br />
of the process.<br />
M r. Cox recommends th a t additional research work be done<br />
on the friction between blank and rolls and also on the internal<br />
friction within the blank. Inform ation on these problems has<br />
been accumulating for some tim e but as yet is not adequate for<br />
presentation.
T he Flow of S a tu rate d W a te r<br />
T hrough T h ro ttlin g Orifices<br />
B y M. W. B E N JA M IN 1 a n d J. G. M ILL E R ,8 D ETR O IT, M ICH .<br />
In th is paper are presented th e results o f tests to determ<br />
ine th e flow characteristics for saturated w ater and for<br />
various m ixtures o f saturated w ater and steam th rou gh<br />
sharp-edged th in -p la te orifices. T ests show th a t th e actu<br />
al flow o f saturated w ater th rou gh th ese orifices is con <br />
siderably greater th a n w ould be expected from theoretical<br />
calculation based upon a change o f state and th a t n o critical<br />
back-pressure con d ition is evident over th e range o f<br />
in itial pressures considered. P rim arily, th is in vestigation<br />
was intended to determ ine th e feasib ility o f usin g th ro t<br />
tlin g orifices alone or in com b in ation w ith float-operated<br />
drainers for regulating th e draining o f condensate from<br />
feedwater heaters. T he tests w hich form th e basis o f th e<br />
paper have provided sufficient inform ation to p erm it th e<br />
derivation o f practical design form ulas, w hich have been<br />
used successfully in several in stan ces by th e authors’ com <br />
pany. T hese te st data apply only to th rottlin g orifices<br />
and should n ot be used to design orifices for m eterin g purposes.<br />
An Appendix to th e paper show s th e application o f<br />
the form ulas to th e design o f a single-stage orifice to drain<br />
th e condensate from a feedw ater heater, and to th e design<br />
o f an orifice to be used in series w ith a float-operated<br />
drainer.<br />
E<br />
ARLY in 1939, the authors became actively interested in the<br />
flow of boiling water through pipes in connection w ith the<br />
rapid erosion of elbows in heater drain piping on a 60,000-kw<br />
steam turbine. After some study, it was found th a t erosion was<br />
a function of the am ount of flashing and the quantity of water<br />
flowing in the pipe, and interest in the subject was intensified by<br />
the indication th at certain operating difficulties w ith float-operated<br />
condensate drainers also might be traced to the phenomena<br />
encountered w ith w ater flashing into steam in the drainer discharge<br />
pipe.<br />
In a paper* by Bottomley, the suggestion was made th a t orifices<br />
could be used in place of float-operated traps for draining feedwater<br />
heaters. Such an application would eliminate the operating<br />
troubles w ith traps and, if the orifices were installed a t the<br />
end of the drain line rather th an a t the beginning, would prevent<br />
erosion in the piping.<br />
While the theoretical analysis of the flow of saturated water<br />
(water a t saturation tem perature and pressure) through orifices,<br />
which assumes a change of state in the orifice, seemed straightforward<br />
enough, the limited published test data showed the actual<br />
capacity of an orifice passing saturated water to be several times<br />
greater than its theoretical capacity. Since the available test<br />
1 Engineer, Engineering Division, The Detroit Edison Company.<br />
Mem. A.S.M.E.<br />
* Engineer, Engineering Division, The Detroit Edison Company.<br />
Jun. A.S.M.E.<br />
* “Flow of Boiling Water Through Orifices and Pipes,” by W. T.<br />
Bottomley, Trans. North-East Coast Institution of Engineers and<br />
Shipbuilders (England), vol. 5 3 , 1 9 3 6 -1 9 3 7 , pp. 6 5 - 1 0 0 .<br />
Contributed by the Power Division, and presented at the Annual<br />
Meeting, New York, N. Y., December 2 - 6 , 1 9 4 0 , o f T h e A m e r i c a n<br />
S o c i e t y o p M e c h a n i c a l E n g i n e e r s .<br />
N o t e : Statements and opinions advanced in papers are to be<br />
understood as individual expressions of their authors and not those<br />
of the Society.<br />
data were not complete and because practical coefficients were<br />
needed for actual design purposes, it was decided to conduct an<br />
experimental investigation of the flow of saturated w ater through<br />
sharp-edged thin-plate orifices to determine whether it would be<br />
practicable to use such orifices in lieu of traps for draining feedw<br />
ater heaters.<br />
While the tests which form the basis of this paper do not cover<br />
all the variables which m ight have been investigated, they are<br />
sufficiently complete to provide a practical basis for design th a t<br />
has been applied successfully in several instances.<br />
In this paper the term “saturated w ater” is used in preference<br />
to “hot” or “boiling” w ater as used by earlier writers, since it is<br />
considered to be more definite and possibly more accurate. I t is<br />
used to denote w ater a t saturation pressure and tem perature, and<br />
refers to the condition of the w ater on the upstream side of the<br />
orifice.<br />
C o m p a r i s o n o f T h e o r e t i c a l a n d A c t u a l F l o w o f S a t u r a t e d<br />
W a t e r T h r o u g h O r i f i c e s<br />
The theory of the flow of saturated w ater has been thoroughly<br />
covered in several published papers4 and, therefore, will not be<br />
repeated here.<br />
For purposes of comparison, Fig. 1 shows the theoretical and<br />
actual flow of saturated w ater through orifices for an initial pressure<br />
of 145 psi abs and back pressures ranging from 0 to 145 psi<br />
abs, while Fig. 2 shows the maximum theoretical and actual flow<br />
through orifices for initial pressures ranging from 14.7 to 300 psi<br />
abs and a constant back pressure of 14.7 psi abs.<br />
E x p e r i m e n t a l I n v e s t i g a t i o n o f F l o w o f S a t u r a t e d W a t e r<br />
T h r o u g h O r i f i c e s<br />
Fulfillment of the purpose of the test required th a t several<br />
points be kept in m ind concerning the design of the orifices and<br />
test equipment, as follows:<br />
1 T h at the draining of condensate from a higher-pressure to a<br />
lower-pressure feedwater heater is primarily a throttling process.<br />
2 T h at the controlling factors to be considered in designing an<br />
orifice for draining condensate from one heater to another for<br />
maximum load on a turbine are (a) the pressure differential between<br />
the heaters; (6) the initial tem perature and pressure of the<br />
condensate; and (c) the quantity of condensate to be drained<br />
from the higher-pressure heater. The initial tem perature of the<br />
condensate will be the saturation tem perature corresponding to<br />
the initial pressure in all cases except those in which there is undercooling.<br />
The effect of undercooling on the flow of the condensate<br />
through an orifice is in general the same as the effect of a static<br />
head on the upstream side.<br />
4 “Experimental Researches on the Flow of Steam Through Nozzles<br />
and Orifices,” by A. Rateau, D. Van Nostrand & Co., New York,<br />
N. Y., 1 9 0 5 , supplementary chapter at end of book, pp. 6 2 - 7 4 .<br />
“Discharge Capacity of Traps,” by A. E. Kittredge and E. S.<br />
Dougherty, Combustion, vol. 6 , September, 1 9 3 4 , pp. 1 4 -1 9 .<br />
“Fluid Flow Through Two Orifices in Series,” by Milton C. Stuart<br />
and D . Robert Yarnall, Mechanical Engineering, vol. 5 8 , 1 9 3 6 , p p .<br />
4 7 9 -4 8 4 .<br />
“Flow of Boiling Water Through Orifices and Pipes,” by W. T.<br />
Bottomley, Trans. North-East Coast Institution of Engineers and<br />
Shipbuilders (England), vol. 5 3 , 1 9 3 6 -1 9 3 7 , pp. 6 5 -1 0 0 .<br />
“The Flow of Hot Water Through a Nozzle,” by B. Hodkinson,<br />
Engineering (London), vol. 1 4 3 , 1 9 3 7 , pp. 6 2 9 -6 3 0 .<br />
419
420 TRANSACTIONS OF T H E A.S.M.E. JULY, 1941<br />
3 T hat all of the factors given under (2) decrease with a drop<br />
in load on the turbine; and it is possible th at an orifice designed<br />
for full load will be larger than needed to pass the condensate at<br />
reduced load even though the pressure differential across the orifice<br />
also is reduced. In such a case, some steam will be cascaded<br />
to the lower-pressure heater along with the condensate. This<br />
means th at more steam will be bled from the higher-pressure tur-<br />
bine stage than is necessary for its own stage of feedwater heating,<br />
which in turn m ay reduce the turbine cycle efficiency somewhat,<br />
especially if the am ount of steam cascaded is excessive.<br />
Therefore, in order to provide the necessary test data for designing<br />
orifices to drain the condensate from feedwater heaters,<br />
the test equipm ent was built to perm it the determ ination of (a)<br />
the flow of saturated w ater through orifices for various initial and<br />
back pressures; (6) the effect on the flow of saturated water<br />
through orifices produced by a static head above the orifice (undercooling);<br />
and (c) the effect on the flow of passing steam<br />
through the orifice along w ith the water.<br />
Design of Orifices. While it is not an established fact, it is<br />
expected th a t long-continued throttling m ay produce wear or<br />
erosion of the orifice w ith consequent passage of steam a t all tu r<br />
bine loads. To prevent loss of cycle efficiency it might be necessary<br />
to make periodic replacements and, for this reason, any<br />
heater drain-line orifice should be simple to make and easy to replace<br />
in service. If the orifice plate is made of corrosion-resisting<br />
steel, experience shows that, where no change of state occurs,<br />
there will be little if any wear of the sharp edge of the orifice;<br />
however, w ith orifices installed in hot-drip systems, considerable<br />
erosion due to flashing or cavitation has been noted on the downstream<br />
face of the orifice plate. I t should be noted here th at<br />
drain-line orifices are not intended for metering purposes.<br />
Fig. 3 shows the design and Table 1 gives the diameters of the<br />
orifices used in this investigation. These orifices were installed<br />
in a horizontal 6-in. pipe.<br />
TABLE 1<br />
D IA M ETER S OF O RIFICES USED IN INVESTIGATION<br />
Orifice<br />
Orifice diameter,<br />
number<br />
in.<br />
1 .............0.247<br />
2 ..............0 .3 6 9<br />
3 ..............0 .3 6 4<br />
4 ..............0 .5 0 3<br />
5 .............. 0.6 1 4<br />
6 .............. 0 .7 0 7<br />
7 .............. 0 .8 7 9<br />
F i g . 1<br />
T h e o r e t i c a l a n d A c t u a l C h a r a c t e r i s t i c s f o r F i . o w o f<br />
S a t u r a t e d W a t e r T h r o u g h O r i f i c e s<br />
( In it ia l pressure, 145 psi abs.)<br />
ORIFICE PLATE MADE OF LOW-CARBON STEEL<br />
UPSTREAM FACE FINISHED ON LATHE<br />
F i g . 3<br />
D e s i g n o f O r i f i c e s U s e d i n T e s t s o f F l o w o f S a t u r a t e d<br />
W a t e r<br />
F i g . 2 A c t u a l F l o w a n d M a x im u m T h e o r e t i c a l F l o w o f S a t u <br />
r a t e d W a t e r T h r o u g h S h a r p - E d g e d O r i f i c e s<br />
(Initial pressures ranging from 14.7 to 300 psi abs and a constant back pressure<br />
of 14.7 psi abs.)<br />
Description of Test Equipment. Equipm ent used in the orifice<br />
tests consisted of the following:<br />
1 A flash tank for regulating the pressure and supply of saturated<br />
water.<br />
2 A set of orifices and a flanged holder for them.<br />
3 A heat exchanger.<br />
4 Two weigh tanks—one for the condensate and another for<br />
the heat-exchanger cooling water.<br />
5 Temperature-measuring apparatus.<br />
6 Pressure gages.<br />
The schematic arrangement of the equipment and the relative<br />
location of thermocouples and of pressure gages is illustrated in<br />
Fig. 4.<br />
Fig. 5 shows an orifice clamped in the flanged holder. The<br />
short glass filler immediately downstream from the orifice was<br />
used to perm it visual observation and photography on some of<br />
the runs. During most of the tests, however, a steel filler was<br />
used.<br />
All tem peratures were measured with iron-constantan thermocouples,<br />
calibrated for 8 in. immersion and a reference junction<br />
tem perature of 32 F. Calibration of the couples is believed to be<br />
accurate within ± 0.5 F and, because of the depth of immersion<br />
and the precautions taken to prevent air circulation around the<br />
couples in their wells, it is believed th a t the measured temperatures<br />
are in error by no more than ±0.5 F. The design of the<br />
thermocouple well is shown in Fig. 6.<br />
Operation of Equipment. The controlling conditions in operat-
B EN JA M IN , M ILL E R —T H E FLOW OF SATURATED W A TER TH ROUGH T H R O TTLIN G O R IFIC ES 421<br />
F ig . i S c h e m a t i c L a y o u t o f<br />
E q u i p m e n t f o r T e s t i n g t h e<br />
F l o w o f S a t u r a t e d W a t e r<br />
T h r o u g h S h a r p - E d g e d<br />
O r i f i c e s<br />
F i g . 5 O r i f i c e a n d G l a s s -<br />
F i l l e r A s s e m b l y<br />
ing the test equipment were the pressure and w ater level in the<br />
flash tank and the back pressure on the orifice. For any given<br />
test, the required combination of these conditions was obtained<br />
by balancing the flow of 400-F w ater into the flash tank through<br />
valve Vi against the flow of flashed steam through vent valve Fj<br />
and of water or a mixture of w ater and steam through the orifice<br />
and back-pressure control valve Vt. Usually about 15 min were<br />
required to obtain the desired combination of pressures and water<br />
level, but once this condition was established slight adjustm ent of<br />
the valves was sufficient to m aintain it because of the relatively<br />
constant pressure and tem perature of the water supply. For the<br />
tests in which the orifice was passing both water and steam, the<br />
water level remained constant a t about the center line of the<br />
horizontal 6-in. pipe and was of secondary importance. However,<br />
for the tests in which only saturated w ater passed through<br />
the orifice, the w ater level was established a t from 3 to 8 in. above<br />
the center line of the orifice and was m aintained a t the established<br />
level within ± 1/ i in. In the tests to determine the flow with a<br />
F i g . 6 D e s i g n o f T h e r m o c o u p l e W e l l U s e d i n T e s t s t o D e t e r <br />
m i n e F l o w o f S a t u r a t e d W a t e r T h r o u g h S h a r p - E d g e d O r i f i c e s
422 TRANSACTIONS OF T H E A.S.M.E. JULY, 1941<br />
static head above the orifice, the flash tank was filled w ith water<br />
under a pressure greater than the saturation pressure corresponding<br />
to the water tem perature. However, in all cases, the inletwater<br />
tem perature was above the saturation tem perature corresponding<br />
to the back pressure on the orifice.<br />
all the various sizes of orifices listed under “Design of Orifices.”<br />
Fig. 8 shows the flow of saturated water when a mixture of<br />
steam and water is passed through an orifice. The curves are<br />
arranged to show how the initial pressure, back pressure, and<br />
relative amounts of steam, included in the mixture, affect the<br />
T e s t R e s u l t s<br />
The test data give the actual flow of saturated water through<br />
sharp-edged thin-plate orifices for various initial pressures and<br />
show the effect on this flow of (a) varying the back pressure on the<br />
BACK PRESSURE , PSI ABS<br />
F i g . 7 A c t u a l F l o w o f S a t u r a t e d W a t e r T h r o u g h S h a r p -<br />
E d g e d O r i f i c e s<br />
orifice, (6) passing steam along w ith the water, and (c) a static<br />
head above or undercooling before the orifice.<br />
The actual flow of saturated w ater through orifices, on the basis<br />
of pounds per second per square foot of orifice area as found on<br />
test for five initial pressures and various back pressures, is presented<br />
in Fig. 7. The results given were obtained from tests of<br />
STEAM PASSED WITH WATER , LB PER LB OF WATER<br />
F i g . 8 A c t u a l F l o w o f S a t u r a t e d W a t e r T h r o u g h S h a r p -<br />
E d g e d O r i f i c e s W h e n P a s s i n g M i x t u r e o f S t e a m a n d W a t e r<br />
BACK PRESSURE, PSI ABS<br />
F i g . 9 A c t u a l F l o w o f S a t u r a t e d W a t e r T h r o u g h S h a r p -<br />
E d g e d O r i f i c e s W h e n P a s s i n g V a r i o u s M i x t u r e s o f S t e a m a n d<br />
W a t e r<br />
F i g . 10<br />
E f f e c t o f S t a t ic H e a d o n F l o w o f S a t u r a t e d W a t e r<br />
T h r o u g h S h a r p - E d g e d O r i f i c e s
BENJAM IN, M ILLER—THE FLOW OF SATURATED WATER THROUGH THROTTLING ORIFICES 423
424 TRANSACTIONS OF T H E A.S.M.E. JULY, 1941<br />
flow. It is im portant to note th at the am ount of steam passed is<br />
given as a fraction of 1 lb per lb of water and th at the total weight<br />
actually passed by the orifice is the sum of the weights of water<br />
and steam. Fig. 9, obtained by combining the data for initial<br />
pressures of 75, 103, and 145 psi abs from Fig. 7 w ith the data<br />
from Fig. 8, shows clearly and in convenient form the effect of<br />
passing steam with the water.<br />
Should the rate of supply exceed the capacity of an orifice, a<br />
static head of water will build up above the orifice. Therefore,<br />
the water a t the orifice center line will be under a pressure in exess<br />
of the saturation pressure corresponding to the tem perature by<br />
the am ount of the static head. Under this condition the fraction<br />
of w ater flashed into steam in passing to a region of lower pressure<br />
will be exactly the same as though the orifice were merely submerged,<br />
but the capacity of the orifice is increased somewhat as a<br />
result of the increase in pressure drop across it represented by the<br />
static head. An equivalent case is one in which the orifice is<br />
passing hot w ater a t a normal level but undercooled to some extent<br />
below the saturated tem perature. For instance, cooling the<br />
water from a saturation tem perature of 332.1 F down to 317.1 F,<br />
while maintaining the original saturation pressure of 106 psi abs,<br />
is the same condition as having an equivalent static head of 20 psi<br />
(50.7 ft) above saturation pressure with water a t 317.1 F. Consequently,<br />
the test data for both conditions are presented on the<br />
basis of a static head above the orifice. Fig. 10 shows how static<br />
heads of from 0 to 70 ft affect the flow a t three different initial<br />
saturation pressures.<br />
The photographs, reproduced in Fig. 11, show the flow leaving<br />
the downstream face of the orifice for two initial pressures and<br />
various back pressures. The two upper sets of pictures are from<br />
tests in which no steam was passed w ith the water, while the two<br />
lower sets are from tests in which steam was passed through the<br />
orifice with the w ater as indicated. In the two upper groups of<br />
pictures, it is interesting to note th at, for the higher back pressures,<br />
the flow leaves the orifice in the form of a jet w ith practically<br />
no flashing evident within the length of the glass filler. As<br />
the back pressure decreases, however, flashing occurs nearer the orifice<br />
as shown by the breaking up of the jet, and the lower the back<br />
pressure the nearer to the orifice the flashing occurs until, a t 15<br />
psi abs back pressure, the flashing begins a t the orifice downstream<br />
face.<br />
A n a l y s is o f R e s u l t s<br />
As far as is known, the results presented in this paper and those<br />
given by W. T. Bottom ley,3 are the only published test data<br />
which give the actual flow of saturated w ater through orifices. In<br />
his tests, Bottomley could not, because of limitations in his equipment,<br />
determine the effects on the flow caused by (a) varying the<br />
back pressure, (6) passing steam with the water, and (c) a static<br />
head above or undercooling before the orifice. The results of some<br />
of his tests, however, agree very closely w ith the results found in<br />
this investigation as shown in Fig. 2. In accordance with the<br />
theory, Bottomley assumed that, even though the actual flow was<br />
several times greater than the theoretical, there m ust be a critical<br />
pressure in the orifice; therefore, all of his tests were run with an<br />
atmospheric back pressure (14.7 psi abs), which was considered<br />
below the actual pressure in the orifice. The data obtained in the<br />
present investigation and presented in Fig. 7 do not show' the<br />
presence of a critical pressure in the orifice, and the pictures in<br />
Fig. 11 seem to bear out the conclusion that, for the range of<br />
initial pressures included in this study, no critical pressure exists<br />
in the orifice. In other words, the change of state does not occur<br />
within the orifice.<br />
It is a well-known fact th at the weight of steam which will flow<br />
through a nozzle is a maximum when the throat pressure is approximately<br />
58 per cent of the upstream pressure. A decrease of<br />
back pressure below 58 per cent of the initial will have no effect on<br />
the flow. This, however, is not true for steam flow through a<br />
sharp-edged orifice, as is shown by the typical curves5 in Fig. 12.<br />
Fig. 7 show's a similar orifice characteristic for saturated water,<br />
w'hich further substantiates the conclusion th at no critical pressure<br />
will exist in a sharp-edged orifice passing saturated water,<br />
even though the pressure differential across the orifice is sufficient<br />
to cause flashing a t the downstream face. W hether or not a<br />
critical pressure will exist in the throat of a nozzle passing saturated<br />
water cannot be determined from the results of this investigation.<br />
F i g . 12 T y p ic a l C u r v e s S h o w in g R e l a t i v e F l o w o f S t e a m<br />
T h r o u g h O r i f i c e s a n d N o z z l e s<br />
An orifice, operating between fixed initial and back pressures,<br />
will pass a given am ount of saturated water according to data in<br />
Fig. 7. If the am ount of saturated water available is less than<br />
the orifice is capable of passing, a small amount of steam will flow<br />
through the orifice with the water. The am ount of steam which<br />
will flow depends upon the initial pressure, the back pressure, and<br />
the quantity of water available. For instance, if the initial and<br />
back pressures are 145 and 40 psi abs, respectively, and the<br />
am ount of saturated water to be passed is 2600 lb per sec per sq ft<br />
of orifice area, Fig. 9 shows th at 0.02 lb of steam will pass through<br />
the orifice w ith each pound of water. From Fig. 8, it is seen that<br />
the w ater flow changes quite rapidly with an increase in steam flow<br />
from 0 to 0.04 lb per lb of w ater; however, for an increase in<br />
steam flow above 0.04 lb. per lb, the change in water flow is mu; h<br />
slower. This fact is also shown in Fig. 9 where the curves crowd<br />
together as the steam-flow fraction increases.<br />
The curves shown in Fig. 7 are of the same general shape as the<br />
curve giving the flow of “cold” water (70 F) through orifices,<br />
w'hich is represented by the equation<br />
where Q = the flow in cu ft per sec, A = area in sq ft, h = head in<br />
ft of flowing fluid, and C = orifice coefficient. By substituting<br />
144<br />
wv for Q and — (pt — p2) for h, the equation takes the form<br />
p<br />
in which w = weight of flow in lb per sec, p l = initial pressure in<br />
psi abs, p2 = back pressure, v = specific volume of saturated<br />
water at pi in cu ft per lb, and p = density of saturated water at pi<br />
in lb per cu ft. The equation in this form applies readily to the<br />
flow' of saturated water through sharp-edged orifices, and values<br />
for the orifice coefficient were found to be approximately the same<br />
as those for 70 F water. As in the case of cold water, the orifice<br />
s “ T h e rm o d y n a m ic s ,” b y J . E . E m sw ile r, F ir s t ed itio n . M cG raw -<br />
H ill B o o k C o m p a n y . In c ., N ew Y o rk , N . Y ., 1921, p. 225.<br />
“ T h e L e a k a g e of S te a m T h ro u g h L a b y rin th S eals.” by A dolp h<br />
E gli, T ra n s . A .S .M .E ., vol. 57, 1935, p p . 115-122.
BENJAM IN, M ILLER —T H E FLOW OF SATURATED W A TER THRO UGH TH R O TTLIN G O R IFIC ES 425<br />
coefficient decreases with an increase in pressure differential<br />
(head) and orifice diameter. There is also some indication th at<br />
the coefficient decreases as the initial tem perature (saturation<br />
pressure) increases. The data are not complete enough, however,<br />
to make it possible to determine the numerical effect of a variation<br />
in orifice diameter or initial tem perature. No attem pt was made<br />
to correlate the orifice coefficients with respect to the diameter<br />
ratio since it was thought to be an unw arranted refinement in the<br />
design of throttling orifices for which the diam eter ratios are<br />
usually low. Fig. 13 gives average values of the orifice coefficient<br />
for different values of differential head. These are considered<br />
sufficiently accurate for many design purposes, w ithout correcting<br />
for effect of orifice diameter, initial tem perature, or diam eter ratio.<br />
Equation [2] and the orifice coefficients given in Fig. 13 m ay be<br />
used also to calculate the flow of saturated w ater through an<br />
orifice when there is a static head. In this case, however, the<br />
density of the water depends upon the tem perature rather than<br />
the pressure a t the orifice.<br />
U s e o f S i n g l e -S t a g e O r i f i c e s f o b D r a i n i n g C o n d e n s a t e<br />
F r o m F e e d w a t e r H e a t e r s<br />
The two im portant functions performed by a float trap on a<br />
feedwater heater are draining the heater and maintaining the<br />
F i g . 13<br />
D is c h a r g e C o e f f i c i e n t f o r F l o w o f S a t u r a t e d W a t e r<br />
T h r o u g h S h a r p - E d g e d O r i f i c e s<br />
proper pressure differential between the heater and the drain receiver.<br />
The float-operated drainer performs these functions by<br />
means of a, balanced valve, actuated by a float, which responds to<br />
changes in hot-well level determined by the quantity of drains.<br />
However, these tw'O functions can be performed also by a fixed<br />
opening such as a pipe or an orifice and the size of the opening<br />
may be varied over a wide range w ithout causing operating difficulty<br />
or appreciable therm al loss. For instance, the float-operated<br />
trap on a certain heater failed to function at full load on the<br />
turbine because of the relatively high pressure drop across the<br />
trap valve and, in order to keep the turbine in operation, the<br />
heater was drained for several weeks through a 3-in. by-pass<br />
around the trap. In this case, since the 3-in. line was several<br />
times as large as needed for normal flow, considerable steam cascaded<br />
to the next lower pressure heater with the drains. There<br />
was, however, no noticeable decrease in heater pressure or cycle<br />
efficiency.<br />
The trap on this heater has since been replaced by a 3/ 4-in-diam<br />
single-stage orifice which has been operating successfully for<br />
several months. The size of this orifice was determined for fullload<br />
condition on the turbine by use of the data given in this paper.<br />
At full load practically no steam is passed by the orifice but<br />
for two-thirds load, it is estimated th at 0.015 lb of steam is passed<br />
with each pound of condensate. The method of determining the<br />
orifice diam eter and the am ount of steam passed at reduced loads<br />
is given in detail in the Appendix to this paper.<br />
W hether the turbine cycle efficiency will be affected adversely<br />
by cascading some steam between heaters a t partial loads depends<br />
upon the relative energy drop from the throttle to each extraction<br />
point and to the condenser, the method of returning the heater<br />
drains to the feedwater circuit, and the relative am ount of partialload<br />
operation.<br />
U s e o f O r i f i c e s i n S e r i e s W i t h T r a p s<br />
In cases which require the use of float-operated drainer traps to<br />
eliminate thermodynam ic losses, due to cascading steam a t partial<br />
loads, it m ay happen th a t an orifice installed on the downstream<br />
side of the trap will overcome certain operating difficulties<br />
with the trap. In some instances, the large pressure difference<br />
between heaters a t high turbine loads m ay cause so much unbalance<br />
in the trap valve th a t the float can no longer operate the<br />
valve with the result th a t the heater floods. W hen an orifice is<br />
installed in series with a trap, the pressure drop between the heaters<br />
is divided between the trap and the orifice. By properly designing<br />
the orifice, the drop across the trap can be reduced sufficiently<br />
to perm it the float to operate. A method of designing an<br />
orifice to operate in series with a trap is illustrated in Appendix.<br />
While it is possible to use two orifices in series to drain feedwater<br />
heaters, it is doubtful whether in most cases they offer any<br />
advantages over the single-stage orifice. The design of two orifices<br />
to operate in series is much more difficult than the design of a<br />
single orifice and, in so far as the authors know, the quantity of<br />
steam passed at reduced loads on the turbine can be determined<br />
only by a cut-and-try method which is both involved and tedious.<br />
C o n c l u s i o n s<br />
When saturated water flows through a sharp-edged orifice, no<br />
flashing occurs until after the w ater is through the orifice and,<br />
contrary to the theory which is based on a change of state, no<br />
critical-pressure condition is evident. The quantity of saturated<br />
water th a t will flow through a sharp-edged orifice for given pressure<br />
conditions can be calculated w ith sufficient accuracy by the<br />
formula used to determine the flow of cold (70 F) water through an<br />
orifice and the discharge coefficients found for saturated water<br />
are approximately the same as those generally used for cold<br />
w'ater. When calculating the flowr of saturated water through an<br />
orifice, it is im portant to remember th a t the value of the head to<br />
use in the formula is the equivalent head in feet of water, based on<br />
the pressure drop across the orifice and the density of the saturated<br />
water.<br />
When a mixture of saturated steam and water flows through a<br />
sharp-edged orifice with given initial and back pressures a small<br />
variation in the am ount of steam in the mixture within the range<br />
of 0 to 4 per cent has a considerable effect on the total weight of<br />
mixture and, consequently, on the weight of saturated water,<br />
flowing through the orifice. For mixtures in which the quantity<br />
of steam is greater than 4 per cent, a small increase or decrease in<br />
steam content has only a slight effect on the total weight of flow.<br />
While sharp-edged thin-plate orifices may be used to drain feedwater<br />
heaters in place of float-operated traps, it is probable th at<br />
for reduced loads some steam will cascade through the orifice with<br />
the drains. No general statem ent can be made at this tim e concerning<br />
the effect on the turbine cycle efficiency of cascading<br />
small quantities of steam between heaters. Every case should be<br />
decided on its ow n merits. The necessary study will include consideration<br />
of the relative energy drop from the throttle to each<br />
extraction point and to the condenser, of the method of returning<br />
the heater drains to the feedwater circuit, and of the relative<br />
am ount of partial-load operation.<br />
It is im portant to keep in mind th a t the data presented in this
426 TRANSACTIONS OF T H E A.S.M.E. JULY, 1941<br />
paper were obtained from tests of sharp-edged thin-plate orifices<br />
and, therefore, do not apply to nozzles or short tubes. These<br />
data can be used to design a throttling orifice to drain a given<br />
am ount of saturated or nearly saturated w ater from a receiver of<br />
higher pressure to one of lower pressure and to m aintain a required<br />
pressure in the former. No attem pt should be made to<br />
use these data to design a metering orifice. If an orifice discharges<br />
into a low-pressure receiver through a pipe, the pressure<br />
loss in the discharge pipe m ust be taken into account in establishing<br />
the pressure differential across the orifice. In m any cases, the<br />
pressure drop across the orifice will be only a fraction of the total<br />
drop between receivers, since a large p art of the total m ay be required<br />
in getting the flashing mixture of water and steam through<br />
the discharge pipe. A discussion of the flow of a mixture of<br />
saturated steam and water through pipes is beyond the scope of<br />
this study and will be offered in a subsequent paper.<br />
A c k n o w l e d g m e n t<br />
The authors gratefully acknowledge the encouragement and<br />
help of Messrs. P. W. Thompson, Sabin Crocker, and W. A.<br />
C arter in preparing this report and of Messrs. E. L. Liedel and<br />
B . Griffin and the technical staff a t the D elray Plant in collecting<br />
the test data.<br />
Appendix<br />
4 X 144 X 0.00306 = 0.561; d = 0.75 inches<br />
For two-thirds load on the turbine pi = 155 psi abs; p2 = 8 5<br />
psi abs; pi — p2 = 70 psi; and p = 55.2 lb per cu ft.<br />
144 w<br />
Head = — X 70 = 183 ft; C = 0.605; - = 55.2 X 0.605<br />
55.2 A<br />
y / 2g X 183 = 3620 lb per sec per sq ft; and w = 11.1 lb per sec.<br />
W ith the initial pressure and pressure differential a t this load,<br />
the V rin. orifice is capable of passing 11.1 lb per sec of condensate.<br />
Actually from the heat-balance data, calculated on the<br />
basis of no steam flow from the heater, only 7.8 lb per sec of condensate<br />
is available; therefore, for the existing pressure conditions<br />
some steam will pass through the orifice. Curves A in Fig.<br />
14, which were obtained by cross-plotting the data from Fig. 9 for<br />
a constant back pressure of 85 psi abs, show th at with an actual<br />
flow of condensate of 2540 lb per sec per sq ft for 155 psi abs initial<br />
N o m e n c l a t u r e<br />
The following nomenclature is used in this Appendix:<br />
A = area of orifice, sq ft<br />
C = orifice coefficient of discharge<br />
d = diam eter of orifice, in.<br />
g = acceleration due to gravity, 32 fpsps<br />
h = static head, ft<br />
p = pressure, psi abs<br />
Q = flow of saturated water, cfs<br />
t = tem perature of water, F<br />
v = specific volume of saturated water, cu ft per lb<br />
w = flow of saturated water, lb per sec<br />
p = density, lb per cu ft<br />
S i n g l e -S t a g e O r i f i c e D e s i g n t o D r a i n F e e d w a t e r H e a t e r<br />
W hen determining the size of an orifice for a particular installation,<br />
it is more convenient to use Equation [2] than the data presented<br />
in Fig. 7, and it is im portant to keep in mind th at the quantity<br />
of condensate to be drained from the heater will vary for a<br />
given load on the turbine as much as ± 5 per cent, depending upon<br />
the variation in feedwater flow. From an operating standpoint,<br />
it is better to design the orifice too large rather than too small, and<br />
in practice it is recommended th at a hand-operated by-pass be<br />
installed to provide means for passing abnorm al quantities of<br />
water in case of a split or broken heater tube.<br />
assume the following values corresponding to full-load operation<br />
of a 75,000-kw turbine: w = 13.6 lb per sec; pi = 236 psi abs<br />
(at saturation tem perature); pi — p2 = 110 psi; p = 53.8 lb per<br />
144 144<br />
cu ft; head = — (p i — p 2) = — — X 110 = 294 ft; C = 0.598<br />
p 53.8<br />
(refer to Fig. 13).<br />
F i g . 1 4<br />
C u r v e s I l l u s t r a t i n g M e t h o d o f D e t e r m i n i n g S iz e o f<br />
O r i f i c e s f o r S p e c i f i e d D e s i g n C o n d it io n s<br />
pressure and 85 psi abs back pressure, approximately 0.015 lb of<br />
steam will pass through the orifice with each pound of condensate.<br />
After the approximate am ount of steam passed through the orifice<br />
has been determined, a new heat balance can be made, taking into<br />
account the steam cascaded w ith the condensate.<br />
By comparing the partial-load heat rate of the turbine cycle<br />
using orifices w ith the heat rate at the same reduced loads when<br />
only condensate is drained from the heaters, the feasibility of using<br />
orifices to drain the heaters for a particular turbine cycle can<br />
be ascertained.<br />
D e s i g n o f a n O r i f i c e t o O p e r a t e i n S e r i e s W i t h a T r a p<br />
The example just given to illustrate the design of a single-stage<br />
orifice for draining a feedwater heater can also be used to show the<br />
design of an orifice to operate in series with a trap. In designing<br />
an orifice to operate w ith a trap, the first step is to choose a suitable<br />
interm ediate pressure which in this case could be 190 psi abs.<br />
The following design data are now known: pv = 230 psi abs; pf =<br />
190 psi abs; p2 = 126 psi abs.; and w = 13.6 lb per sec.<br />
The drop in pressure through the trap from 236 to 190 psi abs<br />
causes part of the saturated w ater to flash into steam so th at a<br />
mixture of 13.3 lb of w ater and 0.3 lb of steam or 0.0225 lb of<br />
steam per lb of w ater enters the orifice. Curves B in Fig. 14,<br />
which were obtained by cross-plotting and extrapolating the data<br />
from Fig. 9, show that, for an initial pressure of 190 psi abs and a<br />
back pressure of 126 psi abs, an orifice will pass 2200 lb of water<br />
per sec per sq ft plus 0.0225 lb of steam per lb of water.<br />
w<br />
or — = 2200 lb per sec per sq ft; w = 13.3 lb per sec
BEN JA M IN , M ILLER—T H E FLOW OF SATURATED W A TER TH ROUGH T H R O T T L IN G O R IFIC ES 427<br />
D iscussion<br />
F. O. E l l e n w o o d . ® This paper is of intense interest to the<br />
writer and probably to all engineers who are at all concerned with<br />
the flow of fluids through orifices. The experimental data presented<br />
are valuable to those desiring to use orifices for draining<br />
feedwater heaters and also to those who are primarily concerned<br />
with the flow phenomena involved.<br />
Even a hasty glance at Fig. 2 of the paper will show that the<br />
measured flow of saturated water through a sharp-edged orifice<br />
is several times the amount indicated by the so-called “theoretical<br />
curve” which is presumably Bottomley’s theory. Unfortunately,<br />
this theory is not given in the paper, and the reference is<br />
not readily available.<br />
It seems to the writer that many engineering papers are somewhat<br />
open to criticism when they simply refer to the so-called<br />
“theoretical values” without further explanation. In this particular<br />
case, the measured rates of flow are undoubtedly correct to<br />
a reasonable degree of accuracy, while the Bottomley theory,<br />
whatever it may be, is certainly far from complete.<br />
Any theory concerning the flow of a fluid through an orifice,<br />
when that fluid is a saturated liquid at entrance, may be made<br />
simple or complicated, depending upon how complete it is. If<br />
the velocity and density at the orifice could be calculated, it<br />
would be a simple matter to determine the rate of flow for any<br />
known orifice area. As a matter of fact, however, the velocity<br />
and density at the orifice are not simply and accurately calculated.<br />
In all cases, the pressure in the orifice will be appreciably<br />
greater than that measured at a point considerably beyond the<br />
orifice. Just what portion of this total drop in pressure actually<br />
occurs in passing through a thin-plate orifice is hard to determine,<br />
but it is probably of the order of 25 or 30 per cent. If<br />
there is any transformation of liquid into vapor before passing<br />
entirely through the orifice, the complete theory then becomes<br />
further complicated due to the difficulties of calculating the<br />
change in density, the effect of the two-phase velocities, and the<br />
energy available to produce velocity in the orifice.<br />
A. E. K i t t r e d g e .7 In commenting on this excellent paper,<br />
the writer feels that additional emphasis be placed on the fact<br />
that the results refer to and are limited to a thin-plate orifice.<br />
The difference observed between the results of this paper and<br />
those of Kittredge and Daugherty8 are attributable to the difference<br />
between streamline flow and turbulent flow, respectively,<br />
as applied to this particular problem. We tested a nozzle subject<br />
to turbulent flow. The authors tested a thin-plate orifice<br />
subject to streamline flow. Complete turbulent flow represents<br />
one limit of the characteristic of the flow of saturated water and<br />
complete streamline flow represents the other limit of the characteristic<br />
of the flow of saturated water.<br />
As stated, the difference between the results previously obtained<br />
and those now observed is a difference resulting from the<br />
characteristics of turbulent flow as opposed to the characteristics<br />
of streamline flow. In a broad sense the writer believes this to<br />
be true but there are other elements, namely, time, mass, energy,<br />
and heat-transfer rate which very likely influence the existence<br />
or nonexistence of a critical pressure in the flow of saturated<br />
water. In contrast to the flow of an almost perfectly elastic gas<br />
or vapor, allowance must be made for the fact that saturated<br />
water is initially a much denser fluid; that the ratio of the specific<br />
volume at critical pressure to the initial specific volume is much<br />
• Professor of Heat-Power Engineering, Cornell University, Ithaca,<br />
N. Y. Mem. A.S.M.E.<br />
7 Chief Engineer, Cochrane Corporation, Philadelphia, Pa.<br />
* “Discharge Capacity of Traps,” by A. E. Kittredge and E. F.<br />
Daugherty, Combustion, vol. 6, September, 1934, pp. 14-19.<br />
greater for saturated water than for any ordinary gas or vapor;<br />
that the flashing of water involves a complete change of state,<br />
not just a readjustment of the pressure-volume relation; that<br />
the change in state involves heat transfer from the mass surrounding<br />
a bubble to the bubble formed; and that more time<br />
and more energy per unit volume of fluid are required to redistribute<br />
the mass of saturated water from its initial volume to its<br />
greatly enlarged mixed volume after flashing, as compared to the<br />
time and energy required per unit volume to redistribute the<br />
mass of a relatively light and nearly perfectly elastic gas or vapor<br />
from its initial volume to its moderately increased volume at its<br />
critical pressure.<br />
Turbulence and time contribute to all of these factors involved<br />
in the change of state between the initial pressure and the critical<br />
pressure. It is quite possible that, in the case of a thin-plate<br />
orifice, the completion of the change in state requires more time<br />
than elapses from the point of initial acceleration to the vena<br />
contracta of the orifice. In the authors’ experiment, orifice<br />
sizes, ranging from 1/l in. diam to 7/s in. diam were used. Liquid<br />
velocities involved were of the order of 100 fps. If, in the case<br />
of a V^in-diam orifice, the acceleration of the liquid occurred in<br />
a distance of 1/i in. the time available for changing state during<br />
the period of acceleration and pressure reduction was approximately<br />
0.0002 sec.<br />
In February, 1934, in addition to the ‘/Vin-diam nozzle just<br />
described, we tested the application of our theory to a Vs-in-diam<br />
standard iron pipe about 10 ft long. The existence of critical<br />
pressure was determined by locating a pressure gage on the pipe<br />
at the discharge end. The results verified logical theory. This<br />
particular test setup certainly provided turbulent flow. The<br />
writer would suggest that a worth-while research would be to<br />
establish the relation between hydraulic diameter and length of<br />
pipe line or nozzle required to develop full turbulence and full<br />
flashing in accordance with thermodynamic theory.<br />
The specific purpose of the present paper has been to determine<br />
flow rate through thin-plate orifices, but the inspiration<br />
for the investigation and the broad purpose of the paper is to determine<br />
the possibility of using orifices for the drainage of stage<br />
heaters. In this regard, it is felt that the authors have missed a<br />
remarkable opportunity by failing to investigate the characteristics<br />
of turbulent flow. For the particular purpose of draining<br />
stage heaters, a turbulent nozzle, having a capacity with saturated<br />
water substantially directly proportional to the absolute<br />
pressure, is much preferable to a thin-plate orifice, having a capacity<br />
varying as the square root of the absolute pressure. At<br />
the same time, the turbulent nozzle would have much lower capacity<br />
under saturated water and much wider range of control<br />
due to static head on the inlet side. If operating engineers are<br />
determined to eliminate interstage traps, they should attack the<br />
proposition on the basis of a turbulent nozzle located a considerable<br />
distance below the heater to be drained so that it may be<br />
subject to appreciable submergence on the inlet side. Submergence<br />
on the outlet side does not matter since flashing of the liquid<br />
will so reduce the density on the outlet side that, with reasonable<br />
pipe sizes, the pressure on the discharge side of the turbulent<br />
nozzle will never be higher than the critical pressure. Apparently<br />
then, the ideal automatic drainage arrangement for stage heaters<br />
would consist of a U-seal arrangement with the two legs of about<br />
the same diameter and the crossover connection between the<br />
two legs consisting of a small-diameter tube developing turbulent<br />
flow. The crossover tube between the two legs of the U-tube<br />
connection might be not less than one half the diameter of the<br />
respective leg.<br />
The concluding paragraphs of the paper under discussion are<br />
rather vague regarding the applicability of the thin-plate orifice<br />
to the service of interstage draining of surface heaters but sug
428 TRANSACTIONS OF T H E A.S.M.E. JULY, 1941<br />
gests the possible use of a trap followed by an orifice. The<br />
writer would raise the question: If a trap is necessary why use<br />
the orifice? The trap in a full-open position is an orifice. This<br />
question is asked w ith particular reference to new installations<br />
and doe3 not contemplate the possible expediency of assisting a<br />
defective trap.<br />
S . P. S o l in g .9 The authors have shown that, in the case of<br />
water, the actual flow of saturated liquid through orifices is<br />
greater than would be expected from theoretical considerations.<br />
Their graphical treatm ent clearly indicates how this occurs.<br />
The same behavior has been noted for the refrigerants dichlorodifluoromethane<br />
(Freon-12) and ammonia. Orifices sized on<br />
the basis of equilibrium conditions in the orifice proved several<br />
times too large. Q uantitative results are not available for comparison,<br />
as various amounts of vapors were passed w ith the liquid<br />
for different runs, the orifice readings being incidental to a test.<br />
No attem pt was made to obtain data as comprehensive as those<br />
of the authors’ who are to be congratulated on their clarification<br />
of a puzzling problem.<br />
D. R. Y a r n a l l . 10 In connection w ith this paper, it might<br />
be interesting to compare the conclusions w ith the trend of data<br />
obtained in the study of the flow of saturated and subcooled<br />
water through a rounded entrance orifice. This work was undertaken<br />
in the fall and winter of 1938-1939 by the research departm<br />
ent of the w riter’s company and utilized a setup somewhat<br />
similar to th a t of the authors’. This orifice was connected to<br />
the mud-drum blowoff of a small high-pressure test boiler, using<br />
distilled feedwater.<br />
The orifice used was 0.130 in. diam with a rounded approach of<br />
Vs in. radius, followed by a tubular section l/s in. long. A small<br />
pressure tap was drilled radially into the throat of the orifice to<br />
9 R esearch E ngineer, Y ork Ice M achinery C orporation, Y ork, P a.<br />
Ju n . A .S .M .E .<br />
10 R esearch D ep artm en t, Y arnall-W aring C om pany, Philadelphia,<br />
P a. Fellow A .S.M .E .<br />
F i g . 15 F l o w C u r v e s f o r S a t u r a t e d a n d S u b c o o l e d W a t e r ,<br />
B a s e d o n A c t u a l F l o w T h r o u g h a R o u n d e d O r i f i c e<br />
(O rifice, 0.130 in. d iam , ro u n d ed to Vs in. rad iu s, a n d w ith th r o a t, x/% in.<br />
long.)<br />
obtain some measurement of pressure conditions existing in the<br />
throat.<br />
The results obtained were in general consistent with the trend<br />
of flow values disclosed in the paper, being greatly in excess of<br />
flow calculations based on thermodynamic equilibrium. From<br />
practical equality with cold-water flow at low heads, the ratio of<br />
the flow of saturated-w ater to cold-water flow reduced to approxim<br />
ately 0.6 at 50 psi abs; and further to approximately 0.5 at<br />
100 psi abs, where the ratio to cold-water flow remained essentially<br />
constant up to 300 psi abs, the highest pressure reached.<br />
The actual numerical flow values obtained for saturated-water<br />
flow through the rounded orifice (in lb per sec per sq ft of orifice<br />
area), check within close limits of those given in the paper.<br />
However, when adjustm ent is made for differing coefficients, the<br />
flow through the rounded orifice will be considerably less in<br />
comparison.<br />
On subcooled water, isothermal-flow curves, Fig. 15 of this<br />
discussion, showed a tendency to parallel the cold-water-capacity<br />
curve at pressures up to 200 psi abs. At higher pressures<br />
(between 200 and 300 psi abs) inconsistent results were obtained,<br />
the m ajority of observations indicating a marked drop in the<br />
rate of increase in flow w ith increased pressure. Due to capacity<br />
limitations of the apparatus and interruption of the investigation,<br />
this trend has not been conclusively substantiated to date.<br />
It would be interesting to know whether there was any indication<br />
pointing toward reduced capacity on subcooled water flowing<br />
through a sharp-edged orifice at pressures above 200 psi abs?<br />
It is gratifying to note the growing consistency of accumulating<br />
data on the flow of saturated w ater and it is particularly helpful<br />
from the practical standpoint to find a simplified approach to a<br />
phase of the subject such as the authors of this paper have so<br />
clearly outlined. It is expected th a t work on the flow through<br />
rounded entrance orifices will be resumed, concluded, and the results<br />
subm itted for publication shortly, in order th at these findings<br />
may also contribute to the general subject matter.<br />
A u t h o r s’ C l o s u r e<br />
The authors are extremely grateful for the interest shown by<br />
those who prepared discussions of their paper and feel th at each<br />
discusser has added to the value of the paper by presenting his<br />
comments. The authors had hoped, however, th a t more interest<br />
would be shown in the possible application of these data in the<br />
design of orifices for specific uses, such as th at of draining extraction<br />
feedwater heaters as described in the paper. The authors<br />
would like to emphasize again the importance of th at part of<br />
their paper on the assumption th a t this point may have been<br />
missed by m any who are interested in design work involving the<br />
flow of saturated liquids.<br />
Regarding Professor Ellenwood’s criticism of the paper because<br />
the theoretical treatm ent was omitted, it should be remembered<br />
th at the authors were required to m eet certain space limitations.<br />
The theory given in Bottomley’s paper,3 which was referred to<br />
by the authors, merely assumes thermodynamic equilibrium in<br />
the orifice. We realize, and regret, th at Bottomley’s paper is not<br />
widely distributed, but it is available in the Engineering Societies’<br />
Library, New York, N . Y. As usual, Professor Ellenwood’s comments<br />
are welcome, and it is hoped he will be encouraged to continue<br />
the theoretical study of the phenomena of the flow of a saturated<br />
liquid through orifices and ultim ately report his conclusions.<br />
I t is not clear to the authors w hat Mr. K ittredge means by<br />
“streamline” and “turbulent” flow in reference to this paper.<br />
Based on the usual Reynolds’ number criterion, the flows reported<br />
are definitely in the turbulent region. If Mr. K ittredge’s use of<br />
the term “turbulent” refers to a condition of flashing such as<br />
might occur in the downstream portion of a nozzle, or in the tail<br />
pipe immediately following an orifice, then the authors agree th at
BEN JA M IN , M ILLER—T H E FLOW OF SATURATED W A TER THRO UGH T H R O T T L IN G O R IFIC ES 429<br />
the results of the orifice tests would not apply. The paper specifically<br />
states that the orifice results do not apply to nozzles or<br />
short tubes. In view of their test results, however, the authors<br />
are at a loss to know how a flashing mixture of steam and water<br />
is to be obtained in a sharp-edged thin-plate orifice supplied only<br />
with saturated water. As shown by the results in the paper, if<br />
steam is passed through the orifice with the water, the capacity<br />
of the orifice is considerably less than if water alone is passed,<br />
however, this mixture is not the result of flashing in the orifice.<br />
Mr. Kittredge’s comments on several of the differences between<br />
saturated water and an elastic gas are pertinent to a theoretical<br />
analysis of the problem and add considerably to the background<br />
of the discussions. In addition to these theoretical factors, it<br />
probably is true that surface tension also plays an important part<br />
in retarding the flashing of a saturated liquid. This factor was<br />
pointed out by Prof. M. C. Stuart and others in oral discussion.<br />
The authors are grateful to Mr. Kittredge for emphasizing the<br />
underlying purpose of the investigation. We feel that the practical<br />
applications of thin-plate orifices deserve serious consideration<br />
by designing and operating engineers. However, regarding<br />
the charge that “a remarkable opportunity had been missed by<br />
failing to investigate the characteristics of turbulent flow,” the<br />
authors would like to say that an investigation of the flow of a<br />
flashing mixture of water and steam through pipes has been made<br />
and the results will be offered for publication later. These results<br />
were not included in the present paper because of lack of space and<br />
because the authors felt that each phase of this subject deserved<br />
the emphasis derived from a separate report.<br />
Mr. Kittredge’s suggestion of using a U-leg arrangement for<br />
draining feedwater heaters is basically sound, but the authors<br />
point out that one of the primary reasons for using orifices for<br />
draining heaters is that it is possible to install an orifice at the<br />
end of the cascade drain line and thus prevent erosion of elbows<br />
resulting from high velocities. This was mentioned in the<br />
“Introduction” of the paper as one of the important advantages<br />
of orifices over traps, and it is also one of the main advantages of<br />
the former over Mr. Kittredge’s U-leg arrangement.<br />
In answer to Mr. Kittredge’s question: “If a trap is necessary<br />
why use the orifice?” it is obvious from his own qualifying statement<br />
following his question that he already knows the answer.<br />
As is well known to plant operators and trap manufacturers alike,<br />
there is nothing uncommon about the failure of a supposedly nondefective<br />
trap to function properly under some operating conditions<br />
even though it was “designed for the job.” Where a trap<br />
needs assistance because the float is too small to overcome the<br />
unbalance in the trap valve, the use of an orifice in series is a<br />
simple, inexpensive expedient.<br />
Mr. Soling’s comments are most welcome in that they point<br />
out that saturated liquids other than water behave in the same<br />
general way as water when flowing through an orifice or valve into<br />
a region in which the pressure is lower than the saturation pressure.<br />
Mr. Yamall is to be commended for publishing some of his<br />
test data. These data supply some of the information on the<br />
characteristics of flow of saturated water through a nozzle or<br />
short tube which were lacking in the authors results and, in this<br />
respect, his discussion is a distinct contribution. The authors do<br />
not understand why the bellmouth tube should have a relatively<br />
smaller capacity than a sharp-edged orifice, after correcting for<br />
differences in the cold-water-discharge coefficients. It may be<br />
that the relatively small size of tube used in Mr. Yamall’s tests is<br />
responsible for the difference, either because of undisclosed factors<br />
associated with the small physical size or because of difficulties<br />
involved in making the laboratory determinations. The<br />
latter possibility is indicated by the inconsistent results at high<br />
pressure differences. The marked drop in rate of increase of flow<br />
with increased pressure differential may indicate a critical pressure<br />
condition in the tube. This may be what Mr. Kittredge refers<br />
to as a turbulent condition. It would seem to the authors,<br />
however, that this drop in the rate of increase of flow would have<br />
been more pronounced with saturated water than with subcooled<br />
water, which is contrary to the indications of Fig. 15 of Mr.<br />
Yamall’s discussion. In the authors’ tests the reduction in discharge<br />
coefficient for increasing pressure differentials with subcooled<br />
water was essentially the same as shown in Fig. 13 for<br />
saturated water.<br />
A recent communication from Prof. J. I. Yellott makes an interesting<br />
analogy between the so-called supersaturation in a rapidly<br />
expanding steam jet and the failure to flash in the saturated water<br />
jet. He says, “In a very rapid expansion, a substance in the liquid<br />
or vapor phase is apparently unable to change its phase rapidly<br />
enough to alter the flow characteristics of nozzles or orifices.”
T rain A cceleration W ith Steam Locom otives<br />
By L. B. JO NES,1 ALTOONA, PA.<br />
This paper presents a stu dy o f th e relation betw een the<br />
cylinder tractive force o f high-speed steam locom otives and<br />
th e energy required to accelerate trains o f differing w eights<br />
at various rates. M athem atical form ulas for com p u tin g<br />
tim e and distance required for acceleration are presented<br />
in an Appendix. C onsideration is given to som e o f th e<br />
more im portant factors w hich lim it cylinder tractive<br />
power.<br />
T<br />
H E m athematics of acceleration of railway vehicles has<br />
been fully discussed in various textbooks and also in previous<br />
papers presented before the Society; but for convenience<br />
of ready reference the fundamental concepts are herein reviewed.<br />
Weights of locomotive and train are expressed in tons;<br />
and acceleration is expressed in terms of miles per hour per m inute<br />
or per mile, to conform w ith the customary statistics of train<br />
schedules; in distinction to the common formulas of physics and<br />
mechanics expressed in terms of pounds, feet, and seconds. By<br />
this means, it is hoped to record data which will be helpful to<br />
operating officers as well as to designing engineers. Because the<br />
energy of acceleration varies with the square of the velocity, but<br />
only directly with the weight of the train, simple arithm etical proportion<br />
is deficient when comparing different locomotives or<br />
different weights of trains a t the higher speeds, and a graphic<br />
analysis is most useful to show w hat actually takes place.<br />
The force available for acceleration in the cylinders of the<br />
ordinary two-cylinder steam locomotive is expressed by the wellknown<br />
formula<br />
as shown in Fig. 1, the cylinder horsepower is m aintained almost<br />
constant from 60 to 100 mph. While it is sufficiently in advance<br />
of current steam-locomotive practice to be called a “maximum”<br />
locomotive, it is by no means an “ultim ate” locomotive because,<br />
if the mean effective pressure could be still better m aintained as<br />
the speed increases, the horsepower would actually increase with<br />
the speed above 60 mph, as it now does below th a t speed.<br />
If yet greater power m ust be obtained, a glance a t the formula<br />
previously given will show th a t the only recourse is redesign, or<br />
increase of one or more of the dimensional values. The advantages<br />
of improving the present locomotive, as compared with design<br />
changes, involving increased weight and capital investm ent,<br />
are illustrated by the curves in Figs. 4 to 8, inclusive, which have<br />
been developed on the assumption th a t improved locomotive E<br />
has been produced from present locomotive A w ithout any increase<br />
in weight.<br />
For this study, three trains weighing respectively 800,1000, and<br />
1200 tons behind the tender have been assumed, and their gross<br />
resistances, based on the D avis formulas, are shown in Fig. 3.<br />
For simplicity, all calculations have been based on straight level<br />
track; the effect of grades, plus or minus, m ay be added or subtracted,<br />
and a similar correction m ay be made for curves. For<br />
purposes of comparing two or more locomotives, the assumption<br />
where T = cylinder tractive effort, lb<br />
C = mean diameter of the cylinders, in.<br />
P = mean effective pressure, psi<br />
432 TRANSACTIONS OF T H E A.S.M.E. JULY, 1941<br />
of level track will answer as well as any other condition which<br />
might be selected.<br />
The curves involving sp.eed, time, and distance were calculated<br />
from the tractive-force and resistance curves point by point and<br />
then verified by the m athem atical formulas presented in the<br />
Appendix. In each case, the two methods checked very closely;<br />
and it is evident th at acceleration curves can be constructed by<br />
the formulas which will reflect the effect of changes in the tractive-power<br />
curve on the performance of the locomotive. Since<br />
the curves are plotted for the minimum and maximum locomotives<br />
only, it is also evident th a t the performance of the intermediate<br />
locomotives, B, C, and D, can be studied from the curves<br />
by interpolation. I t will be noted th at the m athematical studies<br />
in the Appendix follow closely the methods of Professor Barrow<br />
U ).’<br />
Fig. 4 compares present locomotive A with maximum locomo-<br />
2 N um bers in parentheses refer to th e B ibliography a t the end of<br />
th e paper.<br />
F ig . 3<br />
S p e e d a n d T r a i n - R e s i s t a n c e C u r v e s ; L e v e l T r a c k<br />
F i g . 6<br />
S p e e d a n d A c c e l e r a t i n g - F o r c e C u r v e s<br />
F i g . 4<br />
T im e a n d S p e e d C u r v e s<br />
F i g . 7<br />
T im e a n d D is t a n c e C u r v e s<br />
DI3TANCI I I MILX3 TO ATTAIN SPEED<br />
TUOC IB MINUTES TO ATTAIN SPEED<br />
F i g . 5 D is t a n c e a n d S p e e d C u r v e s F i g . 8 L i g h t C a r s V e r s u s H e a v y C a r s
JONES—TRA IN ACCELERATION W IT H STEAM LOCOMOTIVES 433<br />
tive E, hauling three different trains, and Fig. 5 illustrates the<br />
same comparison based on distance. I t will be noted th at the<br />
higher sustained horsepower of the improved locomotive results<br />
in a reduction of both time and distance required to attain a given<br />
speed.<br />
These curves also serve to emphasize a point which m ust be<br />
borne in mind by operating officers, and th a t is the serious handicap<br />
of enforced slowdowns. Locomotive A with an 800-ton train<br />
requires approximately 2l/i min or IV 2 miles to attain 50 mph,<br />
and 6V2 additional min or 7[/a miles to attain 80 mph; so th at, if<br />
the train is slowed from 80 to 50 mph, 6V2 min or 7V2 miles are<br />
required to resume the original speed. This should not be confused<br />
with elapsed time, which would include also time lost in<br />
slowing down and running at reduced speed, items not covered<br />
by this investigation.<br />
Fig. 6 shows the force available for acceleration compared with<br />
speed. The locomotive has reached its maximum speed when the<br />
accelerating force becomes zero. To determine the maximum<br />
speed of the locomotives on a grade, it is only necessary to determine<br />
the grade resistance of the locomotive and train and draw a<br />
horizontal line a t the corresponding value. The intersection of<br />
the curves with the line so drawn will show the maximum speed<br />
on the grade selected.<br />
Fig. 7 shows a m athematical “race” between locomotives A and<br />
E. Starting from the same point, with trains of identical weigtit,<br />
it will be seen that, at the end of 12 min, locomotive E is 2 miles<br />
ahead of locomotive A ; and the gap widens rapidly due to the<br />
more rapid acceleration of the improved locomotive.<br />
Fig. 8 shows the effect of lightweight cars on the rate of acceleration.<br />
The weights of the two trains, w ith a given locomotive,<br />
are proportional to the time required to attain the same<br />
speed, and to the squares of the speeds attained in a given time.<br />
Therefore, it follows that, for a given maximum speed, the saving<br />
in schedule time by the lightweight train is confined to acceleration,<br />
and if there are no stops or speed reductions, the heavy<br />
train will require only a little more time to cover a given distance<br />
than the lightweight train. On the other hand, if there are<br />
numerous stops and slowdowns, the advantage of the lightweight<br />
train is multiplied.<br />
Fig. 9 shows tractive-force curves for steam, electric, and<br />
Diesel locomotives of equivalent-nominal-horsepower rating.<br />
Steam locomotive E from previous studies is compared with assumed<br />
electric and Diesel locomotives, the continuous motor<br />
rating and the Diesel-engine rating being used for the electric<br />
and Diesel locomotives, respectively. It is recognized to be<br />
common practice to take advantage of the overload capacity of<br />
electric motors while accelerating, which is a distinct advantage<br />
for an electric locomotive drawing its power from a trolley; but<br />
the Diesel is limited by the capacity of its engine, and the overload<br />
possibilities of the steam locomotive are circumscribed by considerations<br />
of economy and good practice, a t least in the preparation<br />
of train schedules. A direct comparison of locomotives<br />
having such different characteristics is impossible, but the curves<br />
serve to illustrate the relative capacities for accelerating trains.<br />
They also demonstrate th a t the steam locomotive, w ith moderate<br />
improvement, is capable of taking rank with the best motivepower<br />
units.<br />
Fig. 10 illustrates an advantage of the improved locomotive<br />
with respect to the power output required for acceleration to a<br />
given speed. The kinetic energy of two trains of the same weight<br />
is the same for any speed; but the improved locomotive requires<br />
less time and distance to attain speed and, therefore, the energy<br />
required to overcome friction is less. Inasmuch as each locomotive<br />
would have to cover the same distance in actual operation,<br />
this saving during acceleration is theoretical rather than real.<br />
Perhaps the greatest handicap of the steam locomotive is the<br />
F i g . 9<br />
T r a c t iv e F o b c e o f V a r i o u s L o c o m o t iv e s<br />
F i g . 10<br />
S p e e d a n d H o r s e p o w e r H o u r s<br />
deep-rooted conservatism of American locomotive designers<br />
which has sentenced it to be a machine of two cylinders controlled<br />
by one valve apiece. The destructive dynamic forces which<br />
diverge from the line of power transmission, and the ineffective<br />
steam distribution have, it seems, become necessary evils, to be<br />
tolerated rather than faced. The author believes th a t these<br />
handicaps can be overcome, while still retaining for the steam<br />
locomotive the simplicity and flexibility which are its greatest<br />
assets. The maximum locomotive E has been assumed as a twocylinder<br />
locomotive, conventional in all respects but valve action;<br />
and it seems probable th a t no satisfactory arrangem ent of cylinders<br />
to eliminate counterbalances and dynamic augments can be<br />
developed until a satisfactory valve action has been perfected.<br />
B ut regardless of the number and arrangement of the cylinders,<br />
the mean effective pressure will continue to govern the output;<br />
and the following additional assumptions have been made:<br />
(а) Minimum pressure drop from boiler to steam chest. The<br />
superheater and pipes should afford free passage to the steam, for<br />
while steam which expands w ithout doing work is raised in temperature,<br />
it is pressure which does the work in the cylinders.<br />
(б) Adequate steam-chest volume. The opening of the admission<br />
valve results in equalization of pressures in the steam<br />
chest and cylinder; and at high speeds the surge of steam pressure<br />
from the pipes and header does not reach the steam chest until<br />
the valve has closed. The result is a maximum indicator-card<br />
pressure far below boiler pressure, and an average admission pressure<br />
yet lower. M eantime, the steam entering the chest a t high
434 TRANSACTIONS OF T H E A.S.M.E. JULY, 1941<br />
velocity builds up a surge pressure which may go 50 lb above<br />
boiler pressure a t its peak, but drops to normal before the next<br />
valve opening. An adequate steam-chest volume is, therefore,<br />
essential to hold up the admission line on the indicator card; and<br />
also to insure a uniform velocity of steam through the superheater<br />
and pipes.<br />
(c) Well-designed exhaust passages. The ideal passage would<br />
pass the steam to the nozzle a t maximum velocity and minimum<br />
back pressure; but since both are impossible of attainm ent in the<br />
same passage, a uniform cross section of smooth proportions is<br />
desirable. Too large an exhaust passage operates as an expansion<br />
chamber which has to be choked a t the nozzle to produce draft,<br />
with resulting high back pressure against the piston in the center<br />
of its stroke, where it is most damaging to the mean effective<br />
pressure.<br />
(d) Large exhaust nozzle, which is only possible with an efficient<br />
front end.<br />
(e) Proper steam distribution. This specification eliminates<br />
the one-piece reciprocating valve, and requires separate admission<br />
and exhaust valves so arranged th a t cutoff m ay be shortened<br />
without advancing the other valve events. Various valve arrangements<br />
which m eet this requirement more or less perfectly<br />
are extensively used in Europe and we would do well to profit by<br />
their experience. Experiments now under way in this country<br />
may lead to successful results.<br />
Appendix<br />
E q u a t io n s f o r A c c e l e r a t in g F o r c e<br />
When the tractive-force-speed curve of a locomotive is known,<br />
the curve for train resistance of any given train can be subtracted<br />
and the result is the accelerating-force-speed curve for the combined<br />
locomotive and train.<br />
Let F = accelerating force for entire train, lb<br />
a = acceleration, mphps = 1.467 fpsps<br />
W = weight of train, including additional percentage to<br />
provide for energy of rotation, tons<br />
V — speed, mph<br />
L = distance traveled to reach any speed, miles<br />
K iV dt where K u is the constant required to make the relation<br />
true.<br />
The constant of integration required to make the equation true<br />
for a known condition will be called D.<br />
Knowing the relations shown by Equations [1] and [2], it only<br />
remains to write the equation for speed F and tractive force F for<br />
the train, from which equations showing the time and distance to<br />
reach any speed can be derived.<br />
The force of acceleration is maximum a t starting. As long as<br />
the engine can be run in full gear, the accelerating force falls off<br />
from its original value by an am ount which is proportional to the<br />
square of the speed. The general equation for this relationship is<br />
where F0 equals starting tractive force and K 2 = constant required<br />
for any particular curve. This condition holds for a passenger<br />
train until a speed of about 30 mph is reached, following<br />
which, changed cutoff and other conditions give quite a different<br />
curve. The curve changes from convex to concave in the 30-<br />
mph speed range (sometimes referred to as the critical range).<br />
Therefore, two equations are required for every speed-accelerating-force<br />
curve.<br />
To simplify the actual calculations, Equation [3] was not used<br />
for the accelerating-force-speed curves but the equation was<br />
changed to<br />
I t is obvious th at the substitution of the value of F in Equations<br />
[1] and [2], as given by Equation [4], is much more easily<br />
handled than the substitution which liquation [3] gives. The<br />
substitution of Equation [4] in Equation fl] gives<br />
which can be very quickly solved.<br />
The substitution of Equation [3] in Equation [1] gives<br />
which is much less convenient.<br />
When constants K i and K i are chosen so th at Equations [3]<br />
and [4] m atch a t 0 and 30 mph, the intermediate points are close<br />
enough to give the correct time and distance for all speeds.<br />
As an example, the following table shows how Equations [3]<br />
and [4] compare, for a case where the accelerating force equals<br />
44,000 lb a t starting and 36,000 lb at 30 mph. For Equation [3]<br />
the equation is<br />
The distance L traveled in miles to reach any speed is dL =
JONES—TRA IN A CCELERATIO N W ITH STEAM LOCOM OTIVES 435<br />
-A ccelerating force, lb -<br />
Speed E q u atio n [1] E q u atio n [2]<br />
0 44000 44000<br />
10 43120 43000<br />
20 40480 40050<br />
30 36000 36000<br />
35 33100 33550<br />
It is apparent th at for all practical purposes the two equations<br />
are equivalent, so the one most readily usable should be chosen.<br />
The curve for the higher speeds, which is the more im portant,<br />
is found by two steps. The first step is to note th at if a tangent<br />
TTi to the tractive-force-speed curve SSi is drawn, the difference<br />
in ordinates of the tangent and the curve, when plotted on rectangular<br />
coordinates, forms a very good parabola, Fig. 11. The<br />
next step is to write the equation of this parabola. When the equations<br />
of the tangent and parabola are added, the result is the<br />
equation of the tractive-force curve. This curve always has<br />
the form<br />
A V 2 + BV + C = F. • [5]<br />
In most cases, where a well-chosen point of tangency is used,<br />
the curve of Equation [5] fits the actual curve very closely. Almost<br />
any point of tangency gives good results.<br />
where D makes L correct for 35 mph, according to Equation [8].<br />
Equations [7] and [9] would not be applicable if the quantity<br />
B 2 did not exceed 4AC, but B2 m ust always exceed 4/1C, otherwise<br />
no speed could be reached where there would not be some<br />
accelerating force. The maximum speed is found when<br />
then<br />
Substituting the values of F in Equations [4] and [5] in Equations<br />
[1] and [2] gives<br />
which holds good above 30 mph, and allows a short overlap with<br />
the curve of Equation [6] in the critical range.<br />
The time t is calculated by Equation [6] for the lower speeds;<br />
then D is calculated to make the time t correct a t 35 mph in<br />
Equation [7],<br />
Inspection of Equation [10] shows th a t if 4AC were greater<br />
than B 2, the maximum speed would have no limit.<br />
The application of Equations [7] and [9] is quite simple because<br />
the quantity \ / B 2 — 4/1C which is easily computed repeats itself<br />
so frequently. The quantity (AV2 + B V + C) is really Fv at<br />
any speed, and the quantities B =t y / B 2 — 4AC for a large group<br />
of curves can be conveniently arranged in a table. Then to<br />
obtain Equations [7] and [9], it is simply a m atter of substituting,<br />
and calculating the particular constants of integration, which give<br />
the correct time and distance at 35 mph, as obtained from the<br />
more elementary Equations [6] and [8].<br />
Ten cases were solved along the foregoing lines. They were<br />
for trains hauled by the present passenger locomotive A and the<br />
improved passenger locomotive E, using 800-, 1000- and 1200-ton<br />
trains, a loaded 10-car passenger train made up of heavyweight<br />
cars, and a loaded 10-car passenger train made up of lightweight<br />
cars.<br />
The following table shows the make-up of the train s:<br />
Condition<br />
No. of<br />
cars<br />
W eight of<br />
cars, tons<br />
Gross weight<br />
of train, tons<br />
( W) weight, allowing for kinetic<br />
energy of wheels and axles, tons<br />
1 12 800 1065 1098<br />
2 15 1000 1265 1303<br />
3 18 1200 1465 1507<br />
4 10 592 858 891<br />
5 10 780 1045 1077
436 TRANSACTIONS OF T H E A.S.M.E. JULY, 1941<br />
The equations for the various curves may be listed as follows:<br />
Case 1, condition No. 1; present locomotive A :
JO NES—TRA IN ACCELERATIO N W IT H STEAM LOCOMOTIVES 437<br />
B IB L IO G R A P H Y<br />
1 “ Problem s in L ocom otive A cceleration,” b y A. C. Barrow ,<br />
Civil Engineering, vol. 4, 1934, pp. 202-204.<br />
2 "S team Locom otive D esign,” b y E . A. Phillipson, Locom otive<br />
Publishing C om pany, L ondon, E ngland, 1936.<br />
3 “ Principles of L ocom otive O peration and T rain C o n tro l,” by<br />
A. J . W ood, M cG raw -H ill B ook C om pany, Inc., N ew Y ork, N . Y .,<br />
1915.<br />
4 “A ir R esistance of H igh-Speed T ra in s,” by O. G . T ietjen s and<br />
K . C. R ipley, T ran s. A .S .M .E ., vol. 54, 1932, pap er A PM -54-23, pp.<br />
235-246; also R ailw ay M echanical Engineer, vol. 106, 1932, pp. 18-22<br />
and 61-63.<br />
5 “ T he R esistance of E xpress T rain s,” b y C. F . D . M arshall,<br />
published by The R ailw ay Engineer, L ondon, E ngland, 1925.<br />
6 “ A erodynam ics of th e R ailw ay T ra in ,” by A lexander K lem in,<br />
R ailw ay Mechanical Engineer, vol. 108, 1934, pp. 282-286, 312-316<br />
and 357-360.<br />
7 “ A ir R esistance of R ailroad E q u ip m en t," by A. I. L ipetz,<br />
T rans. A .S .M .E ., vol. 59, 1937, p p . 617-640.<br />
8 “ A .A .R . P assenger L ocom otive T ests,” Office M echanical<br />
Engineer, A ssociation of A m erican R ailroads, Chicago, 111., F eb ru ary ,<br />
1939.<br />
9 “ R esistance of L ightw eight Passenger T rain s,” b y A. I. T o t<br />
ten, Railw ay A ge, vol. 103, 1937, p p . 75-80.<br />
10 “ A tm ospheric R esistance an d I ts R elations to th e Speed of<br />
R ailw ay T ra in s,” b y F . U . A dam s, R and M cN ally & C om pany,<br />
Chicago, 111., 1892.<br />
11 “ T ra in R esistan ce an d Pow er of Locom otives— D a ta and<br />
T ables,” A m erican L ocom otive C om pany, N ew Y ork, N . Y ., 1906.<br />
12 “ T ra c tiv e P ow er and H auling C ap acity of Steam Locom o<br />
tiv es,” by Jo h n E . M uhlfeld, Boell and Freem an, N ew Y ork, N . Y .,<br />
1924.<br />
13 "L ocom otive T ra c tiv e E ffo rt in R elation to Speed and Steam<br />
S u p p ly ,” by E . G . Y oung an d C. P . Pei, T ran s. A .S .M .E ., vol. 57,<br />
1935, pp. 335-341.<br />
14 “ T ra in A cceleration an d B rakin g ,” by R . C. Jones, T rans.<br />
A .S .M .E ., vol. 63, 1941, pp. 147-155.<br />
15 “ M ain-L ine O il-Electric L ocom otive for R o u m an ia,” B ulletin,<br />
In te rn a tio n a l R ailw ay Congress A ssociation, vol. 20, D ecem ber, 1938,<br />
pp. 1230-1244.<br />
D iscussion<br />
H. B. O a t l e y . 3 This paper presents, in easily understandable<br />
form, some of the essentials in the consideration of increased<br />
steam-locomotive power at the higher speeds which are today<br />
necessary. The thesis set forth is one in which the writer can<br />
heartily concur. There is only one point to which he would<br />
like to direct attention. I t is the stress laid upon enlarged steam<br />
areas throughout the path of the steam from the dome to the exhaust-nozzle<br />
tip.<br />
Chapelon, in his comprehensive analysis4 of the steam locomotive,<br />
the essential part of which has been so ably presented<br />
in English by Lawford H. F ry ,5 has indicated the increased<br />
capacity resulting from careful attention to the question of more<br />
ample steam path. In the path of the steam as here considered,<br />
the fact m ust be kept in mind th a t all of the passages, w ith the<br />
exception of the superheater units, are of m etal having a lower<br />
tem perature than th a t of the steam carried. The superheater<br />
units, however, in p art surrounded by gases at tem peratures of<br />
upward of 1500 F, m ust be recognized as severely stressed parts.<br />
The steam velocity through these units is an im portant factor in<br />
preventing rapidly destructive conditions and it is essential th at<br />
adequate steam velocity m ust be provided.<br />
In the early days of the superheater, when materials less heatresistant<br />
were available, steam velocities with the single-loop<br />
superheater were many times noticeably low; and the rapid deterioration<br />
of superheater units soon led to modified designs<br />
which provided higher steam velocities and better protection to<br />
the m etal of the units. Today, w ith improved alloy steels, it is<br />
the practice to design for lower steam velocities than would<br />
otherwise be permissible, but it m ust be recognized that, even<br />
with these improved m aterials, too low steam velocities will result<br />
in unduly short life of this portion of the steam path. Like<br />
most im portant features in an engineering structure, there must<br />
be a compromise and all factors m ust be fairly evaluated. On<br />
one hand there is the desirability of the maximum output; on the<br />
other hand, the initial cost and maintenance, as well as the losses<br />
which m ay be incurred in repairs, m ust be considered.<br />
L. K. S i l l c o x .6 The author has presented, in intelligent<br />
and consecutive form, an example of the problem th a t is recurrent<br />
in both operating and mechanical departm ents of railways,<br />
i.e., the estim ation of locomotive performance in terms<br />
of cars, tonnage, and speed. I t is understood th at the locomotives<br />
compared, designated A and E, are identical in principal dimensions<br />
and th at the cylinder-horsepower performance of locomotive<br />
E has been achieved by securing a higher mean effective<br />
pressure in the cylinders by reducing pressure drop between<br />
superheater header and the cylinders, and by so modifying the<br />
valve events th a t an increase in negative work is not a function<br />
of short cutoffs at high speed.<br />
The writer would expect th a t locomotive E indicates some<br />
hypothetical performance which locomotive A can never be re-<br />
3 V ice-President, T he S uperheater C om pany, N ew Y ork, N. Y.<br />
M em . A .S.M .E .<br />
4 “L a Locom otive a V apeur,” by A ndre C hapelon, published by<br />
J. B. B ailliere e t F ils, P aris, 1938.<br />
s “ T h e E volution of th e L ocom otive in F rance,” by L aw ford H.<br />
F ry , R ailw ay M echanical E ngineer, vol. 112, 1938, pp. 473-475; vol.<br />
113, 1939, pp. 1-5.<br />
6 F irst V ice-President, T h e N ew Y ork Air B rake C om pany, W atertow<br />
n, N . Y. M em . A .S.M .E .
438 TRANSACTIONS OF T H E A.S.M.E. JULY, 1941<br />
F i g . 12<br />
C o m p o s it e I n d ic a t o r C a r d f o r B o t h S i d e s o f L o c o m o t iv e<br />
constructed to produce economically. For instance, if the<br />
boiler will supply steam to deliver 4500 cylinder horsepower at<br />
100 mph with a high degree of efficiency, its very size m ust be a<br />
burden to locomotive A which can do no better than a little more<br />
than 3400 hp a t 60 mph. If maximum tractive effort is the<br />
same in either case, the same weight on drivers would serve<br />
either locomotive. The large boiler of locomotive E would demand<br />
more weight on idle axles.<br />
Tractive effort expressed as<br />
represents in simple form the average torque of a two-cylinder<br />
steam locomotive. D educt total train resistance and it is a<br />
measure of accelerating capacity but is not an accurate and precise<br />
expression, because an equivalent mean effective pressure<br />
cannot be utilized to utm ost advantage, bearing in mind the<br />
variation in instantaneous values of cylinder pressure during admission<br />
and expansion of steam, the effective lever arm of the<br />
couple which turns the main driving wheel on th at side, and the<br />
manner in which the forces developed by two engines, operating<br />
90 deg out of phase, combine. Increased mean effective pressure,<br />
however it m ay be obtained w ithout proportionate increase in<br />
steam consumption or wider variation in extreme pressures, is<br />
desirable. The actual shape of the composite indicator card for<br />
both sides of the locomotive as it affects uniformity of torque<br />
also is im portant as disclosed by Fig. 12 of this discussion.<br />
Since driving-wheel torque m ust be variable, there is a question<br />
as to the possible use which m ay be made of the peaks in accelerating<br />
force. At low speeds, surges are felt and at each surge<br />
some energy is wasted through movement of friction-draft-gear<br />
elements. This dissipation determines the number of cars<br />
through which the surge is discernible. If only the spring elements<br />
of the draft gears are affected a substantial part of the<br />
stored energy may be recovered. Maximum and minimum<br />
tractive efforts, developed from indicator cards, have been measured<br />
a t 125 per cent and 76 per cent of the average values derived<br />
from the combined efforts of both engines at starting in<br />
full gear and at 30 mph, 73 per cent cut off. Obviously, no increase<br />
in mean effective pressure, secured by increasing instantaneous<br />
high pressures at crank positions which now are associated<br />
with the highest maximum torques, would be effective.<br />
At the same time, minimum torque occurs when the crankpins<br />
are a t or near the center and quarter positions. At these points,<br />
any reduction in negative work, represented by compression and<br />
preadmission, is highly beneficial in the direction of useful and<br />
uniform tractive effort. Thus, a valve gear, which will provide<br />
independent timing of separate events, will be of considerable<br />
value in smoothing out the torque curve, quite independently of<br />
its effect upon mean effective pressure.<br />
A u t h o r ’s C l o s u r e<br />
Mr. Oatley has rightly called attention to the necessity for<br />
proper balance in all things, particularly in the steam locomotive.<br />
It is fully recognized th at freer steam and gas passages should not<br />
be realized at the expense of either superheat or tube maintenance.<br />
It is rather the author’s contention th at our enthusiasm for<br />
evaporative surface and superheat has combined with increasing<br />
demands on the capacity of the locomotive as a whole in such<br />
a way as to swing the balance away from adequate areas. Steam<br />
and gas passages which were sufficient tw enty or thirty years ago<br />
are too restrictive today, and our conceptions of proper balance<br />
must therefore subm it to some overhauling.<br />
Mr. Sillcox has pertinently pointed out th at increased mean<br />
effective pressure w ithout increase in boiler pressure can be<br />
brought about by eliminating negative work. Bearing in mind<br />
th at the greatest improvement is realizable at the higher speeds,<br />
a large increase also comes from improved admission-valve action<br />
and later exhaust opening, which combine to increase the positive<br />
work available from the same am ount of steam.<br />
When this improvement in the cylinder cycle is supplemented<br />
by a higher average steam-chest pressure and a lower average<br />
exhaust back pressure brought about by refinements in other details<br />
of the machine, locomotive E is no longer a hypothetical<br />
case but becomes an attainable reality. The same boiler will<br />
serve because the steam delivered to the cylinders is the same in<br />
both cases.
D ischarge Coefficients of Long-R adius<br />
Flow Nozzles W lien Used W^ith<br />
P ipe-W all P ressure T aps<br />
B y H. S. BEA N ,1 S. R. B E IT L E R ,2 a n d R. E. SPR E N K L E 3<br />
For th e la st six y ears, th e S p ecia l R esearch C o m m itte e<br />
on F lu id M eters h a s b een c o n d u c tin g a resea rch o n flow<br />
n o zzles. In p reviou s papers r ela tin g to th e p rogram , th e<br />
C o m m ittee ’s p la n s for carryin g o u t th e resea rch w ere<br />
o u tlin e d ( l ) ,4 a n d so m e o f th e r e su lts o b ta in e d have b een<br />
p resen ted (2, 3, 4). In th e p resen t pap er, th e r e s u lts o f<br />
d e te rm in a tio n s o f co efficie n ts o f lo n g -r a d iu s n o z z le s w h en<br />
u sed w ith p ip e-w a ll ta p s5 are given , a s b ased o n a c o m b in a <br />
tio n o f sep a rate a n a ly se s by th e th r e e a u th o rs. L ater<br />
papers w ill exten d th e r e su lts to o th er c o n d itio n s th a n<br />
th o se consid ered in t h is paper.<br />
Di = inside diam eter of approach section of pipe, in.<br />
Z>2 = diam eter of nozzle throat, in.<br />
pi = absolute static pressure on inlet side of nozzle,<br />
psi<br />
p-> = absolute static pressure on outlet side of nozzle,<br />
psi<br />
pi = density of fluid based on inlet pressure and<br />
tem perature, lb per cu ft<br />
The Reynolds number R d, applying to the nozzle throat diameter,<br />
is given by<br />
I n t r o d u c t io n<br />
A S WAS pointed out in one of the earlier papers (1), there<br />
A A is no one laboratory w ith facilities for making the required<br />
tests on flow nozzles over the entire range of conditions<br />
which it was desired to cover. Furthermore, by distributing<br />
the tests among several laboratories, more or less overlapping<br />
would occur, which would tend to furnish information on the<br />
agreement between the results of tests by the different laboratories<br />
on the same nozzle; in some cases using the same sections<br />
of piping. In addition, such data would provide a basis for<br />
estimating the tolerance to be assigned to the coefficient values<br />
for use in commercial metering of fluids. Since it is impossible<br />
to determine, from the smoothed results as here given, the portions<br />
contributed by the different laboratories, it is appropriate<br />
to list them and to indicate the range of conditions covered by<br />
their tests, so th at due recognition m ay be given to their several<br />
contributions. This is done in Table 1.<br />
M e t h o d o p A n a l y s i s<br />
For the purpose of the present paper, the essential result from<br />
each test is the relation between the discharge coefficient and the<br />
Reynolds number. The discharge coefficient is defined (5) by<br />
in which w = actual rate of flow, lb per sec<br />
C = coefficient of discharge<br />
0 = diameter ratio, D2/ A<br />
1 Chief of G as M easuring In stru m e n t Section, N ational B ureau<br />
of Standards, W ashington, D . C. M em , A .S.M .E.<br />
2 Associate Professor of M echanical Engineering, T he Ohio S tate<br />
U niversity, Colum bus, Ohio. M em . A .S.M .E.<br />
3 H ydraulic E ngineer, Bailey M eter C om pany, Cleveland, Ohio.<br />
4 N um bers in parentheses refer to th e B ibliography a t th e end of<br />
the paper.<br />
6 As here used, th e term “ pipe-w all tap s” applies to pressure tap s<br />
connected to th e pipe wall w ith th e inlet-pressure ta p located 1 pipe<br />
diam ahead of th e nozzle-inlet face, and the o u tlet pressure ta p ab o u t<br />
'/2 pipe diam following th e nozzle-inlet face, b u t in no case beyond<br />
the outlet end of th e nozzle.<br />
C ontributed by th e Special R esearch C om m ittee on F luid M eters<br />
and presented a t th e A nnual M eeting, N ew Y ork, N . Y ., D ecem ber<br />
2-6, 1940, of T h e A m e r ic a n S o c ie t y o f M e c h a n ic a l E n g i n e e r s .<br />
N o t e : S tatem en ts and opinions advanced in papers are to be<br />
understood as individual expressions of th eir authors, and n o t those F i g . 1<br />
of the Society.<br />
439<br />
S c h e m a t ic I l l u s t r a t i o n o f G r a p h i c a l M e t h o d U s e d in<br />
A n a l y z in g F l o w - N o z z l e T e s t D a t a
440 TRANSACTIONS OF T H E A.S.M.E. JULY, 1941<br />
Vi = average fluid velocity in nozzle throat, fps<br />
m = absolute viscosity of fluid a t inlet pressure and<br />
tem perature, lb per ft per sec<br />
a relation which will be referred to again.<br />
The first step in the analysis of the results was to plot all the<br />
values of C determined for any one nozzle, against the corresponding<br />
values of the Reynolds number. A smooth curve was<br />
then drawn to represent the locus of the test points as closely<br />
as possible, as illustrated in A, Fig. 1. W hen more than one<br />
laboratory calibrated a given nozzle, the results from each laboratory<br />
were plotted separately, or with distinguishing marks.<br />
Smooth curves were then drawn to represent the results from<br />
each laboratory. Finally, a single curve was drawn to represent<br />
what the analyst believed to be the most probable average of all<br />
the data taken on th a t one nozzle. The result of this step was<br />
th at an average curve was obtained for each nozzle tested.<br />
Next, from the average curves for all nozzles tested in any<br />
one size of pipe, values of C were read off corresponding to some<br />
even value of the Reynolds num ber and these were plotted against<br />
the diam eter ratio. Smooth curves were then drawn to connect<br />
the points for like values of the Reynolds num ber as in B, Fig. 1.<br />
This process was repeated for each different size of pipe in which<br />
nozzles were tested. As a m atter of detail, it m ay be mentioned<br />
th at it was usually necessary to cross-plotback and forth several<br />
times before sufficiently smooth curves were obtained in both the<br />
A and B plots.<br />
For an even value of the diameter ratio, values of C at a given<br />
Reynolds, number were read from each group of B curves and<br />
plotted against pipe diam eter (or the reciprocal of the pipe<br />
diameter). In this manner groups of curves were obtained for<br />
each selected value of the diameter ratio, as shown in C, Fig. 1.<br />
These curves show the change in the coefficient due to pipe size.<br />
While this effect was small and rather irregular, it was deemed<br />
desirable to give it some consideration in this analysis.<br />
From these sets of curves, giving the effects of pipe size, values<br />
of the discharge coefficient were read for a single pipe size and<br />
plotted against Reynolds’ number. Smooth curves were readily<br />
drawn through the points for the same diameter ratio, and thus<br />
for each pipe size was formed a family of curves giving coefficient<br />
against Reynolds’ number for even diameter ratios, as illustrated<br />
in D, Fig. 1. Each of these families of curves was extrapolated<br />
to a Reynolds number Rd of 5,000,000, in order to meet the conditions<br />
in m any present-day plants, particularly power plants where<br />
very high steam tem peratures and velocities are used.<br />
I t will be noted th at the curves in group D are similar to those<br />
of group A, but are much smoother and more evenly spaced. The<br />
analysis could have been ended here, and this set of D curves<br />
used to present the final results. However, it was the authors’<br />
belief th a t most users of flow nozzles would find it more convenient<br />
to have available curves in which the coefficient is plotted<br />
against diam eter ratio. Accordingly, the final step was to make<br />
cross-plots from the D curves, thus giving curves of C for constant<br />
Reynolds’ numbers against diam eter ratio, as shown in<br />
E, Fig. 1, a separate set of curves being made for each pipe size.<br />
As already mentioned, each of the authors made independent<br />
analyses of the data, following the general procedure outlined.<br />
Laboratory<br />
Size of<br />
Pipe<br />
inches<br />
oborator<br />
Mumber<br />
Nozzles<br />
Tested<br />
es in<br />
Range<br />
eter<br />
Which Flow<br />
of Diam-<br />
Ratios<br />
Nozzl<br />
Fluid<br />
TABLE 1<br />
Tests Were Made an d Ranne of Condition Covered<br />
Range of Reyn olds Numbers Reference Measurement<br />
by<br />
Ro<br />
Rd<br />
min max min max<br />
Tests Made or<br />
Supervised by<br />
Bailey Meter Co 3 13 .16 to .80 water 6 600 870 000 22 000 1090 000 volumetric tank R. E.Sprenkle<br />
Cornell University, Hyd- 8 1 .46 water 18 00 0 294 000 39 700 633 000 volumetric tank Prof. E.W. Schoder,<br />
draulic Laboratory 24 3 .24 .56 " 23 600 1012 000 97 600 2 357 000<br />
ii ii A. N. Vanderlip<br />
Cornell University, Sibley 3 4 .25 .60 water 3 000 40 0 000 12 700 670 000 weigh tank Prof.s F. G.Switzer<br />
School of M.E. 4 8 :35 .85 " 9 000 596 000 25 4 0 0 781 000<br />
■i H<br />
8i W. C. Andrae<br />
General Electric Co. Tur- 2 8 .50 .84 steam 117 400 1377 000 243 000 1690 000 weighed condensate 3.0.Buckland,<br />
bine Research Dept.<br />
C.J. Walker<br />
Ingersoli-Rand Co. Test- 4 2 .25 .50 air 6 000 59 500 24 000 119 000 impact tube W. Johnson,<br />
ing Dept. 16 9 .24 .36 " 51 000 386 00 0 200 000 1700 000 traverse R. E. Hunn<br />
Massachusetts Institute of 2 5 .125 .50 steam 4 4 0 0 128 60 0 34 900 257 200 weighed condensate Prot. J.H. Keenan,<br />
Technology, Dept, of ME<br />
W. J.Lindsey<br />
National Bureau of 2 2 0 .125 .84 water 155 620 000 1 290 768 000 weigh tank H. S.Bean, F. C. Morey,<br />
Standards 3 17 .16 .86 i* 426 628 000 2 900 734 000<br />
I!<br />
H. G; Wagner, H. P. Bean<br />
4 16 .15 .85 ■i 500 403 000 3 260 480 600<br />
,, B. O'Connor<br />
8 10 .37 .86 " 10 700 783 000 28 400 986 000 volumetric tank<br />
Ohio State University, 3 13 .16 .86 water 1 300 755 000 4 200 1068 000 weigh tank Prof. S. R. Beitter<br />
Dept, of M.E. 3XH 6 .16 .86 steam 43 000 969 000 160 000 1500000 weighed condensate<br />
6 XH 5 .54 .79 water 45 300 1367 000 84 000 1737 000 weigh tank<br />
8 XH 6 .69 .82<br />
it 57 700 1952 000 82 000 2672 000 volumetric tank<br />
8- 10 .37 .86 » 38 00 0 1 756 000 102 000 2 064 000<br />
i 0 XH 3 .82 226 000 1626 000 277 000 2 110 000<br />
12 1 .64 1 112 000 1418 000 175 000 2 205 000<br />
■I H<br />
University of California 3 3 .4 .8 water 26 000 692 000 65 000 865 000 volumetric tank Prof. s M. P. O'Brien<br />
Dept, of M. E. 4 8 .35 .85 ■i 78 700 754 000 127 000 868 000<br />
n n 8i R.G. Folsom<br />
8 9 .37 .56 " 62 000 549 000 160 000 984 700<br />
ii<br />
University of Oklahoma, 2 22 .125 .84 oil 60 60 100 493 61 200 weigh tank Dean W. H, Carson,<br />
School of M. E. 3 19 .16 .86 .> 48 49 500 290 69 700 .. Prof. E.E.Ambrosius<br />
4 14 .15 .85 ■ 6 37 800 40 50 700 ■i H<br />
University of Pennsylvania, 4 5 .37 .85 water 4 000 852 OOC 10 800 990000 weigh tank Prof. W. S. Pordoe<br />
Dept, of C. E. 6 5 .25 .58 . 4 000 590 000 12 000 1020 000<br />
8 2 .46 .83 1 7 600 1650 000 15 000 2 0 0 0000<br />
ii n
BEAN, B EITL E R , SPR EN K LE—D ISCHARG E C O E FFIC IE N TS OF LONG-RADIUS FLOW NOZZLES 441<br />
F ia . 2 D i s c h a r g e C o e f f i c i e n t s o f L o n g - R a d i u s N o z z l e s i n<br />
2 -In . P ip e<br />
(W hen in let-p re ssu re connectio n is 1 p ip e d ia m p recedin g a n d o u tle t-p re ssu re<br />
co n n ectio n is l/i p ip e d ia m follow ing p la n e of nozzle in let.)<br />
F i g . 5<br />
D is c h a r g e C o e f f i c i e n t s o f L o n g - R a d iu s N o z z l e s in<br />
6 - I n . P i p e<br />
(R efer to n o te Fig. 2.)<br />
F i g . 3<br />
D is c h a r g e C o e f f i c i e n t s o f L o n g - R a d io s N o z z l e s i n<br />
3 - I n . P i p e<br />
(R efer to n o te F ig. 2.)<br />
F i g . 6<br />
D is c h a r g e C o e f f i c i e n t s o f L o n g - R a d iu s N o z z l e s i n<br />
8 - I n . P i p e<br />
(R efer to n o te F ig . 2.)<br />
Diameter<br />
Ratio,<br />
F i g , 4<br />
D is c h a r g e C o e f f i c i e n t s o f L o n g - R a d iu s N o z z l e s i n<br />
4 -I n . P i p e<br />
(R efer to n o te F ig. 2.)<br />
F i g . 7<br />
D i s c h a r g e C o e f f i c i e n t s o f L o n g - R a d id s N o z z l e s i n<br />
1 0 -In . P i p e<br />
(R efer to n o te F ig. 2.)<br />
There was, however, more or less variation in the details of performing<br />
the several steps. For example, in plotting the original<br />
test data in the first step, either R D or R d m ay be used as the abscissa<br />
coordinate. Also, it was sometimes more convenient to<br />
use the logarithm of the Reynolds number, or to plot on semilogarithmic<br />
coordinate paper. Whichever Reynolds’ number<br />
was used in the first step was used ordinarily throughout the<br />
succeeding steps. However, for the final comparison, only one<br />
was used, in this case R d. This means that, when R D was used<br />
in the first four steps, it was necessary to apply Equation [4] to<br />
the curves in D, Fig. 1, before cross-plotting to obtain the final<br />
set of E curves. This shifted each curve in D to the right, but<br />
by different amounts, the lower the diameter ratio the greater<br />
the am ount of shift. I t is evident th at this alters the shape<br />
of the curves which are obtained in the final step by cross-plotting<br />
the D group of curves.<br />
Furtherm ore, each author used his own estimation of the weight<br />
to be placed on the results from the different laboratories, particularly<br />
when two or more laboratories calibrated the same<br />
nozzle. These three individual sets of curves were then compared,<br />
line by line and the arithm etical mean taken as the basis<br />
for the curves herein presented.
442 TRANSACTIONS OF T H E A.S.M.E. JULY, 1941<br />
C o e f f i c i e n t s f o b L o n g - R a d i u s F l o w N o z z l e s , T o l e r a n c e s ,<br />
a n d R a n g e o f A p p l i c a t i o n<br />
The average curves obtained from the three analyses are shown<br />
in Figs. 2, 3, 4, 5, 6, and 7, applying to flow nozzles in 2-, 3-,<br />
4-, 6-, 8-, and 10-in. pipes, respectively. These curves constitute<br />
the Committee’s recommendation on the values of discharge<br />
coefficients for the long-radius or elliptical type of flow<br />
nozzle when the inlet-pressure connection is located 1 pipe diam<br />
preceding the inlet face of the nozzle, and the outlet-pressure<br />
connection is 1/ 2 pipe diam following the inlet face of the nozzle.<br />
The average difference between the results reported here and<br />
any one of the three individual analyses is about =*=0.2 per cent,<br />
while the maximum difference is about 0.5 per cent. However,<br />
between the results reported by different laboratories on tests of<br />
the same nozzle, the differences were as much as 1 per cent to 1.5<br />
per cent, even when the same sections of pipe had been used. As<br />
a rule, the differences were larger at the low Reynolds numbers<br />
than at the high. Therefore, the authors suggest that, in the<br />
use of these nozzle coefficients, a tolerance (i.e., the probable range<br />
uncertainty) of =*=0.75 per cent be allowed at Reynolds’ numbers<br />
Rd of 500,000 and over, with 3-in. pipe and larger. At lower<br />
values of Rd and with 2-in. pipe, the tolerance should be * 1<br />
per cent.<br />
While the coefficient curves for all six pipe sizes have been<br />
extended up to a diameter ratio of 0.85, it is recommended that<br />
the use of diameter ratios in excess of 0.8 should be avoided<br />
wherever possible. The reasons for this recommendation are<br />
(a) the test data for diameter ratios over 0.8 were less extensive<br />
and more irregular than for the lower values of the ratio; (b)<br />
the slope of the curves is increasing rapidly in the 0.8 to 0.85<br />
region, and the errors due to any uncertainty in the calculation<br />
of the diameter ratio or to reading the coefficient value from the<br />
curves will be greater than at the lower values of 0.<br />
A careful comparison of the curves for use with the different<br />
pipe sizes will show there is very little change in the value of the<br />
coefficient with pipe size, particularly with the larger pipes.<br />
Any further change in coefficient values with pipe size above a<br />
10-in. pipe will probably be very slight. Therefore, it is sug-<br />
T A B L E 2<br />
C O N T R IB U T O R S TO T H E FLO W -NOZZLE<br />
R E S E A R C H PR O G R A M<br />
Am erican Gas and E lectric Com pany<br />
Anaconda Copper M ining Com pany<br />
Bailey M eter Com pany<br />
Bethlehem Steel Com pany<br />
B urlington Lines<br />
C entral Illinois Light Com pany<br />
C entral R ailroad of New Jersey<br />
Chicago, M ilwaukee, St. Paul and Pacific R ailroad Com pany<br />
C onnecticut Light and Power Com pany<br />
Consolidated Edison Com pany of New Y ork, Inc.<br />
D e Laval Steam T urbine Com pany<br />
D etroit Edison Com pany<br />
D uquesne Light Com pany<br />
Ebasco Services, Incorporated<br />
Econom y Pum ping M achinery Com pany<br />
T he Engineering Foundation<br />
Foxboro Com pany<br />
Gulf Oil C orporation of Pennsylvania<br />
Gulf R esearcn and D evelopm ent C orporation<br />
H um ble Oil and Refining Com pany<br />
M. W . Kellogg Com pany<br />
New England Power Association<br />
New E ngland Power Service C om pany<br />
Norfolk and W estern Railw ay Com pany<br />
Pacific P um p W orks<br />
Philadelphia Electrio Com pany<br />
Potom ac Edison Com pany<br />
Public Service Electric and G as Com pany<br />
Socony-Vacuum Oil Com pany<br />
S tandard B rands, Incorporated<br />
S tandard D evelopm ent, Incorporated<br />
Sun Oil Com pany<br />
U nited S tates Steel C orporation<br />
U nited S tates W orks Progress A dm inistration<br />
W ashington G as L ight Com pany<br />
W est Penn Pow er Com pany<br />
Union Electric L ight an d Power Com pany<br />
Utilities C oordinated Research, Incorporated<br />
W estinghouse Electric and M anufacturing C om pany<br />
W orthington P um p and M achinery Corporation<br />
Youngstow n Sheet and T ube Com pany<br />
gested that for nozzles in pipes larger than 10 in. the coefficient<br />
curves for 10-in. pipe may be used without introducing any appreciable<br />
error.<br />
A c k n o w l e d g m e n t s<br />
The conduct of any research project, and particularly so extensive<br />
a program as this has been, requires ample financial<br />
support. Too often the efforts to provide this support pass<br />
unnoticed, and that such may not occur in this case, we are<br />
pleased to record here that the carrying on of this program was<br />
made possible by the efforts of E. C. M. Stahl as chairman of<br />
the fund-raising subcommittee. Assisting him on this subcommittee<br />
were R. K. Blanchard, W. A. Carter, Paul Diserens,<br />
and L. K. Spink. For their repeated and generous response to<br />
the requests from this subcommittee particular acknowledgment<br />
is due The Engineering Foundation and the former Utilities<br />
Coordinated Research, Inc. The names of all the contributors<br />
of both funds and materials (other than laboratory testing facilities)<br />
are given in Table 2.<br />
BIBLIOGRAPHY<br />
1 “Research on Flow Nozzles,” by H. S. Bean, Mechanical Engineering,<br />
vol. 59, 1937, pp. 500-502.<br />
2 “Determining Flow Nozzle Contours,” by F. C. Morey, Instruments,<br />
vol. 10, 1937, pp. 157-160.<br />
3 “Some Results From Research on Flow Nozzles,” by H. S.<br />
Bean and S. R. Beitler, Trans. A.S.M.E., vol. 60, 1938, pp. 235-244.<br />
4 “Nozzle Coefficients for Free and Submerged Discharge,” by<br />
R. G. Folsom, Trans. A.S.M.E., vol. 61, 1939, pp. 233-238.<br />
5 “Fluid Meters, Their Theory and Application,” Fourth edition,<br />
T h e A m e r ic a n S o c i e t y o f M e c h a n i c a l E n g i n e e r s , 1937, Research<br />
Report, par. 156.<br />
D iscussion<br />
W. A. C a r t e r .6 In connection with the graph showing the<br />
large spread of discharge coefficient of a certain flow-nozzle installation<br />
plotted against the Reynolds number, which appears in<br />
the authors’ closure to this paper, it is noted that the installation<br />
involved corner taps.<br />
The writer believes the authors will agree that such installations<br />
are much more susceptible to erratic performance than are<br />
those having the pressure taps located 1 pipe diam upstream and<br />
Vs pipe diam downstream from the nozzle inlet, which latter is a<br />
type of installation with which the paper is concerned.<br />
Corner taps are known to be dependent upon the width o f the<br />
pressure-slot opening if the I.S.A. nozzle design is employed. A<br />
small variation in the thickness of the gaskets may seriously<br />
affect the nozzle coefficient.<br />
W. W. J o h n s o n . 7 Inasmuch as the data given in this paper<br />
supply authoritative values of nozzle-discharge coefficients over a<br />
wide region, where heretofore only meager information has been<br />
published, the paper will be greatly appreciated by engineers<br />
having flow problems to handle.<br />
In order to clarify certain questions which have arisen will the<br />
authors supply answers to the following:<br />
Are the coefficients given in the paper for low-ratio or highratio<br />
nozzles, as defined in “Instruments and Apparatus,” part 5,<br />
chapter 4,8 or both?<br />
What rules were followed in regard to wall thickness of the test<br />
6 Technical Engineer, Power Plants, The Detroit Edison Company,<br />
Detroit, Mich. Mem. A.S.M.E.<br />
7 Research Engineer, Turbine Engineering Department, General<br />
Electric Company River Works, Lynn, Mass. Mem. A.S.M.E.<br />
8 Information on Instruments and Apparatus, Part 5, Chapter 4, on<br />
Flow Measurment by Means of Standardized Nozzles and Orifice<br />
Plates, published by The American Society of Mechanical Engineers,<br />
29 W. 39th St., New York, N. Y.
BEAN, B EITLER, S P R E N K L E —D ISCHARG E C O E FFIC IE N TS OF LONG-RADIUS FLOW NOZZLES 443<br />
nozzles, and what would be the effect on the coefficients if relatively<br />
heavy walled nozzles were used?<br />
Why have the coefficients not been given for throat Reynolds’<br />
numbers less than 50,000 and what, in general, was the result of<br />
the tests at the lower range of Reynolds’ number?<br />
W. V. K i n g .9 T w o high-ratio flow nozzles for unit No. 7 at<br />
Waterside Station No. 2 of the Consolidated Edison Company<br />
have been calibrated a t Ohio State University by S. R. Beitler.<br />
The results of these calibration tests present an interesting discussion<br />
to this paper because they tend to substantiate the opinion<br />
of the authors th at it is difficult to predict the coefficient of<br />
flow nozzles with diam eter ratios above 0.8 to any reasonable<br />
degree of accuracy.<br />
Both of these nozzles were designed for 700,000 lb steam flow<br />
per hr at 1300 psi pressure and 925 F tem perature. To limit the<br />
differential head to 212 in. of water at rated steam flow, it was<br />
necessary to use flow nozzles with a diameter ratio of 0.8366.<br />
The Reynolds number on these nozzles, corresponding to rated<br />
9 A ss is ta n t E n g in eer, C o n so lid ate d E d iso n C o m p a n y , In c ., N ew<br />
Y o rk , N . Y . M em . A .S .M .E .<br />
steam flow, is 10,000,000, equivalent to nearly 3 times the maximum<br />
Reynolds number obtained on test with water. Therefore<br />
it was necessary to extrapolate the calibration tests by a method<br />
which appears to give the most accurate determ ination of coefficient<br />
a t design conditions. This basis of extrapolation is the<br />
relation th a t the logarithm of the actual w ater flow plotted<br />
against the logarithm of differential head is a straight line. The<br />
method of extrapolation is explained as follows:<br />
1 All test points were corrected to a constant tem perature;<br />
the differential head by a factor equivalent to the ratio of water<br />
densities, and the actual w ater flow by a factor equivalent to the<br />
square root of the water-density ratio. To minimize the magnitude<br />
of these corrections, the variation of w ater tem peratures<br />
during test was confined to 5 deg for nozzle No. 59535 and to 3<br />
deg for nozzle No. 59534.<br />
2 The equation of a straight line expressing the relation between<br />
the logarithms of actual flow and differential head is log<br />
Q = A + B log h, where A is the intercept and B is the slope of<br />
th at line. The equation of the best line through the test points<br />
can be calculated most accurately by the method of least squares,<br />
applying the relations<br />
SCALE FOR NOZZLE NO.59534 0.01 0.02 0.03 0.05 0.1 0.2 0.3 0.5 0.7 1.0 2 3 4 5 6 8 10 20 30 40 50 70 100<br />
DIFFERENTIAL HEAD, FEET OF WATER<br />
F i g . 8<br />
L o g a r it h m ic R e l a t io n B e t w e e n D i f f e r e n t i a l H e a d a n d A c t u a l W a t e r F l o w
444 TRANSACTIONS OF T H E A.S.M.E. JULY, 1941<br />
2 B log h + NA = 2 log Q<br />
2 A log h + 2 £ (log h)2 = 2 log Q log h<br />
where N is the number of test points.<br />
3 Since the coefficient of discharge is equivalent to the actual<br />
water flow divided by the theoretical flow (Q = KVh), it is a<br />
simple mathem atical procedure to determine the logarithm of the<br />
coefficient in terms of the logarithms of differential head, actual<br />
water flow, and Reynolds’ num ber which are all straight lines.<br />
The final calibration curves on these two nozzles are presented,<br />
first, to indicate the apparent accuracy of extrapolation and then<br />
to show the difference in discharge coefficient between two nozzles<br />
with the same diam eter ratio of 0.8366.<br />
The coefficient curves for nozzle No. 59535 installed in a bored<br />
tube do not vary from any test point by more than 0.1 per cent<br />
and the curve is the best average of the test points. U nfortunately,<br />
the coefficient curves for nozzle No. 59534, installed in an<br />
unbored tube, pass through four test points, fall under two<br />
test points by approximately 0.15 per cent, and lie above one test<br />
point by approximately 0.35 per cent. W ith the exception of<br />
one test point, the calibration-test accuracy falls within 0.15 per<br />
cent of the faired curves.<br />
A comparison of these coefficient curves indicates th a t nozzle<br />
No. 59534 has a coefficient approximately 2 per cent greater than<br />
nozzle No. 59535, and also th at the coefficient for nozzle No. 59534<br />
is relatively flat compared to the coefficient for nozzle No. 59535.<br />
Experience with high-ratio flow nozzles has prom pted the<br />
following comments on paper:<br />
1 The plotting of a smooth curve, representing the locus of<br />
test points, by an arithm etical average m ay be sufficiently accurate<br />
when the spread of points from the faired curve is not excessive<br />
and when the test covers the entire range of Reynolds’<br />
numbers. W henever an extensive extrapolation is required, it is<br />
preferable to use the method of least squares in averaging the test<br />
points.<br />
2 The straight-line relation between logarithms of flow and<br />
head discloses th at a plot of the logarithm of coefficient against<br />
logarithms of differential head, actual w ater flow, and Reynolds’<br />
number also have a straight-line relation. Therefore, any direct<br />
plot of coefficient against Reynolds’ number might introduce inaccuracy,<br />
provided the coefficient curve has a steep slope and test<br />
points cover a great range of Reynolds’ number.<br />
The authors are to be commended on presenting these extensive<br />
test data on flow nozzles in such a concise manner. Due to the<br />
tremendous am ount of work necessary in preparing this paper,<br />
the methods used by the authors in extrapolating and averaging<br />
coefficient curves appear to be the most suitable that could be<br />
applied under the circumstances. This discussion has been presented<br />
to introduce additional data on the higher-diameter-ratio<br />
nozzles and to show w hat appears to be a more desirable method<br />
of extrapolating test data on coefficient of discharge to procure<br />
the greatest accuracy possible.<br />
W. S. P a r d o e .10 F r o m a n in s p e c tio n o f t h e g r a p h g iv in g th e<br />
c o e ffic ie n t c u rv e s o f h ig h - r a tio flow n o z z le s , w ith p ip e ta p s , w h ic h<br />
a p p e a r s in t h e c lo s u re t o t h is p a p e r , i t is s u g g e s te d t h a t th e<br />
a u th o r s m ig h t d o w e ll t o c o n s id e r th e u se o f t h r o a t ta p s fo r h ig h -<br />
r a tio n o z z les.<br />
Fig. 11 of this discussion shows the test of an 11.064 X<br />
9.346-in. flow nozzle with throat taps. The coefficient curve is<br />
quite normal and is flat from Reynolds’ number 200,000 up.<br />
A u t h o r s ’ C l o s u r e<br />
M r. C arter refers to Fig. 12 of this closure which shows the results<br />
of tests on large-diameter-ratio nozzles when corner taps<br />
were used. The purpose of this illustration is to emphasize the<br />
difficulty of correlating the results when there is so much scatter-<br />
F i g . 12 R e s u l t s o f T e s t s W i t h C o r n e r T a p s o n T h r e e N o z<br />
z l e s o f N e a r l y t h e S a m e T h r o a t D i a m e t e r<br />
F i g . 13<br />
P b o p o b t i o n s o f L o n g R a d iu s F l o w N o z z l e s A d o p t e d<br />
b y t h e S u b c o m m it t e e o n F l o w - N o z z l e R e s e a r c h f o b<br />
U s e i n I t s R e s e a b c h P r o g r a m<br />
(T h e use of a pip e-w all ta p in s te a d of a n o zz le-th ro a t ta p in th e low /S<br />
series is o ptional.)<br />
F io . 11 T e s t of 11.064 X 9.346-In. T G N ozzle<br />
{Simplex Valve & Meter Company, Philadelphia, Pa.)<br />
ing. I t is for the reason th a t there is more scattering with corner<br />
taps, as mentioned by Mr. Carter, th a t this particular plot is re-<br />
10 Professor of H ydraulic Engineering, U niversity of Pennsylvania,<br />
Tow ne Scientific School, Philadelphia, Pa.
BEAN, B EITLER , SPR EN K LE—D ISCHARG E C O E FFIC IE N TS OF LONG-RADIUS FLOW NOZZLES 445<br />
produced. It may be added th at the location of the pressure<br />
taps, as between comer taps and pipe-wall taps, is more importan<br />
t than the nozzle-entrance forms, as represented by I.S.A.<br />
and long radius.<br />
In reply to Dr. Johnson’s questions, as shown by the curves<br />
in Figs. 2 to 7, inclusive, of the paper, the coefficients given cover<br />
diameter ratios all the way from 0.2 to over 0.8, so th at they<br />
apply to both low-ratio and high-ratio nozzles, as these terms<br />
were originally defined by the committee. The meanings of the<br />
terms “low-ratio” and “high-ratio” are clearly defined and illustrated<br />
in Fig. 1311 of this closure. I t should be noted th at the<br />
nozzle proportions given in Fig. 20 of Dr. Johnson’s reference8 do<br />
not correspond exactly to those given in Fig. 12 just referred to.<br />
The most im portant difference is in the length of the parallel<br />
portion of the throat. Except for a few nozzles loaned to the<br />
committee, the length of the throat section of all nozzles did not<br />
exceed the 0.6D2 shown in Fig. 13 of this closure. Of course,<br />
with the I.S.A. nozzles th at were used, this throat section is even<br />
shorter.<br />
I t has been known for some tim e12 th a t a long throat section<br />
will result in lowering the value of the discharge coefficients<br />
slightly. This will be particularly true as the throat diam eter is<br />
decreased. Therefore, it cannot be expected th a t the coefficient<br />
values given in the present paper will apply exactly to smalldiam<br />
eter nozzles if made w ith as long a throat section as is called<br />
for by Dr. Johnson’s reference.8 I t is unfortunate th a t such a<br />
discrepancy should exist between values given in papers by two<br />
committees of the Society. The authors do not know the source<br />
of Fig. 20 of th at report.8 However, as one of the authors is a<br />
member of the subcommittee which prepared the former report,<br />
he accepts his share of the responsibility for the difference between<br />
the two figures.<br />
As to the wall thickness of the nozzle throat there was no general<br />
rule. For the larger-diameter-ratio nozzles, there was the<br />
requirement th at there be some clearance (over Vie in. diam)<br />
between the outside surface of the nozzle throat and the inner<br />
surface of the pipe. The purpose of this clearance is to provide<br />
fluid passage to the outlet-pressure tap when this is “under” the<br />
nozzle throat. This made it necessary to have the throat-wall<br />
thickness about Vs in. for some of the larger nozzles for 4-in. and<br />
smaller pipe. For most of the nozzles the throat-wall thickness<br />
ranged from about Vie in. for 2-in. pipe to s/s in. for 8- and 16-in.<br />
pipe. So far as the authors know, the principal advantage of a<br />
thick wall is to diminish the possibility of the nozzle being damaged<br />
or deformed in handling.<br />
The authors believe th at the range of Reynolds’ numbers<br />
covered in the present paper probably meets 75 per cent or more<br />
of the cases in commercial use. Moreover, there is much less<br />
scattering of the test data in the higher Reynolds’ num ber range<br />
11 R eproduced from paper, “ R esearch on Flow N ozzles,” by H . S.<br />
Bean, M echanical Engineering, vol. 59, 1937, Fig. 1, p. 501.<br />
12 “ M easurem ent of Flow of A ir and G as W ith N ozzles,” by S. A.<br />
M oss, T rans. A .S.M .E ., vol. 50, 1928, pap er A PM -3, pp. 1-10; discussion<br />
by H . S. Bean, pp. 13-15.<br />
so th a t it was easier to obtain agreement over th a t region.<br />
Therefore, it seemed advisable to present this much of the results<br />
so users could have the benefit of it. As shown by Table 1<br />
of the paper, some data were obtained for throat Reynolds’<br />
numbers of less than 100 and these results will be presented in a<br />
later paper. However, the spread of coefficients a t low Reynolds’<br />
numbers is much greater than for the region here considered,<br />
so th a t they will be subject to a much larger tolerance<br />
than given for these results.<br />
As to Professor Pardoe’s suggestion, some eight to twelve<br />
nozzles provided with throat taps were used in the research<br />
program, although none was much if any over 0.5-diam ratio.<br />
Two of the nozzles were equipped w ith four pressure holes at 90<br />
deg. W ith both of these, the results were more or less different<br />
w ith each pressure hole. While such a limited number of tests<br />
is insufficient as a basis for a final conclusion, it does strengthen<br />
the authors’ belief th a t placing a pressure hole in a nozzle throat,<br />
where the fluid velocity past the hole is the highest, adds to the<br />
difficulties of obtaining reproduceable conditions. Moreover,<br />
except where the nozzle is of the solid-block type, the use of a<br />
throat tap adds considerably to the cost of construction.<br />
M r. King has shown a method which m ay be followed where it<br />
becomes necessary to extrapolate far beyond the range of the<br />
test data. The authors agree that, if practicable, for such cases,<br />
it is always better to use a method of plotting which results in<br />
straight lines.<br />
However, it should be pointed out th a t there are but scant published<br />
data to support the assumption th a t the actual flow is:<br />
Q = K hn, where n is a value different from the theoretical<br />
value of 0.5, which is the assumption upon which this straight<br />
line is drawn. I t is also apparent th at, if the curve is to be used<br />
for extrapolation, the head scale is being extrapolated 9 times its<br />
highest reading if the quantity and Reynolds’ num ber curves are<br />
being extrapolated to 3 times their value.<br />
These facts seem to indicate th a t M r. King’s suggested method<br />
requires more proof as to its accuracy before it can be accepted<br />
as the best method of extrapolation of these data.<br />
Referring to the difference in coefficients between Mr. King’s<br />
nozzles No. 59534 and No. 59535, the authors believe this illustrates<br />
the desirability, not only of keeping the ratio of throat<br />
diam eter to pipe diam eter a t or below 80 per cent whenever possible,<br />
b u t also of boring the pipe so as to make the pipe surface<br />
concentric w ith the nozzle throat and as smooth and free from<br />
local irregularities as possible. Naturally, the effect of such surface<br />
roughness and eccentricity is greatly minimized w ith nozzles<br />
of small diam eter ratio, but quite likely to be magnified as the<br />
diam eter ratio increases.<br />
In comparing the shape of the coefficient curves of these two<br />
nozzles in Fig. 10 of Mr. K ing’s discussion, it m ust be remembered<br />
th at twice as much data were taken on the bored-pipe nozzle No.<br />
59535 as with the unbored-pipe nozzle No. 59534; and that, had<br />
a slight am ount of data been taken w ith nozzle No. 59534, the<br />
shape of its coefficient curve’ would likely have been much the<br />
same as the curve for the bored-pipe nozzle.
R em arks on the A nalogy B etw een H eat<br />
T ransfer and M om entum T ran sfer<br />
B y L. M. K. B O E L TE R ,1 R. C. M A R T IN E L L I,2 a n d F IN N JONASSEN2<br />
T h is paper p r e se n ts a n e x te n sio n o f V on K a r m a n ’s<br />
a n a ly sis o f h e a t transfer to flu id s in clo sed c o n d u its, b ased<br />
o n th e a n a lo g y b etw een h e a t transfer a n d m o m e n tu m<br />
transfer. For a p a rticu la r id eal sy ste m , a n exp ressio n for<br />
th e te m p er a tu r e d istr ib u tio n in a fluid in tu r b u le n t m o <br />
tio n b ein g h e a te d or cooled in sid e o f a circu la r p ip e is d e <br />
rived a n d a r e la tio n is o b ta in e d b e tw e en N u sse lt’s m o d u lu s<br />
a n d th e p ip e -fr ic tio n fa cto r for “ iso th e r m a l” h e a t tr a n s <br />
fer. T h is e q u a tio n is e x ten d ed t o a p p ly in c a se s in w h ic h<br />
th e p h y sica l p ro p erties o f th e fluid vary a cro ss t h e se c tio n<br />
o f th e p ip e. T h e a p p a ren t v a ria tio n o f t h e d im e n sio n le ss<br />
d ista n ce p a ram eter y + w ith ra tio o f w all v isc o sity to<br />
la m in a r su b la y er v isc o sity a n d R eynold s' n u m b e r is o b <br />
ta in e d . A co m p a riso n b e tw e en th e e q u a tio n develop ed<br />
in th e paper a n d th e N u sse lt e m p irica l e q u a tio n , in <br />
clu d in g th e c o n sta n ts e v a lu a ted b y D ittu s a n d B o elter,<br />
is m a d e.<br />
N o m e n c l a t u r e<br />
The following nomenclature is used in the paper:<br />
a = constant in empirical equation for viscosity<br />
A = area perpendicular to heat flow, ft2<br />
A 0 = inside surface area of pipe, ft2<br />
6 = exponent in empirical equation for viscosity<br />
cp — unit heat capacity of fluid, B tu/lb deg F<br />
C = constant<br />
D = diameter of pipe, ft<br />
/ = friction factor for flow in pipe, dimensionless<br />
f c = unit therm al conductance between pipe and fluid,<br />
B tu per (hr) (sq ft) (deg F)<br />
g = gravitational constant, ft /h r sec<br />
k = thermal conductivity of fluid, B tu per (hr) (ft2)<br />
(deg F /ft)<br />
I = Prandtl mixing length, ft<br />
In = natural logarithm<br />
m = exponent of Re in empirical heat-transfer Equation<br />
[2]; also subscript indicating mean tem perature<br />
n = exponent of Pr in Equation [2]; also subscript denoting<br />
location of thermal resistance<br />
q = radial rate of heat transfer, B tu per hr<br />
go = radial rate of heat transfer through pipe wall, B tu /h r<br />
r = distance from center of pipe to any point, ft<br />
r0 = radius of pipe, ft<br />
t — tem perature a t any point y, deg F<br />
V = fluctuating component of temperature, deg F<br />
ti = tem perature a t outer edge of laminar sublayer, deg F<br />
tw = tem perature of pipe wall, deg F<br />
u = average axial velocity of flow at any point y, fps<br />
1 Professor of M echanical Engineering, U niversity of C alifornia,<br />
Berkeley, C alif. M em . A .S.M .E .<br />
2 In stru cto r in M echanical Engineering, U niversity of C alifornia,<br />
Berkeley, Calif.<br />
C ontributed by th e H e a t T ransfer Professional G roup and presented<br />
a t th e A nnual M eeting, N ew Y ork, N . Y ., D ecem ber 2-6, 1940, of<br />
T h e A m e r ic a n S o c ie t y o f M e c h a n ic a l E n g i n e e r s .<br />
N o t e : S tatem en ts and opinions advanced in p apers are to be<br />
understood as individual expressions of th eir auth o rs and n o t those<br />
of th e Society.<br />
447<br />
Mi = velocity at edge of lam inar sublayer, fps<br />
u ' = fluctuating component of axial velocity, fps<br />
Mmi = average axial velocity a t center of pipe, fps<br />
Wmean = mean velocity of flow based on rate of discharge and<br />
pipe area, fps<br />
u + — dimensionless “velocity” param eter<br />
v = u u c u u a u n g com ponent, oi v elo city p e rp e n u ic u ia r to<br />
axis of pipe, fps<br />
y = distance from wall, ft<br />
yi = distance from wall to outer edge of laminar sublayer,<br />
ft<br />
y-> = distance from wall to outer edee of buffer laver. ft<br />
y + = dimensionless “distance” param eter<br />
yi+ = dimensionless param eter fixing dimensions of laminar<br />
sublayer<br />
yi+ = dimensionless param eter fixing dimensions of buffer<br />
layer<br />
At = difference between tem perature of pipe wall and any<br />
point y, deg F<br />
Aimax = difference between tem perature of pipe wall and center<br />
of pipe, deg F<br />
Aimean = difference between tem perature of pipe wall and average<br />
(mixed) tem perature of fluid, deg F<br />
€ = eddy diffusivity, f t2/sec<br />
y = weight density of fluid, Ib/cu ft<br />
k = K&rmdn constant = 0.4<br />
iu = viscosity of fluid, lb-sec/ft2<br />
Mi = viscosity of fluid a t tem perature 11, lb-sec/ft2<br />
jUf = mean fluid viscosity in lam inar sublayer, lb-sec/ft2<br />
= viscosity of the fluid a t the tem perature tw, lb-sec/ft2<br />
v = kinematic viscosity of fluid, f t2/sec<br />
v\ = kinematic viscosity of fluid a t tem perature U, ft2/sec<br />
£ = function which fixes velocity at edge of lam inar sublayer<br />
p = density of fluid, (lb sec2) /f t4<br />
r = unit shear a t any point y, lb /ft2<br />
to = unit shear at wall, lb /ft2<br />
= function<br />
f cD<br />
N u = Nusselt’s modulus = —— k<br />
Nux = Nusselt’s modulus of laminar sublayer<br />
N ui = Nusselt’s modulus of buffer layer<br />
N u3 = Nusselt’s modulus of turbulent core<br />
N u n — Nusselt’s modulus of any of three fluid layers<br />
Pr = P randtl’s modulus = ixcpg/k<br />
Pri — P randtl’s modulus at tem perature L<br />
Prm = Prandtl’s modulus at mean (mixed) fluid tem perature<br />
Re = Reynolds’ modulus - — -<br />
M<br />
Rem = Reynolds’ modulus a t mean (mixed) fluid temperature
448 TRANSACTIONS OF T H E A.S.M.E. JULY, 1941<br />
I n t r o d u c t io n<br />
Application of the theory of similarity to the differential equations<br />
of heat transfer and fluid flow yields the result th a t for heat<br />
transfer from a fluid to a solid boundary in similar systems a relation<br />
N u = (Re, P r )........................................ [1]<br />
will exist. The function m ay be formulated from experimental<br />
data and, for purposes of design, an empirical expression of the<br />
form<br />
N u = CRemP r"........................................ [2]<br />
is normally employed.<br />
Reynolds (l),3 and later P randtl (2), G. I. Taylor (3), and von<br />
Kdrmdn (4) have attem pted to deduce the form of the function<br />
analytically for turbulent flow by comparing the exchange of<br />
momentum and of heat. Reynolds dealt with a purely turbulent<br />
system in which exact similarity between tem perature and velocity<br />
fields was postulated (i.e., Pr = 1). P randtl and G. I.<br />
Taylor extended the analogy to other values of the Prandtl<br />
modulus Pr by introducing a concept which included a laminar<br />
sublayer and a turbulent core. Von K&rm&n defined a buffer<br />
layer (of particular characteristics) which was located between<br />
the laminar layer and the turbulent core.<br />
An attem pt is made by the authors of this paper to provide an<br />
extension of the ideal system of von Kdrm&n. In this ideal<br />
system, the resistances to heat transfer from a solid boundary to<br />
a fluid consist of the following:<br />
1 A lam inar sublayer in which viscous forces predominate.<br />
The heat is transferred through this sublayer by conduction only.<br />
2 A “buffer” layer in which both viscous and eddy forces are<br />
im portant and through which heat is transferred by both thermal<br />
conduction and eddy diffusion.<br />
3 A core of fluid in which eddy forces predominate. The heat<br />
is transferred in the core by eddy motion only.<br />
The rate of heat transfer per unit area and the unit shear at<br />
any point in the system m ay be expressed as follows:<br />
1 N um bers in parentheses refer to th e B ibliography a t end of paper<br />
* See N ote 1 of A ppendix.<br />
TABLE 1<br />
For Pr = 1 the tem perature and the velocity fields are similar.<br />
The evaluation of the unit shear and the rate of heat transfer<br />
require a knowledge of the velocity gradient<br />
in the system.<br />
*“ * (|)<br />
at every point<br />
“ I s o t h e r m a l ” H e a t T r a n s f e r i n a C i r c u l a r P i p e<br />
For circular pipes, the experimentally determined velocity<br />
distribution may be correlated (7) by plotting the parameter<br />
One curve is obtained for all magnitudes of Reynolds’ modulus,<br />
Re. This plot is shown in Fig. 1.<br />
F i g . 1<br />
V e l o c it y D i s t r i b u t i o n A c r o s s a P i p e , R e p r e s e n t e d b y<br />
M e a n s o f G e n e r a l i z e d C o o r d in a t e s<br />
The following equations express the velocity distribution in<br />
the three fluid layers:<br />
Laminar sublayer<br />
Buffer layer<br />
Turbulent core<br />
These equations allow the determination of ( d u \ at any point<br />
\ d y )<br />
in the flow system. The thermal resistance of each of the fluid<br />
layers m ay be calculated from the equations relating u + and y +.<br />
The necessary operations are given in Table 1. The following<br />
specifications of the ideal system are to be added to those listed:<br />
1 All fluid physical properties are independent of temperature;<br />
i.e., “ isothermal” heat transfer is postulated.<br />
D E F IN IT IO N OF IDEAL SYSTEM — ISOTHERM AL HEAT TRANSFER IN A CIRCULAR PIPE<br />
A=AREA PERPENDICULAR TO HEAT FLOW AT ANY y<br />
i ■FRICTION FACTOR<br />
It* THERMAL CONDUCTIVITY OF THE FLUID<br />
I 'PRANDTL MIXING LENGTH<br />
? 'RATE OF HEAT TRANSFER ( RADIAL) AT ANY y<br />
£ * RADIUS OF PIPE.<br />
t ■ TEMPERATURE OF FUJID AT ANY POINT y<br />
U* VELOCITY AT ANY POINT y<br />
y ■ DISTANCE FROM THE WALL<br />
l*.DISTANCE FROM WALL TO EDGE OF LAMINAR SUBLAYER<br />
^•DISTANCE FROM WALL TO EDGE OF BUFFER LAYER<br />
C ,,*UNIT HEAT CAPACITY OF FLUID<br />
-fc-RATE OF HEAT TRANSFER (RADIAL) AT y * 0 .<br />
A .- 2Hm?SURFACE AREA OF PIPE<br />
L- LENGTH OF PIPE<br />
* EDOY DIFFUSIVITY<br />
* KARMAN CONSTANT-0.40<br />
* KINEMATIC VISCOSITY OF FLUID<br />
-DENSITY OF FUJID<br />
■ SHEAR AT ANY POINT M<br />
« SHEAR AT WALL<br />
'.UNIT WEIGHT OF FLUID<br />
R- PRANDTLS MODULUS<br />
h‘-P<br />
NU- NUSSELTfe MOOULUS
BOELTER, M A RTINK LLI, JONASSEN—ANALOGY B ETW EEN HEA T AND M OM ENTUM TR A N SFER 449<br />
2 The shear is constant in both the lam inar sublayer and<br />
buffer layer, Fig. 2.<br />
A-PIPE WALL<br />
The resistance to the center of the pipe is<br />
Thus the tem perature distribution in the turbulent core is<br />
given by<br />
A plot of the tem perature distribution for various magnitudes<br />
of the Prandtl modulus Pr a t Reynolds’ modulus Re equal to<br />
10,000 is shown in Fig. 3.<br />
F i g . 2 U n i t -S h e a r D is t r i b u t i o n A c r o s s P i p e<br />
(As em ployed in ideal sy ste m p resen ted in th is p ap e r.)<br />
3 The rate of radial heat flow per unit area is constant except<br />
in the turbulent region where it varies linearly to zero at the<br />
center. The postulate may be shown to be very nearly the case<br />
by performing a heat balance on a differential annulus_of fluid.<br />
4 The mixing length I, in the turbulent region is defined (8)<br />
by the equation<br />
Experimental evidence reveals th at this equation does not represent<br />
the facts. However, Prandtl (9), in effect,5 by making the<br />
same idealization, adequately represented the velocity distribution<br />
in a pipe.<br />
F i g . 3 P r e d i c t e d T e m p e r a t u r e D i s t r i b u t i o n A c r o s s P i p e<br />
S e c t i o n f o r V a r i o u s M a g n i t u d e s o f P r a n d t l M o d u l u s a t<br />
R e y n o l d s ’ N u m b e r = 1 0 ,0 0 0<br />
(P re d ic tio n is b a se d u p o n E q u a tio n [71-)<br />
Vr.<br />
The velocity distribution (10) is given by the equation<br />
pipe. This is a well-known weakness of all present-day logarithmic<br />
expressions for velocity distribution.<br />
From Table 1 the total resistance to heat transfer m ay be obtained<br />
Using values of yi+ — 5 and yi+ = 30, which are reasonable from<br />
an inspection of the data in Fig. 1, the final result is<br />
At a value of Pr = 1 the tem perature distribution should be<br />
identical with the velocity distribution. Setting Pr = 1 in Equation<br />
[7]<br />
This expression for — is based on the tem perature difference<br />
Re Pr<br />
between the pipe wall and the center of the pipe. Experimental<br />
results are always based on an average fluid tem perature. Thus,<br />
to compare Equation [3] w ith experimental values, the right side<br />
should be divided by the ratio<br />
which agrees favorably w ith Equation [8].<br />
The mean tem perature m ay be obtained graphically from the<br />
velocity and tem perature distributions. Thus for an incompressible<br />
fluid<br />
The temperature-difference ratio expressed in Equation [4] may<br />
be determined analytically from Equation [3].<br />
The therm al resistance from the wall to any point y, located<br />
in the turbulent core, is given by<br />
6 See N ote 2 of A ppendix.<br />
Curves of this expression for several magnitudes of Re are represented<br />
in Fig. 4. Inclusion of the effect of compressibility within<br />
the range of magnitudes employed by the experimenters quoted<br />
in this paper yielded results which did not differ appreciably from
450 TRANSACTIONS OF T H E A.S.M.E. JULY, 1941<br />
of Colburn and Coghlan fall between this lower limit and that<br />
given by Equation [11],<br />
N u<br />
Equation [11] indicates th at ——— is directly proportional<br />
Re Pr<br />
to<br />
with another term involving the friction factor in the<br />
denominator.<br />
For P r = 1, Equation [11] becomes<br />
F i g . 4 R a t io o f M e a n t o M a x im u m T e m p e r a t u r e D i f f e r e n c e s<br />
a s a F u n c t io n o f P r a n d t l M o d u l u s f o r R e y n o l d s ’ N u m b e r s =<br />
5 0 0 0 , 1 0 ,0 0 0 , a n d 1 0 0 ,0 0 0<br />
(Refer to Equation [10].)<br />
those of Equation [10]. Thus, for comparison w ith experimental<br />
data, Equation [3] becomes<br />
This result was obtained by Reynolds (1) for the ideal system in<br />
which the heat transfer was accomplished by eddy diffusion only.<br />
TABLE 2<br />
COM PARISON OF M AGNITUDES INVOLVED IN<br />
EQUATION [12]<br />
Plots of this expression for various magnitudes of Re are shown<br />
N o n is o t h e r m a l H e a t T r a n s f e r i n a C ir c u l a r P i p e<br />
The previous analysis is applicable only to “isothermal” heat<br />
transfer, since variations of viscosity and other fluid properties<br />
with tem perature were not considered. The data of Colburn and<br />
Coghlan and Eagle and Ferguson are comparable to these conditions<br />
for, in the former, variations of viscosity were small and,<br />
in the latter, all results were extrapolated to conditions of zero<br />
heat transfer. On the other hand, the analysis of heat transfer<br />
in fluids which possess a highly variable viscosity requires the<br />
definition of another ideal system. In particular, the boundary<br />
of the lam inar sublayer for nonisothermal flow requires investigation.<br />
The dimensionless variable, yi+, which fixes the outer<br />
boundary of the lam inar sublayer will be redefined as a point<br />
function (exclusive of the unit-shear term which is defined as<br />
constant). Thus<br />
REYNOLDS' MOOULUS<br />
F i g . 5 E x p e r i m e n t a l a n d P r e d i c t e d M a g n i t u d e s o f N u / (Re Pr)<br />
a s F u n c t i o n o f R e y n o l d s ’ M o d u l u s f o r D i f f e r e n t M a g n i t u d e s<br />
o f P r a n d t l M o d u l u s<br />
(Predicted magnitudes apply to ideal isothermal heat-transfer system.)<br />
in Fig. 5, as well as the data of Eagle and Ferguson (11) and Colburn<br />
and Coghlan (12). The correlation is seen to be good except<br />
a t low values of Re. This discrepancy m ay be due in part to the<br />
fact that, since therm al calming sections were not used, the<br />
tem perature distribution considered in this analysis was not a t<br />
tained until the fluid traversed a considerable distance in the<br />
test section. This distance would be shorter the higher the magnitude<br />
of the unit therm al conductance. Thus better correlation<br />
a t high Reynolds’ numbers m ay be expected.<br />
N u<br />
The lower limit o f---- — is th at given by Equation [3], in which<br />
R eP r<br />
case the tem perature is, in effect, considered constant across the<br />
pipe section. Calculation reveals th at the experimental points<br />
where n is the kinematic viscosity of the fluid a t the edge of the<br />
lam inar sublayer and t 0 is the shear at the wall under nonisothermal<br />
conditions. Evaluation of the therm al resistance of the<br />
lam inar sublayer yields the Rxnression<br />
W ithout introducing too great an error, the remainder of the<br />
fluid system m ay be defined as possessing a constant viscosity<br />
which is fixed by the mean fluid tem perature. The expression for
BOELTER, M A R TIN ELLI, JONASSEN—ANALOGY B ETW EEN H EA T AND M OM ENTUM TR A N SFER 451<br />
Examination reveals th at Equation [11] is a special case of<br />
Equation [16]. A large variation of viscosity across the laminar<br />
sublayer should cause variations in yi+, which fixes its boundary.<br />
To determine this variation, the data of Morris and W hitman<br />
(13) were substituted into Equation [16], Excellent correlation<br />
resulted, j/i+ being a function of Reynolds’ modulus, and the ratio<br />
— where nw = the viscosity of the fluid at the wall tem perature<br />
Mi<br />
and mi = the viscosity of the fluid at the tem perature existing at<br />
the edge of the laminar sublayer.8<br />
The results of the computations are shown in Fig. 6, and are<br />
tabulated in Table 3. Using the curves of Fig. 6 and the experi-<br />
TABLE 3 MAGNITUDES OF yi *<br />
Hw RSm Rem Rem Rem Rem Rem<br />
Ml 3000 5000 10000 20000 40000 100000<br />
0.10<br />
0.20 2.30 .,<br />
0.30 3.12 2.34<br />
0.40 3.70 3.07 2^40<br />
0.50 4.10 3.60 3.09 2’.60 2i00<br />
0.60 4.43 4.03 3.62 3.34 2.90 2 ! 50<br />
0.70 4.68 4.40 4.10 3.90 3.62 3.40<br />
0.80 4.82 4.70 4.50 4.40 4.25 4.10<br />
0.90 4.95 4.90 4.80 4.75 4.70 4.65<br />
1.00 5.00 5.00 5.00 5.00 5.00 5.00<br />
1.50 4.95 4.80 4.60 4.35 4.00 3.75<br />
2 .00 4.89 4.52 4.20 3.75 3.00 2.50<br />
3.00 4.75 4.18 3.60 2.70<br />
4.00 4.65 3.90 3.15<br />
5.00 4.57 3.70<br />
6.00 4.50<br />
7.00<br />
F i g . 7 P r e d i c t e d M a g n i t u d e o f N u s s e l t M o d u l u s P l o t t e d a s<br />
F u n c t i o n o f E x p e r i m e n t a l M a g n i t u d e s o f N u s s e l t M o d u l u s ,<br />
f o r H e a t i n g a n d C o o l i n g , a n d f o r R a n g e o f P r a n d t l M o d u l u s<br />
F r o m 0 .4 6 t o 3 2 4<br />
(R efer to E q u a tio n [16].)<br />
If At = ^ (an empirical expression of wide application)—then<br />
A plot of this expression is shown in Fig. 8.<br />
A comparison of the predicted value of i i<br />
as compared with<br />
the measured values of J. F. D. Smith is shown in Fig. 9. The<br />
check is usually within 6 per cent which is sufficiently accurate for<br />
F ig . 6 M a g n i t u d e o f y i+ a t I n t e r f a c e B e t w e e n L a m i n a r S u b <br />
l a y e r a n d B u f f e r L a y e r a s a F u n c t i o n o f R a t i o o f W a l l t o<br />
I n t e r f a c e V i s c o s i t i e s , R e y n o l d s ’ N u m b e r a s P a r a m e t e r<br />
mental conditions of Colburn and Coghlan, Eagle and Ferguson,<br />
Morris and Whitman, and J. F. D. Smith (14), magnitudes of<br />
N u were computed. The magnitude of the predicted Nusselt<br />
modulus employing Equation [16] was plotted against the experimental<br />
magnitudes in Fig. 7.<br />
The friction factors used in the foregoing correlation were obtained<br />
from the isothermal friction-factor curve7 a t a Reynolds<br />
number computed using the mean laminar sublayer viscosity t±j<br />
instead of the viscosity at the mean fluid tem perature tim. This<br />
viscosity (17) may be found from the relation<br />
1 See Note 3 of Appendix.<br />
7 See Note 4 of Appendix.<br />
RATIO -£■-<br />
F i g . 8 F u n c t i o n { P l o t t e d in T e r m s o f R a t i o o f W a l l t o I n t e r <br />
f a c e V i s c o s i t i e s f o r V a r i o u s M a g n i t u d e s o f V i s c o s i t y E x <br />
p o n e n t b; R a t i o o f M e a n L a m i n a r S u b l a y e r V i s c o s i t y t o I n t e r <br />
f a c e V i s c o s i t y a s a F u n c t i o n o f R a t i o o f W a l l t o I n t e r f a c e<br />
V i s c o s i t i e s
452 TRANSACTIONS OF T H E A.S.M.E. JULY, 1941<br />
in Fig. 10. In Equations [19] and [20] the fluid properties are<br />
evaluated a t the arithm etic mean fluid tem perature.<br />
Inspection of Equation [16] indicates th a t N u should be practically<br />
independent of P r for large magnitudes of the Prandtl<br />
modulus. However, variations of yi+ accompany the variations<br />
in viscosity which always occur in the experimental determination<br />
of N u. These variations in yi+ give the apparent influence of<br />
P r expressed by Equations [19] and [20].<br />
The velocity existing a t the edge of the laminar sublayer for<br />
nonisothermal conditions m ay be readily estimated. Since<br />
F i g . 9 R a t i o of t h e S q u a r e R o o t o f t h e M e a s u r e d t o t h e<br />
P r e d i c t e d F r i c t i o n F a c t o r f o r N o n i s o t h e r m a l F l o w a s a<br />
F u n c t i o n o f R e y n o l d s ’ M o d u l u s<br />
and<br />
which upon integration with<br />
the correlation shown in Fig. 7. Rohonczi (16) suggests a method<br />
of presenting the nonisothermal friction factor in terms of<br />
Reynolds’ modulus evaluated a t the wall tem perature. This<br />
method results in over-correcting the friction factor.<br />
becomes<br />
A plot of the function £ is given in Fig. 8.<br />
F i g . 10 P r e d i c t e d V e r s u s E x p e r i m e n t a l M a g n i t u d e s<br />
N u s s e l t M o d u l u s<br />
(Predictions in terms of empirical Equations [19] and [20].)<br />
A practical limit to the correlation w ith the available experim<br />
ental data exists. This lim itation is illustrated as follows:<br />
Investigators<br />
J. I D . Smith<br />
Morris and Whitman<br />
Run<br />
13 (cooling)<br />
F 16<br />
RCm<br />
5410<br />
5460<br />
Prm<br />
103<br />
H io<br />
M l<br />
4 .0<br />
3.4<br />
Nu<br />
71.1<br />
98.0<br />
Thus for practically identical experimental conditions the two<br />
investigators reported a difference in Nusselt’s modulus of 40 per<br />
cent. Some of this difference is explained by the fact th a t Morris<br />
and W hitman used commercial pipe, while J. F. D. Smith used<br />
smooth pipe. Even after making allowance for this fact the<br />
values of N u differ by about 30 per cent.<br />
In order to compare the results from Equation [16] w ith the<br />
empirical equations (15).<br />
the same experimental values used in Fig. 7 are plotted against<br />
the values computed by Equations [19] and [20], and are shown<br />
C o n c l u s io n s<br />
1 The therm al resistances involved in heat transfer from a<br />
boundary to a turbulently moving fluid have been segregated.<br />
An expression which correlates existing heat-transfer data for<br />
flow through tubes is proposed for the system in which the fluid<br />
properties are not functions of tem perature.<br />
2 The introduction of the concept of a variable t/i+, the utilization<br />
of an average viscosity rather than the viscosity at an average<br />
tem perature, and the estim ation of a nonisothermal friction<br />
factor make possible the prediction of unit thermal conductances<br />
to within =*=20 per cent for Reynolds’ numbers up to 100,000 and<br />
magnitudes of the Prandtl modulus between 0.5 and 325.<br />
3 An ideal system m ay be defined which will more accurately<br />
predict N u /(R e Pr) but the algebraic evaluation will be tedious.<br />
Among other operations, the variation of N u w ith length (due to<br />
the changes in properties and of tem perature distribution and the<br />
variation of q /A with radius) should be considered. Additional<br />
accurate experimental heat-transfer data will aid the analyst.<br />
4 Finally, a more precise formulation of the laws governing<br />
the velocity distribution (18) will allow the definition of a more<br />
satisfactory ideal system for heat transfer.<br />
Appendix<br />
N o t e 1<br />
Reynolds (5) conceived the flow a t a point in a two-dimensional<br />
system to be composed of an average velocity u upon which are<br />
superimposed fluctuating components u', v'. The unit shear due<br />
to the momentum transferred by these fluctuating components<br />
becomes
BOELTER, M A R TIN ELLI, JONASSEN—ANALOGY B ETW EEN H EAT AND M O M ENTU M TRA N SFER 453<br />
where the expression u'v' represents the time average of the<br />
instantaneous fluctuations u ' and v'. P randtl (6) assumed th at<br />
the fluctuating velocities would be equal to the product of a<br />
“mixing” length I and the velocity gradient a t the point. Thus<br />
the magnitude of the shear becomes<br />
for then<br />
whence<br />
By analogy to the expression for shear in viscous flow<br />
N o t e 3<br />
an eddy “kinematic viscosity” e m ay be defined as<br />
The tem perature a t the edge of the lam inar sublayer was estim<br />
ated by computing the therm al resistance of the lam inar sublayer,<br />
buffer layer, and core. Then as a first approximation<br />
and<br />
Similar reasoning in the case of the transfer of heat yields the<br />
rate of heat transfer per unit area in turbulent flow as<br />
Knowing ti an estim ate of yi+ can be made.<br />
Then more precisely<br />
where »' and t’ are the fluctuating components of velocity and<br />
tem perature, respectively. Then if<br />
the rate of heat transfer per unit area in turbulent flow becomes<br />
The identity of the eddy diffusivity e for heat transfer and momentum<br />
transfer is known as Reynolds’ analogy.<br />
and<br />
from which<br />
N o t e 2<br />
Prandtl actually postulated a constant shear across the pipe<br />
and a mixing length = ay. Thus<br />
Exactly the same result is obtained if<br />
For predictions corresponding to the experimental data of Colburn<br />
and Coghlan, and Eagle and Ferguson, the friction data of<br />
Stanton and Pannell for smooth pipe were used.<br />
For the J. F. D. Smith comparison, his own experimental<br />
magnitudes of / were used and for the Morris and W hitman<br />
comparison the following isothermal friction-factor curve (rough<br />
pipe) was utilized:<br />
Is<br />
V 7<br />
2000 12.0<br />
5000 13.7<br />
10000 14.9<br />
30000 16.6<br />
100000 18.3<br />
A c k n o w l e d g m e n t<br />
The authors wish to express their thanks to Mr. John Longwell<br />
who performed m any of the computations in this paper, and to<br />
the N ational Y outh Administration for assistance given.<br />
BIBLIOGRAPHY<br />
1 “ O n th e E x te n t an d A ction of th e H eatin g Surface for Steam<br />
B oilers,” b y O sborne R eynolds, P roc. M a nchester L iterary and<br />
Philosophical Society, vol. 14, 1874, p p . 7-12; C ollected P apers, vol.<br />
1, p p . 81-85.<br />
2 "B erm erkung iiber den W arm eiibertragung im R o h r,” by Ludwig<br />
P ra n d tl, Physikalische Zeitschrift, vol. 29, 1928, pp. 487-489.<br />
3 “ C onditions a t th e Surface of a H o t B ody Exposed to the<br />
W ind,” b y G . I. T aylor, G re a t B ritain A dvisory C om m ittee for Aeronautics,<br />
R eports and M em oranda, N o. 272, vol. 2, 1916-1917, pp.<br />
423-429.<br />
4 “ T h e A nalogy B etw een F luid F riction and H e a t T ran sfe r,”<br />
by T . von K&rman, T ran s. A .S.M .E ., vol. 61, 1939, pp. 705-710.<br />
5 “ O n th e D ynam ical T h eory of Incom pressible Viscous Fluids<br />
and th e D eterm in atio n of th e C riterio n ,” by O sborne R eynolds,<br />
R oyal Society Philosophical T ransactions, vol. 186A, 1895, p t. 1,<br />
pp. 123-164; C ollected Papers, vol. 2, pp. 535-577.<br />
6 “ U ber die ausgebildete T urbulen z,” b y Ludw ig P ra n d tl, Proc<br />
Second In tern atio n al C ongress for A pplied M echanics, Zurich, 1926,<br />
pp. 62-74.<br />
7 “ G esetzm assigkeiten der tu rb u le n te n S trom ung in glatten<br />
R ohren,” b y J. N ikuradse, V.D.I. Forschungsheft 356, 1932, 36 pp.<br />
8 “ T h e M echanics of T u rb u le n t Flow ,” by B oris A. Bakhm eteff,<br />
P rinceton U niversity Press, 1936, p. 72.
454 TRANSACTIONS OF THE A.S.M.E. JULY, 1941<br />
9 “Neuere Ergebnisse der Turbulenzforschung,” by Ludwig<br />
Prandtl, Zeilschrift dea Vereines deutscher Ingenieure, vol. 77, 1933, pp.<br />
105-113.<br />
10 Reference (8), p. 80.<br />
11 “On the Coefficient of Heat Transfer From the Internal Surface<br />
of Tube Walls,” by A. Eagle and R. M. Ferguson, Proc. of the<br />
Royal Society, vol. 127A, 1930, pp. 540-566.<br />
12 “Heat Transfer to Hydrogen-Nitrogen Mixtures Inside<br />
Tubes,” by A. P. Colburn and C. A. Coghlan. Paper in preprint form<br />
for presentation at A.S.M.E. Annual Meeting, New York, N. Y.,<br />
December 2-6, 1940.<br />
13 “Heat Transfer for Oils and Water in Pipes,” by F. H. Morris<br />
and Walter G. Whitman, Industrial and Engineering Chemistry, vol.<br />
20, 1928, pp. 234-240.<br />
14 “Heat Transfer and Pressure Drop Data for an Oil in a<br />
Copper Tube,” by J. F. Downie Smith, Trans. American Institute of<br />
Chemical Engineers, vol. 31, 1934, pp. 83-111.<br />
15 “Heat Transfer in Automobile Radiators of the Tubular<br />
Type,” by F. W. Dittus and L. M. K. Boelter, University of California<br />
Publications in Engineering, vol. 2, no. 13, 1930, pp. 443-461.<br />
16 “Druckabfallund Warmeiibertragung bei turbulenterStromung<br />
in glatten Rohren mit Berilcksichtigung der nichtisothermen<br />
Stromung," by Georg Rohonczi, Doctorate Dissertation E. T. H. at<br />
Zurich.<br />
17 “Die Grundgesetze der Warmeiibertragung,” by H. Grober<br />
and S. Erk, p. 174, Julius Springer, 1933; also Nusselt, W.<br />
Gesundh. Ing., vol. 38, p. 42, 1915.<br />
18 "Modern Developments in Fluid Dynamics,” edited by S.<br />
Goldstein, vols. 1 and 2, Oxford University Press, 1938, Chapters<br />
5, 7, 8, 14, and 15.<br />
D iscussion<br />
R. H. N o r r i s .8 The results achieved in this paper would be of<br />
greater practical value, if the authors could choose one or more<br />
relatively simple equations as practical approximations to their<br />
complicated correlation. Discrepancies up to 60 per cent are<br />
shown to be produced by the simple Equations [19] and [20],<br />
heretofore in common use.<br />
This paper is of course concerned with the relation between<br />
heat transfer and fluid friction, in term s of the param eter c n /k ,<br />
only for conditions of turbulent flow. For viscous flow, however,<br />
there is also a relation between heat transfer and fluid friction,<br />
the existence of which may, heretofore, have been obscured by the<br />
derivation of the theoretical results for heat transfer independently<br />
from those for friction, and the arbitrary choice of the arithmetic<br />
m ean for the tem perature difference.<br />
In the region of viscous flow, when the logarithmic mean is used<br />
for the tem perature difference, the variable denoted as (N u )/<br />
(Re)(Pr) can be plotted versus Re, as shown in Fig. 3, of a recently<br />
published paper.9 W hen the ratio of pipe length L to the<br />
diam eter D becomes sufficiently great, the value of (N u)/(R e)(P r)<br />
becomes asymptotic to a straight line of slope — 1 , the same<br />
slope th at the curve of friction factor has in the viscous region;<br />
thU8 iim k ) = a ifih j for < 4-<br />
....................... „ , (Nu) 0.458(//8) f<br />
and / - 64 (Re) so th a t for<br />
(cpUmean D *)/(kL) < 4.<br />
For larger values of (cpUme^D2) / (kL), w ith laminar flow, the<br />
slope becomes flatter, but this can be considered as a therm al<br />
“entrance effect,” resulting from the sudden change in surface<br />
tem perature a t the start of the heated section of the duct. The<br />
viscous-flow-frietion-factor curve would likewise flatten if the<br />
pipe length were sufficiently decreased and the calming section<br />
omitted.<br />
8 G eneral E ngineering L ab o rato ry , G eneral E lectric C om pany,<br />
S chenectady, N . Y. Ju n . A .S.M .E .<br />
9 “ L am inar-Flow H eat-T ran sfer Coefficients for D u c ts,” by R . H .<br />
N orris and D . D . Streid, T rans. A .S.M .E ., vol. 62, A ugust, 1940, pp.<br />
525-533.<br />
I t should be noted th a t /, as defined by the authors, is 4 times<br />
the value sometimes given in the definitions of / by other authors.<br />
E. S. Smith.10 The writer wishes to ask the authors just what<br />
they would expect to see happen in the throat of a venturi tube in<br />
which the flow is a t a sufficiently high Reynolds number th at turbulence<br />
would be high in a long straight pipe of the same diameter<br />
and with the same fluid moving a t the same velocity? The<br />
eddies should be powerfully suppressed in the venturi throat and<br />
the shear would be high near the wall of the throat since the velocity<br />
distribution is so nearly uniform. This question is raised<br />
in a paper by W. S. Pardoe,11 in which his results can be explained<br />
by having the tem perature of the w ater next to the wall under<br />
such conditions substantially equal to th at of the ambient air.<br />
Now this does not seem to the writer to be reasonable, although<br />
he does not profess to be an expert on heat transfer. It would<br />
seem th at there should be some gradient or drop of tem perature<br />
from the air to the wall, assuming th a t the air tem perature is<br />
higher.<br />
T h. v o n KXrmXn .12 This paper is a valuable contribution to<br />
the solution of the problem of heat transfer. The authors give an<br />
excellent presentation of the similarity between heat and momentum<br />
transfer following the lines indicated in the w riter’s paper13<br />
on the same subject. The new expression “buffer layer” for the<br />
transition layer between perfectly lam inar and perfectly turbulent<br />
regions, introduced by the writer in order to explain the discrepancies<br />
between experiments and the theories of Prandtl and<br />
G. I. Taylor, is quite appropriate. The investigation is definitely<br />
carried further beyond the results given in the former paper13 by<br />
a more detailed analysis of the turbulent region and especially by<br />
consideration of the tem perature changes in the cross section of<br />
the pipe. I t is gratifying that, by a more exact analysis, the<br />
agreement between theory and experiments appears even closer<br />
than the writer has found.<br />
A u t h o r s ’ C l o s u r e<br />
For low magnitudes of the Prandtl modulus, the empirical<br />
expressions, Equations [19] and [20], or their equivalent, such<br />
as Colburn’s j function (19),14 approximate the analytical relation<br />
with some accuracy. Fig. 11 of this closure illustrates the<br />
analytical equation plotted in terms of Colburn’s j function and<br />
Fig. 12 reveals a comparison of Colburn’s empirical equation,<br />
Reynolds’, P randtl’s, and von K&rm&n’s analogies, and Equation<br />
[11] of this paper. Below magnitudes of P randtl’s modulus equal<br />
to 10 the average slope of the analytical curve is approximately<br />
—2/s. However, at high magnitudes of Pr the slope of the analytical<br />
curve becomes — 1 , which indicates that, for low rates of heat<br />
transfer (isothermal) and high magnitudes of Prandtl’s modulus,<br />
N usselt’s modulus will be independent of P randtl’s modulus.<br />
Thus, th e exponent of the Prandtl modulus in any empirical<br />
equations, such as Equation [19] or [20], should be a function of<br />
Pr and the rate of heat transfer. I t appears to be fortuitous th at<br />
a constant exponent yields a satisfactory correlation.<br />
Several other modes of empirical correlation, using viscosities<br />
at tem peratures other than the mixed mean tem perature have<br />
10 C. J. T agliabue M fg. Co., B rooklyn, N. Y. M em . A .S.M .E.<br />
11 ‘‘E ffect of A m bient T em peratures on th e Coefficients of V enturi<br />
M eters,” by W . S. P ardoe, T rans. A .S.M .E ., vol. 63, 1941, Figs. 5<br />
and 10, p. 458.<br />
12 D irector, D aniel G uggenheim A eronautical L aboratory, California<br />
In stitu te of Technology, P asadena, Calif. M em. A .S.M .E.<br />
18 “ T h e A nalogy B etw een F luid F riction and H e a t T ransfer,” by<br />
T h . von K&rmdn, T ran s. A .S.M .E ., vol. 61, 1939, pp. 705-710.<br />
14 N um bers (19) to (23) refer to B ibliography a t the end of this<br />
closure; all oth er num bers in parentheses refer to th e B ibliography a t<br />
th e end of th e paper.
BOELTER, M A R TIN ELLI, JONASSEN—ANALOGY B ETW EEN HEA T AND M OM ENTUM T RA N SFER 455<br />
F i g .^ 11 P l o t o f C o l b u r n ’s j F u n c t i o n [Nu/ (Re P r ) ] i V / »<br />
C a l c u l a t e d F r o m E q u a t i o n [11] f o r M a g n i t u d e s o f P r a n d t l ’s<br />
M o d u l u s B e t w e e n 0 .4 8 a n d 10<br />
(The’friction factor over eight (//8 ) is also presented as a function of<br />
Reynolds’ modulus.)<br />
F i g . 12<br />
C o m p a r is o n o f R e y n o l d s ’, P r a n d t l ' s , C o l b u r n ’s , a n d<br />
v o n K a r m a n ’s E q u a t io n s f o r V a r io u s M a g n it u d e s o f P r a n d t l ’s<br />
M o d u l u s F r o m 0.1 t o 1000 f o r R e y n o l d s ’ M o d u l u s = 1 0 ,0 0 0<br />
(The magnitudes as computed from Equation [11] are also presented.)<br />
been proposed (14, 17). Fair success in bringing experimental<br />
data together was attained by these methods so th at Fig. 10 of<br />
the paper may leave the impression of overestimating the inaccuracy<br />
of empirical correlations. However, the same fundamental<br />
limitations apply to these later correlations as to those<br />
presented in the paper. Equations [19] and [20], or similar<br />
forms, are in current use in industrial design.<br />
An im portant phenomenon which will cause scattering of data,<br />
particularly at low values of Prandtl’s modulus, is the entrance<br />
effect mentioned in the body of the paper.<br />
A uniform tem perature distribution exists at the entrance to<br />
a heating section, which will change to a distribution such as is<br />
shown in Fig. 3 of the paper if the heating section is of sufficient<br />
length. If, however, the test section is short, it is possible that<br />
the equilibrium-temperature distribution will not be reached.<br />
Application of Equation [11] to entrance sections will yield<br />
magnitudes of Nusselt’s modulus which are too low (for instance,<br />
A t mean<br />
—— = 1 for uniform tem perature distribution a t entrance)<br />
A C m a x<br />
because it applies only where the velocity and tem perature distributions<br />
have been established and steady-state conditions obtain.<br />
Due to the transition conditions existing in the thermal<br />
quieting sections, the magnitudes of Nusselt’s modulus have been<br />
found to exceed those which obtain after the tem perature distribution<br />
has been established (20).<br />
If the linear variation in unit shear in the buffer layer is utilized,<br />
rather than the constant wall-unit shear, the predicted magnitudes<br />
of Nu/Re Pr for low magnitudes of Reynolds’ and Prandtl’s<br />
moduli fall below those shown in Fig. 5 of the paper, and approach<br />
closely the experimental points of Colburn and Coghlan (21).<br />
Referring to E. S. Sm ith’s comments, regarding nonisotherm<br />
al flow in venturi meters, a difference in tem perature between<br />
the ambient air and the fluid within the pipe will cause<br />
heat transfer to (or from) the fluid. H eat transfer will occur<br />
throughout the entrance length as well as in the venturi proper.<br />
This tem perature difference will cause free convection in the entrance<br />
length, and will also change the viscosity of the fluid in the<br />
laminar sublayer in contrast to the magnitude corresponding to<br />
the mixed mean fluid tem perature. These phenomena m ay influence<br />
the discharge coefficient of the venturi and account for the<br />
fact th at the nonisothermal discharge-coefficient-Reynolds-number<br />
curve crosses the isothermal curve.<br />
Dr. Theo. von K&rmdn’s comments are indeed gratifying.<br />
Each correction as it is applied yields a prediction which more<br />
nearly approaches the best experimental results. The segregation<br />
of the resistances, due to each of the three fluid layers, has<br />
aided the authors in making further refinements to the isotherm<br />
al-heat-transfer theory. The attendant success served as a<br />
stimulus toward the analysis presented (yet incomplete) for nonisothermal<br />
flow.<br />
G e n e r a l C o m m e n t s<br />
Four excellent articles (22, 23, 24, 25) on this subject have come<br />
recently to the attention of the authors. M attioli (23) also<br />
utilizes y + as a point function. He considers the transfer of<br />
vorticity and momentum simultaneously.<br />
The sim ilarity of Nu/Re Pr = fc/Gcp, where G is the unit<br />
mass-flow rate, to the num ber of transfer units (N.T.U.) deserves<br />
attention in view of the move to assign a name to the<br />
former. In the tube-to-fluid exchanger, the N.T.U. = (Nu/<br />
Re Pr)S/A, where
P<br />
Kffect of A m bient T em p eratu res on the<br />
Coefficients of V en tu ri M eters<br />
RIO R to 1930, the writer attem pted to plot the coefficients<br />
of a large number of venturi tubes against Reynolds’ num <br />
ber and found the results rather unsatisfactory. This<br />
would, of course, be easily explained on the basis of proportional<br />
roughness and, as there seemed to be no definition of this function,<br />
the results were considered most unsatisfactory.<br />
During th at period, on three occasions venturi tubes were sent<br />
to the University of Pennsylvania laboratory for calibration.<br />
B y W. S. PA RD OE,1 PH ILA D ELPH IA , PA.<br />
Each tim e the makers proceeded to construct a m eter to fit the<br />
laboratory calibration. About 2 months later, when the combination<br />
of m eter and venturi tube was tested in the laboratory with<br />
different tem perature water, the coefficient was satisfactory on<br />
the flat part of the curve and a t some point lower, about 3 fps<br />
throat velocity, but in between the coefficients varied as much as<br />
0.5 per cent. This, of course, was all very confusing, as it was<br />
contradictory to any plot against Reynolds’ number.<br />
In 1931, the Simplex Valve and M eter Company presented the<br />
laboratory w ith an 8 X 33/s-in. bronze venturi meter. The<br />
results of tests on this m eter for 46, 63, 69, and 74 F w ater are<br />
shown in Figs. 1 and 2. These are quite similar to other curves<br />
on venturi meters. I t will be noticed th at on the flat p art of the<br />
curve the coefficient is 0.99 and a t 3 fps th ro at velocity the<br />
coefficient is 0.969. Curves such as th a t for 46 F became known<br />
Fig. l<br />
F i g . 3 T e s t s o f V e n t u r i M e t e r a t V a r io u s T e m p e r a t u r e s<br />
S h o w i n g C o e f f i c i e n t P l o t t e d A g a i n s t T h r o a t V e l o c it y<br />
Fig. 2<br />
F i g s . 1 a n d 2 T e s t o f 8 .0 6 -In . b y 3 .3 7 5 9 -In . B r o n z e V e n t u r i<br />
M e t e r a t V a r i o u s T e m p e r a t u r e s<br />
(Courtesy of Sim plex Valve and M eter C om pany.)<br />
1 Professor, D e p a rtm e n t of Civil Engineering, U niversity of<br />
Pennsylvania.<br />
C ontributed by Special R esearch C om m ittee on F luid M eters and<br />
presented a t th e A nnual M eeting, N ew Y ork, N . Y ., D ecem ber 2-6,<br />
1940, of T h e A m e r i c a n S o c i e t y o f M e c h a n i c a l E n g i n e e r s .<br />
N o t e : S tatem en ts and opinions advanced in papers are to b e<br />
understood a s individual expressions of their au th o rs and n o t those of<br />
th e Society.<br />
F i g . 4 T e s t s o f V e n t u r i M e t e r a t V a r io u s T e m p e r a t u r e s ;<br />
C o e f f i c i e n t P l o t t e d A g a i n s t R e y n o l d s ’ N u m b e r<br />
457
458 TRANSACTIONS OF T H E A.S.M.E. JULY, 1941<br />
F i g . 5 E f f e c t o f I n s t a l l a t io n o f V e n t u r i M e t e r B o x e d t o F i g . 8 E f f e c t o f I n s t a l l a t io n o f V e n t u r i M e t e r B o x e d t o<br />
P r e v e n t H e a t T r a n s f e r ; W a t e r T e m p e r a t u r e 4 2 F P r e v e n t H e a t T r a n s f e r ; W a t e r T e m p e r a t u r e 6 1 .5 F<br />
F .o . 6 T e s t o f V e n t u r i M e t e r , B o x e d t o P r e v e n t H e a t T r a n s - F l ° ' 9 T e 8 T 8 0 F F l ° 8 ' 5 TO 8 \ ^ CLUSIVE' P lO T T E D A g a in 8t<br />
f e r ; W a t e r T e m p e r a t u r e 5 3 F<br />
R e y n o l d s N u m b e r<br />
F i g . 7 E f f e c t o f I n s t a l l a t io n o f V e n t u r i M e t e r B o x e d t o F i g . 10 T e s t s M a d e t o C h e c k t h e E f f e c t o f I n s t a l l a t io n o n<br />
P r e v e n t H e a t T r a n s f e r ; W a t e r T e m p e r a t u r e 5 6 .5 F V e n t u r i M e t e r
PARDOE—E F FEC T OF A M B IEN T T EM PER A TU R ES ON C O E FFIC IE N T S OF V EN TU R I M ETERS 459<br />
as cold-water curves and those for 74 F as hot-water curves.<br />
In Fig. 3, are plotted the curves for 46, 63, and 74 F against<br />
throat velocity with the scales exaggerated. I t will be noted<br />
th at all these curves pass through 0.969 a t 3 fps. These curves<br />
plotted against Reynolds’ number are shown in Fig. 4, and do<br />
not make a very good showing.<br />
On a number of occasions the author has shown these curves<br />
to the Committee and to hydraulic groups of the A.S.C.E.,<br />
A.S.M.E., and S.P.E.E. The only response ever received has<br />
been to question the experimental work rather than to explain<br />
the facts. To be in error in the experimental work would mean<br />
th at the author could not measure 0.15 per ft accurately, which he<br />
certainly can.<br />
On a number of occasions, these curves have been placed in<br />
the hands of visitors to our laboratory and others who are interested<br />
in such m atters. Finally a set was given to D ean Goff<br />
of this institution, who, after some time, suggested the possibility<br />
of heat transfer entering the problem, th a t is, w ith cold<br />
water being measured and the room tem perature a t 70 F or thereabouts.<br />
The boundary layer at the throat was raised slightly in<br />
tem perature, thus decreasing the value of ja, decreasing the<br />
boundary shear to, and increasing the discharge for low tem peratures.<br />
In order to check this, a wooden box was built around the venturi<br />
m eter as shown in Fig. 5 and runs were made w ith a water<br />
tem perature of 42 F, giving the results shown. The box was<br />
drained and the curve immediately rose 0.7 per cent a t 3 fps,<br />
as indicated. Tests were also conducted w ith the same arrangem<br />
ent at 53, 56.5, and 61.5 F, as shown in Figs. 6, 7, and 8, respectively.<br />
In Fig. 9, the foregoing tests are plotted against Reynolds’<br />
number making quite a creditable showing. The variation of 0.2<br />
per cent m ust be blamed on the experimenter. To check the<br />
effect of installation, tests were made as indicated in Fig. 10.<br />
The variations are not extreme.<br />
From the foregoing it would appear th a t there is a distinct<br />
effect of ambient conditions on the coefficient of venturi meters.<br />
Unless they are thoroughly lagged during the test and in the<br />
permanent installation, they cannot give accurate results under<br />
all circumstances.<br />
D iscussion<br />
R. W. A n g u s.2 Although this paper is brief, it is a distinct<br />
contribution to the subject and gives an explanation of w hat<br />
appeared to be an inconsistency in the m eter experiments.<br />
Evidently the rate of heat transfer through the walls of the<br />
m eter tube is sufficient to produce erratic coefficients a t low<br />
throat velocities, while it does not affect those a t high throat<br />
velocities, presumably because of the time element.<br />
One of the practical applications of the results is that, in the<br />
author’s meter, the coefficients for different tem peratures and<br />
for a throat velocity of 10 fps differ by 0.5 per cent. There is<br />
about the same difference a t 2 fps, in both cases for the m eter<br />
tested unjacketed; the differences are less than this at intermediate<br />
velocities. Inasmuch as it is impossible, in most cases,<br />
to jacket meters in service, these errors would seem to be inherent<br />
in the use of this instrum ent but they are likely to be smaller in<br />
meters which are larger than the one covered by the author’s<br />
work. As an effort would be made, wherever possible, to select a<br />
meter working with throat velocities corresponding to the flat<br />
part of the curve, the error may not be serious in practice, but<br />
yet it is there, giving a sense of uncertainty as to the m eter indi<br />
2 Professor of Mechanical Engineering, University of Toronto,<br />
Toronto, Canada. Honorary Member A.S.M.E.<br />
cation. M eters are in common use on waterworks plants where<br />
the highest degree of accuracy is usually only necessary when<br />
they are being used to measure pump efficiency, in which case<br />
the rated pum p discharge generally corresponds w ith the higher<br />
throat velocities, the coefficient being constant.<br />
The writer has compared the coefficients in this paper with<br />
those given in the Fluid M eters R eport.3 The latter shows4 that,<br />
for the size m eter mentioned in the paper, and with w ater a t 68 F,<br />
the coefficient has a constant value at over 7 fps throat velocity,<br />
while Fig. 2 of the paper shows that, for the m eter used w ith<br />
w ater at 69 F, the coefficient reaches its constant value a t about<br />
20 fps. Both of these figures and curves apply to Simplex meters,<br />
although one is for an iron tube w ith bronze throat while the<br />
other is for a bronze tube.<br />
The w riter has great confidence in the accuracy of the author’s<br />
work but believes th a t the high degree of precision he has achieved<br />
m ay cause his results to be misinterpreted. The report3 mentioned<br />
bears every evidence of great care in its preparation and<br />
m ust be looked upon as an excellent piece of work. In th a t report<br />
two sets of curves5 are given which show many sizes of venturi<br />
tubes having a diam eter ratio of 0.5. From these curves the<br />
coefficients m ay easily be read to 0.1 per cent. Equation [261]*<br />
enables the coefficient to be calculated for any other diam eter<br />
ratio w ith the same degree of accuracy; in fact, in the examples<br />
given, the coefficients are worked out to 0.01 per cent. The<br />
data for these are for the most part based on the experiments of<br />
the author. Their accuracy is unquestioned.<br />
The experimental work extended only to tubes for pipes not<br />
over 12 in. diam and for a more or less ideal setup of the tubes.<br />
However, b u t slight guidance is given as to w hat is m eant by<br />
the proper setup and how it m ay conveniently be determined<br />
whether or not the coefficients will apply to a tube being used<br />
in a practical case.<br />
D uring the summer of 1939, the w riter was retained by the<br />
City of Toronto, Canada, to conduct tests on eleven new pum p<br />
ing units installed in one of the city pumping stations, and presented<br />
the results of these tests in a recent paper.7 The guarantees<br />
for efficiency were unusually high and the penalties for<br />
nonfulfillment of the contract were extremely stringent, particularly<br />
on some of the units, so th a t the w riter was obliged to<br />
use every possible precaution to secure accuracy.<br />
Discharges were measured with venturi tubes, and the pipes<br />
leading the w ater thereto were as well laid out as possible, the<br />
bends being of long radius; in most cases there was a long straight<br />
pipe upstream from the tube. In the m eter used on one of the<br />
pumps, the discharges, computed from the Fluid M eters Report<br />
coefficient of 0.9876, were known to be too high. A careful volumetric<br />
calibration of the tube was subsequently made, which<br />
gave an actual coefficient of 0.9545. There were slight bends<br />
upstream from the tube but, ordinarily, these could not have accounted<br />
for this great difference. Since the tube had been examined<br />
and calipered before erection and again after it had been<br />
in use for a time, there appeared to be no other cause for this<br />
difference in coefficients than a probable error in the one given<br />
by the Fluid M eters Committee, or else a disturbance from the<br />
pump.<br />
After discovering this discrepancy, the writer discussed the<br />
m atter w ith a num ber of engineers and found th a t there were<br />
3 “Theory and Application of Fluid Meters,” A.S.M.E. Report<br />
of Fluid Meters Committee, Fourth edition, 1937.<br />
* Ibid., Fig. 64, p . 101.<br />
6 Ibid., chapter “Discharge Coefficients for Venturi Tubes,” Figs.<br />
63 and 64, pp. 100 and 101, respectively.<br />
6 Ibid., p. 99.<br />
7 “An Improved Technique for Centrifugal-Pump-Efficiency Measurements,”<br />
by R. W. Angus, Trans. A.S.M.E., vol. 63, January, 1941,<br />
p p . 13-19.
460 TRANSACTIONS OF T H E A.S.M.E. JULY, 1941<br />
m any cases in which the coefficients differed from those recommended<br />
by the committee. The writer, therefore, expresses the<br />
hope th a t the Fluid M eters Committee will give this m atter further<br />
serious consideration, and present to the Society all available<br />
evidence in support of its findings, particularly in the case of<br />
large meters. Its report should be supplemented by instructions<br />
which will assist those using the m eters in determining<br />
whether the coefficients are likely to apply. While such a device<br />
as a straightening vane is usually helpful there is no desire to<br />
undergo the expense of installing the device unless it is necessary.<br />
Further, the examination of conditions above the m eter tube is<br />
frequently extremely difficult and will not be undertaken unless<br />
there is some definite reason to do so.<br />
In the present state of the art no one knows whether a given<br />
setup corresponds to the Fluid M eters Committee’s coefficients<br />
or not and, further, the report seems to be of theoretical rather<br />
than practical value because it does not suggest th a t actual coefficients<br />
are known to deviate from those given, nor does it a t<br />
tem pt to quote these coefficients. The tolerance of ±0.75 per<br />
cent8 in the coefficient for cast-iron tubes, as given in the report,<br />
seems scarcely consistent w ith the accuracy w ith which the<br />
coefficient is worked out in the examples appearing elsewhere8in<br />
the report.<br />
M. M. B o r d e n . 10 Before such information can be used for<br />
the closer control of venturi coefficients and to lim it their tolerances,<br />
the m atter will require further investigation involving<br />
venturi sizes, ratios, effect of roughness, and through a greater<br />
range of tem perature difference.<br />
The effect of enlarging the area of the throat, because of<br />
higher tem peratures of a fluid in it, should cause the coefficient<br />
to increase. Hence, the full effect of a difference of tem perature<br />
within and w ithout the tested tubes m ay be slightly different<br />
than indicated.<br />
A plot of the upper and lower coefficients to throat-velocity<br />
values for the venturi boxed and unboxed shows a generally<br />
narrower zone for the boxed unit. The area, included between<br />
such upper and lower limits, is about 10 per cent less for the<br />
boxed venturi for regions of 1 to 2 fps and 25 fps th ro at velocity.<br />
The author’s findings suggest the use of completely insulated<br />
cold-water venturis by enclosing them in suitable coverings, as<br />
is partially done with the covered venturis measuring hot fluids.<br />
E. S . S m ith .11 A s one who is now a disinterested observer<br />
b u t formerly an active mem ber of the Fluid M eters Committee,<br />
the writer can join a discussion of fluid metering only infrequently<br />
and has included in this discussion m aterial which might otherwise<br />
be added to the discussion of a current paper12 on the subject of<br />
nozzles. The present discussion gives something of the background<br />
of the paper and some material which is only indirectly related<br />
to the former bone of contention, i.e., the acceptance of the<br />
method of similarity in fluid metering.<br />
Over an extended period, the subcommittee on “sim ilarity,”<br />
consisted of Messrs. Pardoe, Spitzglass, and the writer, with<br />
Messrs. Pigott and Buckingham (deceased) lending moral support<br />
on occasion. Messrs. Spitzglass and Pardoe long and<br />
spiritedly opposed the acceptance of the Reynolds number as a<br />
basis for the correlation of fluid-meter coefficients on the grounds<br />
* R eference (3), p. 128.<br />
* Ib id ., p. 104.<br />
10 C hief E ngineer, Sim plex V alve & M eter C om pany, P hiladelphia,<br />
P a . M em . A .S .M .E .<br />
11 H ydraulic E ngineer, C. J . T agliabue M anufactu rin g C om pany,<br />
B rooklyn, N . Y . M em . A .S .M .E .<br />
11 “ D ischarge Coefficients of L ong-R adius Flow N ozzles W hen<br />
U sed W ith P ip e W all Pressure T a p s,” b y H . S. B ean, S. R . B eitler,<br />
and R . E . Sprinkle, T ran s. A .S.M .E ., vol. 63, 1941, pp. 439-445.<br />
of unstated limitations of the method of similarity and dimensional<br />
homogeneity. However, before his death, Mr. Spitzglass<br />
succeeded in making it clear th a t his acceptance of such correlation<br />
required th a t account be taken of the roughness of the line<br />
and/or meter, relative to its diameter, a phenomenon which is<br />
sometimes known as the “scale effect.” In his present paper<br />
the author has likewise succeeded in making it clear th at his acceptance<br />
awaited only an accounting for an additional factor,<br />
i.e., the effect of a different tem perature of wall and fluid for water,<br />
under the conditions of his tests w ith water.<br />
Since the acceptance of a useful engineering method is too<br />
often delayed by blind advocacy equally w ith opposition, there<br />
is a natural question as to the writer’s position. He admittedly<br />
made several elem entary and simplified statem ents in an effort<br />
to picture clearly the concepts of similarity involved. Some of<br />
these statem ents taken alone might give the impression th at the<br />
writer was blind to any points such as were stressed by the opponents<br />
of the acceptance of this method.<br />
Consequently, it is necessary to point out th a t a paper,13<br />
by the writer in 1923, covered the scale effect14 in Fig. 2 (which is<br />
based on some of the author’s values) and elsewhere in the<br />
text,16 while the closure1* noted th a t errors result from a difference<br />
of the tem perature of the fluid from th a t of the walls of the<br />
pipe or meter.<br />
In spite of this broad hint, the author’s delay in finding the<br />
cause of the errors which his tests included is understandable,<br />
since the w riter for one did not suspect th at this was the cause of<br />
inconsistencies in tests which were of the order of errors common<br />
in hydraulic testing, possibly including the tests which are noted<br />
in the second paragraph of the paper. A t one time, the writer<br />
checked and found correct everything but the atmosphere in the<br />
author’s laboratory. He is to be congratulated both for his<br />
persistence and the excellence of his tests and to be forgiven<br />
for his delay. If he had worked much w ith fluids other than<br />
water, he would certainly have earlier embraced the use of the<br />
Reynolds number as the only rational basis for their metering in<br />
practice and might have missed finding the cause of the slight<br />
error which he now stresses.<br />
His location of this error is a credit to the accuracy of his tests<br />
rather th an an indication th a t such error amounts to much.<br />
Taking a velocity of 2 fps and the w ater and air temperatures,<br />
respectively, a t 50 and 70 F, this error could be caused by a difference<br />
of level of only 0.6 ft of w ater a t the stated tem peratures in<br />
the vertical connecting pipes. Such differences often occur upon<br />
a change of rate w ith usual venturi recording and integrating<br />
instrum ents, w ith their large wells or bells, which cause a movem<br />
ent of liquid in the pressure pipes which is much larger than the<br />
metering head. In controlling flow, transient effects are important<br />
and such errors m ay be of consequence. This less than<br />
1 per cent error would am ount to less than 0.002 in. on a chart or<br />
integrator in which 0.1 in. corresponds with 1 fps throat velocity,<br />
a fact which incidentally shows the importance of precise setting<br />
at the lowest operating rate.<br />
If the “box-drained” values of Figs. 5 and 10 of the paper be<br />
multiplied by the ratios of w ater viscosities a t the water and air<br />
tem peratures, the corrected values fall close to the “box-overflowing”<br />
values and constitute a rough check of the Goff theory.<br />
Of course a t the higher rates, the effect of heat transfer disappears.<br />
Possibly a current paper17 on heat transfer m ay be useful if the<br />
13 “ T h e O il V en tu ri M e te r,” by E . S. S m ith, J r., T ran s. A .S.M .E.,<br />
vol. 45, 1923, pp. 67-75.<br />
14 Ib id ., F ig. 2, p. 71.<br />
16 Ibid ., p ar. 17, p. 71.<br />
16 Ib id ., first p ar. of closure, p. 75.<br />
17 “ R em arks on th e A nalogy Betw een H e a t T ransfer and M om entu<br />
m T ran sfe r,” by L. M . K . B oelter, R . C . M artinelli, and F inn<br />
Jonassen, T rans. A .S .M .E ., vol. 63, 1941, pp.447-455.
PARDOE—E FFEC T OF A M B IEN T T EM PER A TU R ES ON C O E FFIC IE N TS OF V EN TU R I M ETER S 461<br />
generally noneddying character of the flow in the throat be<br />
considered. In other words, the stated comparisons in Figs. 5<br />
and 10 indicate th a t the tem peratures of both the w ater and the<br />
wall of the “box-drained” tube are th a t of the am bient air—an<br />
indication th a t is contrary to the accepted heat-transfer teaching<br />
th at the wall tem perature of a conduit containing running w ater<br />
will approximate th a t of the w ater instead of th a t of the air.<br />
An explanation is accordingly requested.<br />
Due to the fact th a t the heat-transfer coefficients for turbulently<br />
flowing w ater and still air are of different orders, changes<br />
of wall tem perature from th a t of the stream are ordinarily insignificant<br />
except a t low velocities. It should not be difficult<br />
for the author to obtain a few tem perature and pitot traverses<br />
and settle this m atter in his closure, instead of relying on speculation<br />
which is supported by over-all calibrations only, of which<br />
there are many.<br />
Errors are to be expected with uninsulated hot-water meters,<br />
supercooled liquid-ammonia meters, and gas meters which are<br />
heated to prevent the formation of deposits a t the throat. A<br />
rise of gas tem perature should lead to a negative instead of a<br />
positive error, since the viscosity of a gas increases w ith tem perature<br />
while th a t of water then falls.<br />
It cannot be assumed th a t orifice m eters would be free from<br />
the Goff error, although such error should be in the opposite<br />
direction from th at of the venturi. Nozzles contained in the pipe<br />
and entirely surrounded by fluid should be practically immune to<br />
this error except for large diam eter ratios which, like orifices, are<br />
sensitive to the upstream velocity distribution. For highly accurate<br />
venturi measurements, it is possible to use the heated type<br />
of gas venturi with the circulation in the heating chamber provided<br />
by the differences of pressure existing in the downstream<br />
cone.<br />
No effect is to be expected on the flat portion of the coefficient<br />
curve for any differential producer. This general principle<br />
was brought out by Swift in his papers,18 which deal with<br />
other factors affecting the correlation of flowmeter coefficients<br />
with the Reynolds number.<br />
Since a high value of venturi coefficient exists on the flat portion<br />
of the curve and starts to fall off a t a relatively high value<br />
of the throat velocity at usual tem peratures and, hence, of the<br />
Reynolds number, such a venturi is relatively sensitive to this<br />
error. By roughening the approach curve, as was originally<br />
suggested to the writer by H erbert N. Eaton, chief of the N a<br />
tional Hydraulic Laboratory, and shortening its radius, the flat<br />
portion of the curve can be extended to much lower values of Reynolds’<br />
number. Hodgson19 early reduced the length of the throat<br />
cylinder and placed the throat taps a t the end of the curved portion<br />
of the approach curve to lengthen the flat portion of the<br />
coefficient curve. The shortening of the radius of the approach<br />
curve was used, e.g., in the German standard nozzles to lengthen<br />
the flat part of this curve, although such design also includes a<br />
lengthening of the nozzle throat to cause filling of the throat by<br />
the re-expansion of the contraction which follows the shorter approach<br />
radius.<br />
The writer has tried a num ber of different combinations of<br />
approach-curve radius, length of throat, and roughness, and has<br />
obtained a worth-while extension of the flat part of the curve for<br />
nozzles. Some of these nozzles were tested by the author and<br />
accepted with a 0.25 per cent accuracy guarantee, including their<br />
indicating, recording, and integrating instrum ents on a portion<br />
18 “Orifice Flow as Affected by Viscosity and Capillary,” by H. W.<br />
Swift, Philosophical Magazine, series 7, vol. 2, 1926, pp. 852-875;<br />
"Operational Factors in Orifice Flow,” vol. 6, 1928, pp. 1—17; “The<br />
Calibration of an Orifice,” vol. 8, 1929, pp. 409-435.<br />
18 “The Measurement of the Flow of Gases and Liquids by Means<br />
of Orifices, Noizles, and Venturi Tubes,” by J. L. Hodgson, World<br />
Engineering Congress, vol. 4, part 2, Tokio, 1929, p. 113, Fig. 10.<br />
of the flat part of the coefficient curve. This allowed 0.1 per cent<br />
full scale for the author’s calibration and installation effects and<br />
0.15 per cent for the instrum ent from maximum to less th an one<br />
half of the maximum (which corresponds to within 0.07 per cent<br />
of full scale). This accuracy was attained w ith stock instruments<br />
which were special mainly as to the spacing of the dial and<br />
chart graduations, working clearances and tolerances, and the<br />
setting a t the lowest operating rate. The performance of such<br />
instrum ents is fairly comparable w ith the 0.1 per cent of full scale<br />
reading reported w ith a recently developed, highly special instrum<br />
ent used in steam -turbine traverses. These instrum ents80<br />
also involved a cam and roller and an integrator wheel-on-a-disk.<br />
Since each diam eter-ratio of nozzle has a different “shape”<br />
and it seems necessary for the best shapes to be available to all,<br />
it is desirable for the A.S.M.E. Fluid M eters Committee to<br />
sponsor the necessary tests rather than th a t the best design become<br />
the property of any m anufacturer. For nozzles, the design<br />
would be essentially the same as for the venturi although<br />
the approach may possibly be cut off short of the throat cylinder,<br />
as suggested by W itte, so th a t a slightly conical throat m ay replace<br />
the cylindrical throat of the venturi.<br />
The writer referred his recommendations to the committee,<br />
several years before resigning from active work thereon, as a starting<br />
point toward such a design and then urged such action.<br />
The author’s paper revives the importance of a design which is<br />
free from even small errors due to the Goff effect. However, a<br />
design which is best for cold w ater under positive pressure m ay<br />
have a much shorter life th an the long-radius venturi or nozzle<br />
where cavitation exists.<br />
A u t h o r ’s C l o s u r e<br />
The w riter agrees w ith Professor Angus th a t the effect of ambient<br />
tem perature will vary w ith the size of the venturi meter.<br />
I t will also vary w ith th e design, paint, roughness, and insulation,<br />
if any.<br />
The 8 X 33A-in. bronze venturi m eter (coefficient 0.99),<br />
used in these experiments, although it is of the same proportions,<br />
is much smoother th an the fifty-seven cast-iron venturi m eters<br />
used as a basis for the A.S.M.E. curves, from which a value of<br />
0.983 would be obtained. Coefficients of rough venturi meters<br />
become flat a t much lower th ro at velocities. Coefficients of<br />
venturi m eters should not contain more th an three significant<br />
figures, although Prof. Angus uses four.<br />
Some idea of the “proper setup” m ay be obtained by reference<br />
to a previous paper21 by the author.<br />
The venturi m eter a t Toronto, which gave a coefficient of<br />
0.9545 instead of 0.9876 or 3.3 per cent low, was one of eleven<br />
meters. All the others gave satisfactory results, using the<br />
A.S.M.E. coefficient values (in which the author is not disinterested).<br />
Prof. Angus examined and calipered the m eter and<br />
found the pressure taps in good condition. Under these circumstances,<br />
the only thing which could lower the coefficient 3.3 per<br />
cent would be a vortex started in the centrifugal pump. T hat this<br />
could produce the result is evident from Fig. 44ss of the author’s<br />
previous paper. The author has found it advantageous in all<br />
cases where a vortex m ay form to use cross straightening vanes 4<br />
diam in length ahead of the venturi meter. U ntil this is done or<br />
an exploration made ahead of the Toronto meter, this m atter<br />
cannot be considered settled. The author cannot believe a 42<br />
20 “Automatic Integrating Pressure-Traverse Recorder for Study<br />
of Flow Phenomena in Steam-Turbine Nozzles and Buckets,” by<br />
H. Kraft and T. M. Berry, Trans. A.S.M.E., vol. 62, Aug., 1940, pp.<br />
479-488.<br />
51 “The Effect of Installation on the Coefficients of Venturi Meters,”<br />
by W. S. Pardoe, Trans. A.S.M.E., vol. 58, 1936, pp. 677-684.<br />
11 Reference (21), p. 683.
462 TRANSACTIONS OF T H E A.S.M.E. JULY, 1941<br />
X 27-in. venturi meter, correctly constructed and without<br />
vortex flow, could possibly give such a low coefficient.<br />
Mr. Borden suggests a great deal of additional experimental<br />
work. The author does not propose to do any beyond establishing<br />
the fact of an effect of ambient on the coefficients of flow<br />
meters generally.<br />
Mr. Smith has quite misinterpreted the paper and has forgotten<br />
our “bone of contention,” i.e., th a t Reynolds’ num ber is<br />
with Dr. Edgar Buckingham, sending him the original curves as<br />
obtained. He expressed the belief th at “we were leaving out some<br />
factor,” but at no time suggested heat transfer, nor did any other<br />
member of the Committee, although all of them were kept continually<br />
aware of the unsatisfactory results obtained with water.<br />
The effect is too complicated to evaluate from any reasonable<br />
number of experiments depending upon, as it does, the specific<br />
heats of the fluids, the design, the roughness, the materials of<br />
construction, the paint, the insulation, and probably other<br />
things. In other words, life is too short for this busy “hexagenarian”<br />
even to start.<br />
D uring the discussion of the paper, Messrs. Sprenkle, Beitler,<br />
and Bean suggested th at the flow nozzle was not affected by ambient<br />
tem perature. Herewith is shown test results of an A.S.M.E.<br />
flow nozzle 8; 300:1, Fig. 11, indicating th at they are not immune.<br />
Fig. 12, for an 8.071 X 3.875-in. orifice also shows th at it is<br />
affected in quite a similar manner, and not the reverse as suggested.<br />
The coefficient of a flowmeter m ay be expressed<br />
F i g . 11 E f f e c t o f A m b i e n t T e m p e r a t u r e o n C o e f f i c i e n t s f o r<br />
F l o w N o z z l e<br />
(A.S.M .E. flow nozzle 8:300:1; 8.071 X 3.0012 in.; temperature of water<br />
41 F; temperature of air 67.5 F.)<br />
in which<br />
k<br />
= coefficient of loss in hf — k Y l<br />
2(7<br />
a = ratio between actual kinetic energy per pound and kinetic<br />
energy per pound or V2/2 g<br />
Ot2 — 1.00<br />
If the main velocity traverse given by the seventh-root law for<br />
smooth pipe<br />
Pipe factor = 0.817<br />
F i g . 12 E f f e c t o f A m b i e n t T e m p e r a t u r e o n C o e f f i c i e n t s f o r<br />
P i p e O r i f i c e<br />
(Size 8.071 X 3.875 in.; temperature of water 44 F; temperature of air<br />
64 F.)<br />
not a satisfactory criterion for plotting the coefficients of venturi<br />
meters as usually constructed and installed, it cannot be used<br />
on the curved part of the coefficient curve, and has no meaning<br />
on the flat part. The errors inside the metering range of manufacturers’<br />
meters have already been mentioned and are considerable.<br />
The author now includes flow nozzles and pipe<br />
orifices as being similarly affected, as indicated by the curves in<br />
Figs. 11 and 12 of this closure. Mr. Smith will have to revise his<br />
ideas with respect to the orifice and also his very “rough” check of<br />
the Goff theory. He suggests th a t “it should not be difficult to<br />
get a few tem perature and pitot-tube traverses.” The author<br />
m ust disagree and believes this almost impossible as we are dealing<br />
not with the lam inar boundary layer but w ith the sublaminar<br />
boundary layer, at very low velocities. If Mr. Smith has in mind<br />
a pitot tube to measure the wall velocity (if any), there are many<br />
individuals who will be very much interested in learning of it.<br />
For a number of years, the author kept up a correspondence<br />
Take an 8.071 X 3.0012-in. flow nozzle a t 2 fps throat velocity<br />
Cd = 0.9662 box drained<br />
Co = 0.9606 box overflowing<br />
0 = 0.37184 /34 = 0.019118<br />
therefore<br />
is assumed constant as<br />
dv I velocity is constant, and<br />
dy | pipe factor = 1 approximately
PARDOE—EFFECT OF AM BIENT TEMPERATURES ON COEFFICIENTS OF VENTURI METERS 463<br />
and<br />
The corresponding temperature is 51 F, i.e., the inside wall of<br />
the flow nozzle would have to be 10 F above the water temperature.<br />
As the velocity at the wall is zero, this must be the water<br />
temperature at the wall. It does not seem that this is impossible<br />
with a temperature gradient of 67.5 — 41 or 26.5 F.<br />
Similar computations for other velocities are given in Table 1.<br />
That is, the difference in temperature between the water and<br />
the inside wall is inversely as the velocity, which seems quite<br />
reasonable.<br />
The author desires to thank those who participated in either the<br />
written or oral discussion. Many valuable suggestions were made<br />
TABLE l<br />
Throat velocity, Wall temperature, Wall temperature<br />
fps F —41 F<br />
1 52 11<br />
2 51 10<br />
3 50 9<br />
4 49.1 8.1<br />
5 48.1 7.1<br />
6 47 6<br />
8 44.8 3.8<br />
10 42.7 1.7<br />
as to how to proceed, and a tremendous amount of additional experimental<br />
work was outlined for the author, which he regrets<br />
he will be unable to do. He is not particularly concerned with the<br />
physicist’s explanation of the fact, but is tremendously concerned<br />
with the fact and how to get around it.