

YtDl2r
YtDl2r
YtDl2r

Create successful ePaper yourself
Turn your PDF publications into a flip-book with our unique Google optimized e-Paper software.
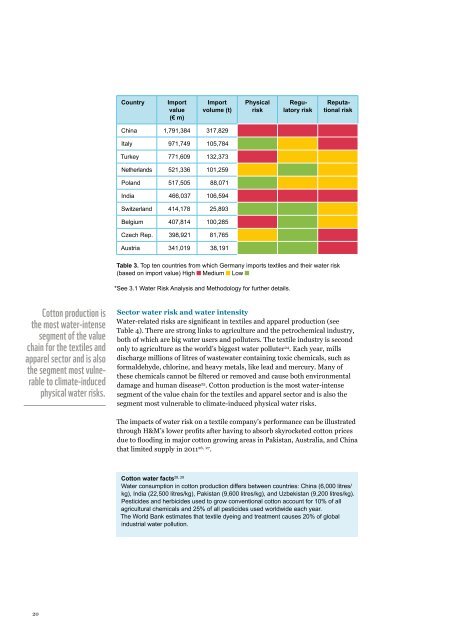
Country<br />
Import<br />
value<br />
(€ m)<br />
Import<br />
volume (t)<br />
Physical<br />
risk<br />
Regulatory<br />
risk<br />
Reputational<br />
risk<br />
China 1,791,384 317,829<br />
Italy 971,749 105,784<br />
Turkey 771,609 132,373<br />
Netherlands 521,336 101,259<br />
Poland 517,505 88,071<br />
India 466,037 106,594<br />
Switzerland 414,178 25,893<br />
Belgium 407,814 100,285<br />
Czech Rep. 398,921 81,765<br />
Austria 341,019 38,191<br />
Table 3. Top ten countries from which Germany imports textiles and their water risk<br />
(based on import value) High Medium Low<br />
*See 3.1 Water Risk Analysis and Methodology for further details.<br />
Cotton production is<br />
the most water-intense<br />
segment of the value<br />
chain for the textiles and<br />
apparel sector and is also<br />
the segment most vulnerable<br />
to climate-induced<br />
physical water risks.<br />
Sector water risk and water intensity<br />
Water-related risks are significant in textiles and apparel production (see<br />
Table 4). There are strong links to agriculture and the petrochemical industry,<br />
both of which are big water users and polluters. The textile industry is second<br />
only to agriculture as the world’s biggest water polluter 24 . Each year, mills<br />
discharge millions of litres of wastewater containing toxic chemicals, such as<br />
formaldehyde, chlorine, and heavy metals, like lead and mercury. Many of<br />
these chemicals cannot be filtered or removed and cause both environmental<br />
damage and human disease 25 . Cotton production is the most water-intense<br />
segment of the value chain for the textiles and apparel sector and is also the<br />
segment most vulnerable to climate-induced physical water risks.<br />
The impacts of water risk on a textile company’s performance can be illustrated<br />
through H&M’s lower profits after having to absorb skyrocketed cotton prices<br />
due to flooding in major cotton growing areas in Pakistan, Australia, and China<br />
that limited supply in 2011 26, 27 .<br />
28, 29<br />
Cotton water facts<br />
Water consumption in cotton production differs between countries: China (6,000 litres/<br />
kg), India (22,500 litres/kg), Pakistan (9,600 litres/kg), and Uzbekistan (9,200 litres/kg).<br />
Pesticides and herbicides used to grow conventional cotton account for 10% of all<br />
agricultural chemicals and 25% of all pesticides used worldwide each year.<br />
The World Bank estimates that textile dyeing and treatment causes 20% of global<br />
industrial water pollution.<br />
20