Appendix - North Kesteven District Council
Appendix - North Kesteven District Council
Appendix - North Kesteven District Council

Create successful ePaper yourself
Turn your PDF publications into a flip-book with our unique Google optimized e-Paper software.
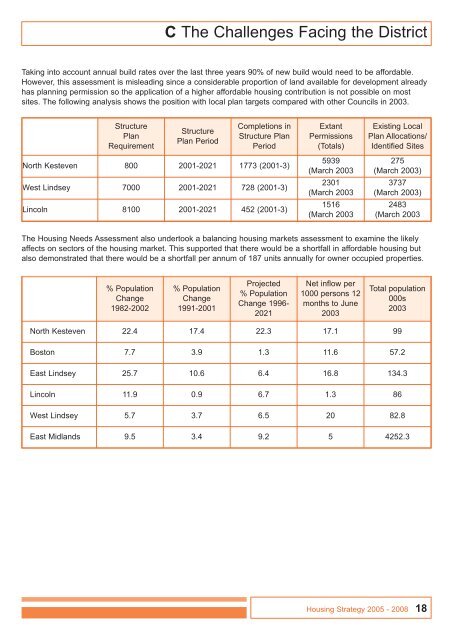
C The Challenges Facing the <strong>District</strong><br />
Taking into account annual build rates over the last three years 90% of new build would need to be affordable.<br />
However, this assessment is misleading since a considerable proportion of land available for development already<br />
has planning permission so the application of a higher affordable housing contribution is not possible on most<br />
sites. The following analysis shows the position with local plan targets compared with other <strong>Council</strong>s in 2003.<br />
Structure<br />
Plan<br />
Requirement<br />
Structure<br />
Plan Period<br />
Completions in<br />
Structure Plan<br />
Period<br />
Extant<br />
Permissions<br />
(Totals)<br />
Existing Local<br />
Plan Allocations/<br />
Identified Sites<br />
<strong>North</strong> <strong>Kesteven</strong> 800 2001-2021 1773 (2001-3)<br />
West Lindsey 7000 2001-2021 728 (2001-3)<br />
Lincoln 8100 2001-2021 452 (2001-3)<br />
5939<br />
(March 2003<br />
2301<br />
(March 2003<br />
1516<br />
(March 2003<br />
275<br />
(March 2003)<br />
3737<br />
(March 2003)<br />
2483<br />
(March 2003<br />
The Housing Needs Assessment also undertook a balancing housing markets assessment to examine the likely<br />
affects on sectors of the housing market. This supported that there would be a shortfall in affordable housing but<br />
also demonstrated that there would be a shortfall per annum of 187 units annually for owner occupied properties.<br />
% Population<br />
Change<br />
1982-2002<br />
% Population<br />
Change<br />
1991-2001<br />
Projected<br />
% Population<br />
Change 1996-<br />
2021<br />
Net inflow per<br />
1000 persons 12<br />
months to June<br />
2003<br />
Total population<br />
000s<br />
2003<br />
<strong>North</strong> <strong>Kesteven</strong> 22.4 17.4 22.3 17.1 99<br />
Boston 7.7 3.9 1.3 11.6 57.2<br />
East Lindsey 25.7 10.6 6.4 16.8 134.3<br />
Lincoln 11.9 0.9 6.7 1.3 86<br />
West Lindsey 5.7 3.7 6.5 20 82.8<br />
East Midlands 9.5 3.4 9.2 5 4252.3<br />
Housing Strategy 2005 - 2008 18