School Profile - Vicenza Elementary School - DoDEA
School Profile - Vicenza Elementary School - DoDEA
School Profile - Vicenza Elementary School - DoDEA

You also want an ePaper? Increase the reach of your titles
YUMPU automatically turns print PDFs into web optimized ePapers that Google loves.
1- Needs<br />
Additional<br />
Practice<br />
2-<br />
Approaches<br />
Standard<br />
3- Meets<br />
Standard<br />
4- Exceeds<br />
Standard<br />
Number of<br />
Students<br />
Number of Students<br />
1- Needs<br />
Additional<br />
Practice<br />
3- Meets<br />
Standard<br />
90<br />
80<br />
70<br />
60<br />
50<br />
40<br />
30<br />
20<br />
10<br />
0<br />
Fall Third Grade Math Results<br />
Boys<br />
Girls<br />
Total<br />
38 36<br />
18 20<br />
20<br />
16<br />
3 3<br />
6<br />
0 0 0<br />
1- Needs Additional 2- Approaches Standard 3- Meets Standard 4- Exceeds Standard<br />
Practice<br />
90<br />
80<br />
70<br />
60<br />
50<br />
40<br />
30<br />
20<br />
10<br />
0<br />
Spring Third Grade Math Results<br />
1<br />
0<br />
1<br />
1- Needs Additional<br />
Practice<br />
23<br />
10 13<br />
2- Approaches<br />
Standard<br />
15 18<br />
33<br />
6<br />
13<br />
7<br />
3- Meets Standard 4- Exceeds<br />
Standard<br />
Boys<br />
Girls<br />
Total<br />
40<br />
30<br />
20<br />
10<br />
0<br />
Third Grade Math<br />
Frequency Distribution<br />
Fall<br />
Spring<br />
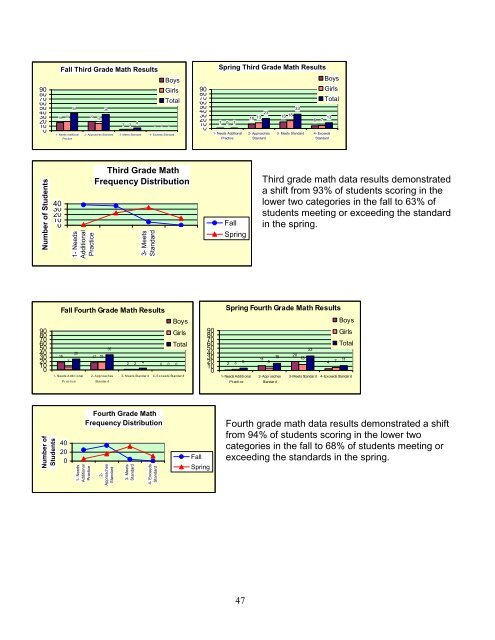
Third grade math data results demonstrated<br />
a shift from 93% of students scoring in the<br />
lower two categories in the fall to 63% of<br />
students meeting or exceeding the standard<br />
in the spring.<br />
90<br />
80<br />
70<br />
60<br />
50<br />
40<br />
30<br />
20<br />
10<br />
0<br />
Fall Fourth Grade Math Results<br />
Boys<br />
Girls<br />
35<br />
25<br />
18 17 18<br />
7<br />
2 2 4<br />
0 0<br />
Total<br />
1- Needs A ddi ti onal 2- A ppr oaches 3- M eets Standar d 4- E xceeds Standar d<br />
P r acti ce<br />
Standar d<br />
0<br />
90<br />
80<br />
70<br />
60<br />
50<br />
40<br />
30<br />
20<br />
10<br />
0<br />
Spring Fourth Grade Math Results<br />
16<br />
11<br />
2 3 5<br />
5<br />
1- Needs Additional<br />
Pr actice<br />
2- Appr oaches<br />
Standar d<br />
33<br />
20<br />
13<br />
4<br />
7<br />
Boys<br />
Girls<br />
Total<br />
11<br />
3- Meets Standar d 4- Exceeds Standar d<br />
40<br />
20<br />
0<br />
Fourth Grade Math<br />
Frequency Distribution<br />
Fall<br />
Spring<br />
Fourth grade math data results demonstrated a shift<br />
from 94% of students scoring in the lower two<br />
categories in the fall to 68% of students meeting or<br />
exceeding the standards in the spring.<br />
47