European small and mid caps-Stock picks Q4 2007-Q1 2008 - Fourlis
European small and mid caps-Stock picks Q4 2007-Q1 2008 - Fourlis
European small and mid caps-Stock picks Q4 2007-Q1 2008 - Fourlis

Create successful ePaper yourself
Turn your PDF publications into a flip-book with our unique Google optimized e-Paper software.
Mid cap<br />
<strong>European</strong> <strong>small</strong> <strong>and</strong> <strong>mid</strong> <strong>caps</strong><br />
abc<br />
Global Research<br />
<strong>Stock</strong> <strong>picks</strong><br />
<strong>Q4</strong> <strong>2007</strong>-<strong>Q1</strong> <strong>2008</strong><br />
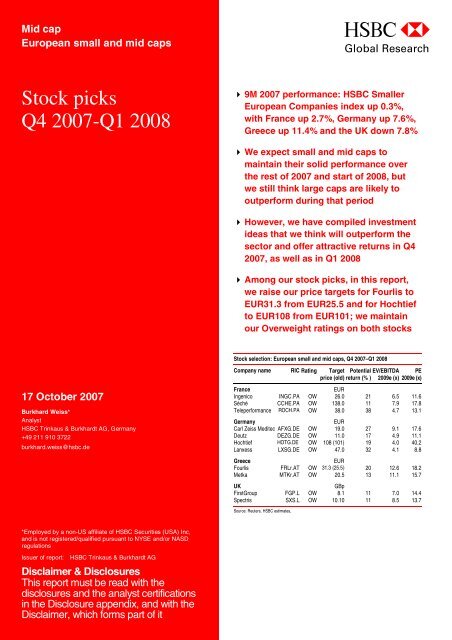
9M <strong>2007</strong> performance: HSBC Smaller<br />
<strong>European</strong> Companies index up 0.3%,<br />
with France up 2.7%, Germany up 7.6%,<br />
Greece up 11.4% <strong>and</strong> the UK down 7.8%<br />
We expect <strong>small</strong> <strong>and</strong> <strong>mid</strong> <strong>caps</strong> to<br />
maintain their solid performance over<br />
the rest of <strong>2007</strong> <strong>and</strong> start of <strong>2008</strong>, but<br />
we still think large <strong>caps</strong> are likely to<br />
outperform during that period<br />
However, we have compiled investment<br />
ideas that we think will outperform the<br />
sector <strong>and</strong> offer attractive returns in <strong>Q4</strong><br />
<strong>2007</strong>, as well as in <strong>Q1</strong> <strong>2008</strong><br />
Among our stock <strong>picks</strong>, in this report,<br />
we raise our price targets for <strong>Fourlis</strong> to<br />
EUR31.3 from EUR25.5 <strong>and</strong> for Hochtief<br />
to EUR108 from EUR101; we maintain<br />
our Overweight ratings on both stocks<br />
<strong>Stock</strong> selection: <strong>European</strong> <strong>small</strong> <strong>and</strong> <strong>mid</strong> <strong>caps</strong>, <strong>Q4</strong> <strong>2007</strong>–<strong>Q1</strong> <strong>2008</strong><br />
17 October <strong>2007</strong><br />
Burkhard Weiss*<br />
Analyst<br />
HSBC Trinkaus & Burkhardt AG, Germany<br />
+49 211 910 3722<br />
burkhard.weiss@hsbc.de<br />
Company name RIC Rating Target Potential<br />
price (old) return (% )<br />
EV/EBITDA<br />
2009e (x)<br />
PE<br />
2009e (x)<br />
France<br />
EUR<br />
Ingenico INGC.PA OW 26.0 21 6.5 11.6<br />
Séché CCHE.PA OW 138.0 11 7.9 17.8<br />
Teleperformance ROCH.PA OW 38.0 38 4.7 13.1<br />
Germany<br />
EUR<br />
Carl Zeiss Meditec AFXG.DE OW 19.0 27 9.1 17.6<br />
Deutz DEZG.DE OW 11.0 17 4.9 11.1<br />
Hochtief HOTG.DE OW 108 (101) 19 4.0 40.2<br />
Lanxess LXSG.DE OW 47.0 32 4.1 8.8<br />
Greece<br />
EUR<br />
<strong>Fourlis</strong> FRLr.AT OW 31.3 (25.5) 20 12.6 18.2<br />
Metka MTKr.AT OW 20.5 13 11.1 15.7<br />
UK<br />
GBp<br />
FirstGroup FGP.L OW 8.1 11 7.0 14.4<br />
Spectris SXS.L OW 10.10 11 8.5 13.7<br />
Source: Reuters, HSBC estimates,<br />
*Employed by a non-US affiliate of HSBC Securities (USA) Inc,<br />
<strong>and</strong> is not registered/qualified pursuant to NYSE <strong>and</strong>/or NASD<br />
regulations<br />
Issuer of report: HSBC Trinkaus & Burkhardt AG<br />
Disclaimer & Disclosures<br />
This report must be read with the<br />
disclosures <strong>and</strong> the analyst certifications<br />
in the Disclosure appendix, <strong>and</strong> with the<br />
Disclaimer, which forms part of it
Mid cap<br />
<strong>European</strong> <strong>small</strong> <strong>and</strong> <strong>mid</strong> <strong>caps</strong><br />
17 October <strong>2007</strong><br />
abc<br />
Contents<br />
<strong>Stock</strong>s can creep higher 3<br />
Regional focus: France 12<br />
Regional focus: Germany 14<br />
Regional focus: Greece 16<br />
Regional focus: UK 18<br />
<strong>European</strong> <strong>small</strong> <strong>and</strong> <strong>mid</strong>-cap<br />
stock <strong>picks</strong> for <strong>Q4</strong>/<strong>Q1</strong> 20<br />
Company profiles 23<br />
Carl Zeiss Meditec 24<br />
Deutz 28<br />
FirstGroup 33<br />
<strong>Fourlis</strong> Holdings 37<br />
Hochtief 41<br />
Ingenico 46<br />
Lanxess 51<br />
Metka 55<br />
Séché Environnement 59<br />
Spectris 64<br />
Teleperformance 68<br />
HSBC <strong>European</strong> <strong>small</strong> <strong>and</strong><br />
<strong>mid</strong>-cap coverage universe 73<br />
Notes 78<br />
Disclosure appendix 80<br />
Disclaimer 83<br />
2
Mid cap<br />
<strong>European</strong> <strong>small</strong> <strong>and</strong> <strong>mid</strong> <strong>caps</strong><br />
17 October <strong>2007</strong><br />
abc<br />
<strong>Stock</strong>s can creep higher<br />
We expect total returns from stocks to more than offset most<br />
estimates of equity risk over the rest of <strong>2007</strong> <strong>and</strong> into <strong>2008</strong><br />
In our opinion, <strong>European</strong> stocks are pricing in a bigger fall in<br />
profitability than is likely, particularly in the liquidity-strapped <strong>and</strong><br />
ABS-lashed financial arena<br />
Larger <strong>caps</strong> should continue to outperform over the remainder of<br />
<strong>2007</strong>; name of the game: stock picking for <strong>small</strong> <strong>and</strong> <strong>mid</strong> <strong>caps</strong><br />
Our HSBC Global Equity Strategy views are set out<br />
in more detail in ‘The End of the Beginning’,<br />
published 2 October <strong>2007</strong><br />
The easy stockmarket gains of 2003-06 are long<br />
since behind us. In our view, however, equities<br />
are still conservatively priced, many balance<br />
sheets are under-leveraged <strong>and</strong> ‘riskless’ interest<br />
rates are still low. We have been advocating a<br />
‘long-cycle’ view of the current equity rally – <strong>and</strong><br />
this summer arguably marks not the end of that<br />
cycle, nor the beginning of the end, but perhaps<br />
the end of the beginning...<br />
We think it boils down to whether the surge in<br />
corporate value added a<strong>mid</strong> the golden operating<br />
climate of the last 4-5 years – a surge which, in<br />
our view, has not been priced into stock<br />
valuations – has been driven primarily by cheap<br />
subprime US housing loans. And we doubt it.<br />
So what happened this summer? We did not expect<br />
the ABS story to play out as it did, but as the<br />
liquidity trap sprang <strong>and</strong> it became clear that central<br />
banks were indeed staring into the monetary abyss<br />
so we had to assume that they would do whatever<br />
was necessary to get the system moving again. As<br />
we write, three-month money rates are slowly<br />
returning to earth <strong>and</strong>, believe it or not, the MSCI<br />
All-Countries index is almost exactly where it was<br />
when we posted our Q3 preview, entitled Don’t look<br />
down, on 4 July <strong>2007</strong>.<br />
The risk of recession is, of course, still high. But<br />
there is also a more positive possibility out there,<br />
one we think is being overlooked <strong>and</strong> which we<br />
term the ‘1999 redux’ scenario. The possibility of<br />
such an outcome for us balances the more visible<br />
risk of a ‘nervous recession’ (for more detail, see<br />
Collateral damage, 22 August). We are also<br />
prepared to stick our necks out <strong>and</strong> suggest that the<br />
M&A boom is not yet done: cash-flow yields still<br />
comfortably exceed (slightly) higher credit costs.<br />
The outlook, then, remains one of ‘muddling<br />
through’, in which equity prices continue to creep<br />
higher, supported by continued modest earnings<br />
growth <strong>and</strong> some increase in PE multiples. We<br />
expect a total return on the main US <strong>and</strong> <strong>European</strong><br />
indices of 5-10% through year-end <strong>and</strong> pencil in a<br />
similar return for <strong>2008</strong>e.<br />
Kevin Gardiner*<br />
Head of Global Equity Strategy<br />
HSBC Bank plc (UK)<br />
+44 20 7991 6714<br />
kevin.gardiner@hsbcib.com<br />
3
Mid cap<br />
<strong>European</strong> <strong>small</strong> <strong>and</strong> <strong>mid</strong> <strong>caps</strong><br />
17 October <strong>2007</strong><br />
abc<br />
Estimated ex-ante US equity risk premium, %<br />
5<br />
4<br />
3<br />
2<br />
1<br />
86 87 88 89 90 91 92 93 94 95 96 97 98 99 00 01 02 03 04 05 06 07<br />
US Implied ERP Av erage +1 St. Dev -1 St. Dev<br />
Source: HSBC, Thomson Financial Datastream<br />
At the regional <strong>and</strong> sectoral levels, conviction has<br />
been in short supply over the course of <strong>2007</strong>, as<br />
we thought it might be. This is a reflection of<br />
several issues – M&A <strong>and</strong> infrastructure appeal,<br />
for example – that cut across conventional<br />
cyclical attributes.<br />
If anything, this lack of intra-market conviction<br />
has become even more pronounced as a result of<br />
the ABS <strong>and</strong> liquidity crises. Nonetheless, on a 3-<br />
6 month view, we have cut our cyclical positions<br />
<strong>and</strong> added to a mixture of technology <strong>and</strong> growthoriented<br />
sectors <strong>and</strong> regions, with the weak dollar<br />
making some degree of shift back into the US<br />
more favourable. We have trimmed our<br />
Overweight positions in Europe <strong>and</strong> emerging<br />
markets accordingly, though Europe remains our<br />
favourite among the larger blocs.<br />
One of those cross-market themes that we thought<br />
might make themselves felt in <strong>2007</strong> is size <strong>and</strong>,<br />
indeed, so far, this has been the case. Larger-cap<br />
companies are beginning to claw back some of the<br />
last few years’ underperformance. The turnaround is<br />
now clearly visible in price relative charts in the US<br />
<strong>and</strong> Europe <strong>and</strong> has been for some time in Japan.<br />
US <strong>and</strong> Europe trailing PE/economic value added (EVA) index (ROE/COE)<br />
30<br />
25<br />
20<br />
15<br />
10<br />
5<br />
80 81 82 83 84 85 86 87 88 89 90 91 92 93 94 95 96 97 98 99 00 01 02 03 04 05 06 07<br />
PE/EVA<br />
Source: HSBC, Thomson Financial Datastream<br />
4
Mid cap<br />
<strong>European</strong> <strong>small</strong> <strong>and</strong> <strong>mid</strong> <strong>caps</strong><br />
17 October <strong>2007</strong><br />
abc<br />
We expect large <strong>caps</strong> to continue to outperform.<br />
Larger companies tend to be less dependent on the<br />
vagaries of the business cycle, partly by virtue of<br />
their greater international diversification. They<br />
have stronger balance sheets <strong>and</strong> are likely to be<br />
relatively sheltered from any residual liquidity<br />
pressures. When M&A revives, we suspect its<br />
focus will shift upscale – partly because private<br />
equity may become a little less prominent <strong>and</strong><br />
partly because many of the potential targets in the<br />
<strong>small</strong>/<strong>mid</strong>-cap space have already been snapped<br />
up <strong>and</strong>/or have become too expensive. Recently,<br />
large <strong>caps</strong> have been trading more cheaply than<br />
<strong>small</strong> <strong>and</strong> <strong>mid</strong>-cap companies, both in terms of<br />
PEs <strong>and</strong> dividend yields.<br />
And not all large <strong>caps</strong> look equally attractive.<br />
Most utilities, for example, are large simply by<br />
virtue of their physical assets <strong>and</strong> their earnings<br />
are non-cyclical. However, for us, their earnings<br />
are too defensive, their balance sheets are not the<br />
strongest <strong>and</strong> there has already been a wave of<br />
consolidation in the sector, so we see less<br />
consolidation to look forward to. There are many<br />
<strong>small</strong> technology companies, for example, that we<br />
would buy ahead of larger utilities.<br />
Other things being equal, though, we think investors<br />
will continue to ‘think big’ over the course of the rest<br />
of <strong>2007</strong> <strong>and</strong> into <strong>2008</strong>.<br />
As with other intra-market themes, however, we<br />
do not expect size to prove overwhelmingly<br />
important: we simply expect <strong>small</strong>er-cap indices<br />
to rise less markedly than their large-cap peers.<br />
Some of the post-2000 outperformance by <strong>mid</strong> <strong>and</strong><br />
<strong>small</strong> <strong>caps</strong> has reflected a structural decision by<br />
many money managers to increase their exposure<br />
to what they see as relatively under-researched<br />
<strong>and</strong>, hence (arguably), less efficiently priced<br />
segments of the global market. Smaller <strong>caps</strong> –<br />
together with emerging markets, their regional<br />
equivalents, perhaps – have benefited accordingly.<br />
This shift is unlikely to be reversed any time soon,<br />
in our opinion.<br />
Price relatives: <strong>small</strong> & <strong>mid</strong> cap indices versus large <strong>caps</strong><br />
200<br />
160<br />
120<br />
80<br />
40<br />
97 98 99 00 01 02 03 04 05 06 07<br />
UK US Germany Japan<br />
PE relatives: <strong>small</strong> & <strong>mid</strong> cap indices versus large <strong>caps</strong><br />
180<br />
160<br />
140<br />
120<br />
100<br />
80<br />
60<br />
40<br />
97 98 99 00 01 02 03 04 05 06 07<br />
UK US Germany Japan<br />
Source: HSBC, Thomson Financial Datastream<br />
Source: HSBC, Thomson Financial Datastream<br />
5
Mid cap<br />
<strong>European</strong> <strong>small</strong> <strong>and</strong> <strong>mid</strong> <strong>caps</strong><br />
17 October <strong>2007</strong><br />
abc<br />
<strong>European</strong> indices: HSBC target prices<br />
Index Country/Type Price 30 Sep 07 Target 31 Dec 07e % potential<br />
CAC 40 France/Large cap 5,717 6200 8.5%<br />
DAX Germany/Large cap 7,862 8500 8.1%<br />
MDAX Germany/Mid cap 10,335 10500 1.6%<br />
FTSE100 UK/Large cap 6,467 7000 8.2%<br />
FTSE 250 UK/Mid cap 11,037 11850 7.4%<br />
Source: JCF, HSBC estimates<br />
Valuation <strong>and</strong> indices targets<br />
Europe remains our Global Equity Strategy<br />
team’s preferred region <strong>and</strong> Germany its preferred<br />
country (Overweight) within it. Europe is<br />
currently benefiting from strong global growth<br />
<strong>and</strong> the relatively cyclical nature of <strong>European</strong><br />
markets means they benefit more from this than<br />
most. This is even more true of Germany, which<br />
benefits strongly from Asian dem<strong>and</strong> for capital<br />
goods <strong>and</strong> which is also seeing the benefits of<br />
structural <strong>and</strong> corporate reforms in the form of<br />
renewed growth.<br />
We also Overweight the UK <strong>and</strong> Underweight<br />
France.<br />
One reason we do not expect <strong>small</strong>/<strong>mid</strong> <strong>caps</strong> to<br />
outperform large <strong>caps</strong> for the first time in many<br />
years is that valuations based on 12-month<br />
forward PEs have become more ambitious, as the<br />
table below indicates. More elevated multiples for<br />
<strong>small</strong>/<strong>mid</strong> <strong>caps</strong> are partly justified, in our view,<br />
because of their higher growth potential, as<br />
reflected by our EPS growth expectations.<br />
Nevertheless, we expect the large-cap indices to<br />
outperform the <strong>small</strong>/<strong>mid</strong>-cap ones.<br />
As a result, we more than ever, believe stock<br />
picking to be the way forward for the next quarter<br />
in order to maximise returns. As every time, there<br />
are still particular stocks, which we expect to have<br />
the potential to significantly st<strong>and</strong> out positively<br />
<strong>and</strong> show extraordinary performances.<br />
We would hereby focus on non-cyclical stocks,<br />
infrastructure plays, stocks with strong Asia<br />
exposure, construction plays. We would avoid if it<br />
is not a really strong story: real estate, financials,<br />
telco's, media. Focus is also on companies with<br />
healthy balance sheet structures <strong>and</strong> strong<br />
cash-flows.<br />
As a conclusion, while the valuation gap between<br />
<strong>small</strong>- <strong>and</strong> <strong>mid</strong>-<strong>caps</strong> <strong>and</strong> large <strong>caps</strong> seems partly<br />
justified by the higher earnings growth, we<br />
believe stock picking to be a paramount success<br />
factor especially for <strong>small</strong>/<strong>mid</strong>-<strong>caps</strong>.<br />
<strong>European</strong> indices: overview<br />
Index Country/Type % Change<br />
3M<br />
% Change<br />
6M<br />
% Change<br />
1Y<br />
Forward<br />
12M PE<br />
Forward<br />
12M P/B<br />
Net div<br />
yield <strong>2008</strong>e<br />
Forward EPS-CAGR<br />
12M ROE <strong>2007</strong>e-09e<br />
CAC 40 France/large cap -5.6% 1.4% 8.8% 12.3 x 1.9 x 3.4% 15.1% 8.3%<br />
CAC 100 France/<strong>mid</strong> cap -5.2% -1.0% 15.8% 16.3 x 1.9 x 2.5% 11.5% 13.9%<br />
DAX Germany/large cap -1.8% 11.0% 27.6% 12.7 x 1.8 x 3.1% 14.2% 13.0%<br />
MDAX Germany/<strong>mid</strong> cap -6.4% 0.0% 19.1% 14.6 x 2.1 x 2.2% 14.1% 16.6%<br />
FTSE100 UK/large cap -5.4% 0.0% 5.7% 12.1 x 2.3 x 3.7% 18.8% 5.1%<br />
FTSE 250 UK/<strong>mid</strong> cap -7.6% -8.5% 7.2% 13.8 x 2.4 x 2.9% 17.5% 9.3%<br />
Source: JCF consensus<br />
6
Mid cap<br />
<strong>European</strong> <strong>small</strong> <strong>and</strong> <strong>mid</strong> <strong>caps</strong><br />
17 October <strong>2007</strong><br />
abc<br />
Main movers - <strong>European</strong> <strong>small</strong> <strong>and</strong> <strong>mid</strong> <strong>caps</strong><br />
HSBC Smaller <strong>European</strong> Companies Index**: top performers 9M 07* HSBC Smaller <strong>European</strong> Companies Index: worst performers 9M 07*<br />
Top 50 companies Country Performance<br />
relative to index<br />
Top 50 companies Country Performance<br />
relative to index<br />
ROTH & RAU AG Germany +419.5 NORTHERN ROCK UK -85.5<br />
MANZ AUTOMATION AG Germany +384.2 VERBIO AG Germany -74.7<br />
ACOTEL GROUP S.P.A Italy +328.9 ASTROC MEDITERRANE Spain -74.2<br />
BETSSON AB Sweden +301.8 BANCA ITALEASE Italy -70.1<br />
MEYER BURGER TECHN Switzerl<strong>and</strong> +291.7 VUELING AIRLINES Spain -66.7<br />
SPRIDER SA Greece +241.4 AVIS EUROPE UK -58.0<br />
SOLON AG Germany +232.5 PARAGON GROUP OF COS UK -57.1<br />
TANFIELD UK +199.7 GPC BIOTECH Germany -56.1<br />
GPO SOARES DA COST Portugal +192.4 CENTRAL AFRICAN MI UK -55.5<br />
RECYLEX SA France +190.3 MCINERNEY HLDGS Irel<strong>and</strong> -54.8<br />
CLIMATE EXCHANGE UK +166.7 CAPITAL & REGIONAL UK -54.5<br />
NORDEX AG Germany +148.9 IKB DT INDUSTRIEBK Germany -53.1<br />
RUUKKI GROUP Finl<strong>and</strong> +136.5 INFOGRAMES ENTERTAIN France -53.0<br />
D/S NORDEN Denmark +130.4 PATRIZIA IMMO AG Germany -52.9<br />
VON ROLL BR Switzerl<strong>and</strong> +128.8 DEBENHAMS UK -52.6<br />
INTL FERRO METALS UK +126.0 SOITEC France -51.7<br />
KLOUKINAS-LAPPAS Greece +121.5 WOOLWORTHS GROUP UK -50.5<br />
OMX AB Sweden +117.6 MAPELEY UK -49.3<br />
OUTOTEC OYJ Finl<strong>and</strong> +115.7 MEINL EUROPEAN LAND Austria -49.1<br />
SOLAR MILLENNIUM Germany +114.3 DERICHEBOURG France -48.9<br />
SGL CARBON Germany +112.5 SAVILLS UK -48.5<br />
ANEK LINES Greece +112.2 RAYMARINE UK -48.4<br />
CORIN GROUP UK +108.4 FBD HDGS Irel<strong>and</strong> -47.3<br />
STRABAG Germany +107.4 MINERVA UK -46.7<br />
AIXTRON Germany +102.3 URBAS PROYEC URBAN Spain -46.1<br />
BEGHELLI Italy +101.3 DTZ HOLDINGS UK -46.0<br />
GILDEMEISTER Germany +100.7 REDROW UK -46.0<br />
VIVARTIA SA Greece +100.4 NIBE INDUSTRIER AB B Sweden -45.6<br />
ARQUES INDUSTRIES Germany +100.2 MICRONAS SEMICON REG Switzerl<strong>and</strong> -45.3<br />
ALAPIS S.A. Greece +99.9 BIOPETROL INDUSTRIES Germany -45.3<br />
BLOM Norway +95.9 PHOTO-ME INTL UK -45.0<br />
ROCKWOOL INTL B Denmark +92.4 TT ELECTRONICS UK -44.4<br />
LAVENDON GROUP UK +88.6 NORSKE SKOG Norway -43.5<br />
SCANA INDUSTRIER Norway +87.5 GAGFAH SA Germany -43.2<br />
BEIJER AB G & L 'B' Sweden +85.5 PENDRAGON UK -43.0<br />
UBISOFT ENTERTAIN France +85.3 MICRONIC LASER SYS Sweden -42.7<br />
DUCATI MOTOR HLDG Italy +85.2 BOVIS HOMES GROUP UK -42.4<br />
IRISH CONTINENTAL Irel<strong>and</strong> +83.2 TRANSCOM WRLD 'B'SDR Sweden -42.2<br />
DANIELI N/CV RISP Italy +82.2 TRANSCOM WRLD 'A'SDR Sweden -42.1<br />
CONSTR Y AUX FERRO Spain +80.8 LAVIPHARM Greece -41.7<br />
CARRARO SPA Italy +78.6 ADV DIGITAL BROAD Switzerl<strong>and</strong> -41.3<br />
TECNICAS REUNIDAS Spain +75.8 HOGG ROBINSON GRP UK -41.3<br />
NOKIAN RENKAAT OYJ Finl<strong>and</strong> +75.0 H & R WASAG Germany -40.6<br />
KEMIRA GROWHOW OYJ Finl<strong>and</strong> +74.9 ETAM DEVELOPPEMENT France -40.6<br />
SEVAN MARINE Norway +74.2 USG PEOPLE NV Netherl<strong>and</strong>s -40.3<br />
SENIOR UK +73.7 BUONGIORNO SPA Italy -40.0<br />
ODIM ASA Norway +72.2 BRIXTON UK -40.0<br />
EXPERT EILAG Norway +71.1 TECHNIKI OLYMPIAKI Greece -39.8<br />
IASO SA Greece +70.2 SONDAGSAVISEN Denmark -39.8<br />
SCHOELLER BLECKMAN Austria +69.9 SHAFTESBURY UK -39.7<br />
Source: HSBC; * (02.01.<strong>2007</strong> – 28.09.<strong>2007</strong>), **Bloomberg Index RIC: JCSCEURO Index<br />
7
Mid cap<br />
<strong>European</strong> <strong>small</strong> <strong>and</strong> <strong>mid</strong> <strong>caps</strong><br />
17 October <strong>2007</strong><br />
abc<br />
HSBC <strong>European</strong> Smaller <strong>European</strong> Companies Index: top 30 companies with highest dividend yield for <strong>2007</strong>e<br />
Company Country Share price (as of 30 September <strong>2007</strong>) (EUR) Dividend yield <strong>2007</strong>e<br />
Baader Wertpapierh<strong>and</strong>elsbank AG Germany 4.4 12.1%<br />
Acta Holding ASA Norway 3.2 11.5%<br />
Woolworths Group Great-Britain 0.3 10.0%<br />
Drax Group PLC Great-Britain 8.7 9.7%<br />
ABG Sundal Collier ASA Norway 1.9 9.5%<br />
Lloyd Fonds AG Germany 16.3 9.5%<br />
Mapeley Ltd. Great-Britain 30.2 9.5%<br />
Norske Skogindustrier ASA Norway 7.5 9.3%<br />
HCI Capital AG Germany 15.2 9.0%<br />
Axfood Ab Sweden 23.6 8.3%<br />
Cairo Communication SpA Italy 37.0 8.1%<br />
Chesnara Plc Great-Britain 2.5 8.1%<br />
Paragon Group Of Cies Great-Britain 4.3 8.0%<br />
MPC AG Germany 59.9 8.0%<br />
Vastned Offices Industrial Netherl<strong>and</strong>s 22.2 7.9%<br />
Bradford And Bingley Great-Britain 4.3 7.7%<br />
HQ AB Sweden 19.2 7.6%<br />
KappAhl Holding AB Sweden 7.4 7.5%<br />
Maurel Et Prom France 15.0 7.5%<br />
Deep Sea Supply ASA Norway 3.1 7.4%<br />
DAB Bank AG Germany 6.3 7.4%<br />
AWD Holding AG Germany 23.4 7.4%<br />
Sparebank 1 SR-Bank Norway 21.4 7.3%<br />
Pendragon Great-Britain 0.9 7.3%<br />
Electrocomponents Great-Britain 3.6 7.2%<br />
Note: * dividend <strong>2007</strong>e to be paid out in <strong>2008</strong><br />
Source: HSBC<br />
<strong>2007</strong>e dividend yield plays<br />
As many funds require a constant stream of cash<br />
flow without having to liquidate parts of their<br />
holdings, dividend yield is still a key decider<br />
when it comes to stock investment. Another<br />
element of investing in stocks with a high<br />
dividend yield is the ‘bird-in-the-h<strong>and</strong>’ theory,<br />
which dubs stocks with high yields preferable to<br />
those with lower yields (all else being equal).<br />
Note, though, that there are hardly any<br />
technology companies in our top 30. This is no<br />
surprise, however, as we expect companies with<br />
high growth potential to retain <strong>and</strong> reinvest<br />
profits rather than pay them out.<br />
From this perspective, German Baader<br />
Wertpapierh<strong>and</strong>els AG <strong>and</strong> Norwegian Acta<br />
Holding ASA appear to be the most attractive<br />
<strong>small</strong>- or <strong>mid</strong>-cap dividend stocks, with more<br />
than a 10% dividend yield (payable in <strong>2008</strong>e).<br />
In general, financial <strong>and</strong> financial-related stocks<br />
dominate our top 30 dividend yield list, not only<br />
because of their relatively low capital<br />
requirements, allowing them to pay out a large<br />
portion of their earnings, even in growth<br />
periods, but also because they suffered strongly<br />
during the recent market turmoil.<br />
8
Mid cap<br />
<strong>European</strong> <strong>small</strong> <strong>and</strong> <strong>mid</strong> <strong>caps</strong><br />
17 October <strong>2007</strong><br />
abc<br />
HSBC <strong>European</strong> <strong>small</strong> <strong>and</strong> <strong>mid</strong>-cap conferences in <strong>2007</strong>-08<br />
HSBC’s newly bolstered <strong>European</strong> <strong>small</strong> <strong>and</strong> <strong>mid</strong>-cap product will be represented at a number of<br />
interesting <strong>small</strong> <strong>and</strong> <strong>mid</strong>-cap conferences to be held in <strong>Q4</strong> <strong>2007</strong> <strong>and</strong> H1 <strong>2008</strong>:<br />
06 November <strong>2007</strong>, Paris, Hotel de Crillon - HSBC Leisure Conference<br />
28 November <strong>2007</strong>, London, Great Eastern Hotel - HSBC Small/Mid-Cap Healthcare Conference<br />
29 November <strong>2007</strong>, Paris, Hotel de Crillon - HSBC <strong>European</strong> Aerospace Conference<br />
28-29 January <strong>2008</strong>, Frankfurt, Hilton Hotel - HSBC Small <strong>and</strong> Mid-cap SRI Conference:<br />
‘Responsible growth – investments for the future’<br />
27-28 February <strong>2008</strong>, Frankfurt, Hilton Hotel - HSBC <strong>European</strong> Real Estate (TREC)<br />
08-09 April <strong>2008</strong>, Paris, HSBC Office – HSBC French Small <strong>and</strong> Mid-Cap Conference<br />
At our first HSBC Leisure Seminar on 6 November <strong>2007</strong> in Paris, we will present 12 selected <strong>European</strong><br />
<strong>small</strong> <strong>and</strong> <strong>mid</strong>-cap companies that we consider to be among the leaders in the leisure sector.<br />
Source: HSBC<br />
9
Mid cap<br />
<strong>European</strong> <strong>small</strong> <strong>and</strong> <strong>mid</strong> <strong>caps</strong><br />
17 October <strong>2007</strong><br />
abc<br />
At our HSBC Small <strong>and</strong> Mid-cap Healthcare Conference on 28 November <strong>2007</strong> in London, we will<br />
present 14 selected German <strong>and</strong> <strong>European</strong> <strong>small</strong> <strong>and</strong> <strong>mid</strong>-cap companies that we view as being among the<br />
leaders in their particular sectors.<br />
HSBC Small/Mid-Cap Healthcare Conference<br />
- save the date -<br />
London - 28 November <strong>2007</strong><br />
Great Eastern Hotel, Liverpool Street, London EC2M 7QN<br />
HSBC is pleased to announce that it will conduct a HSBC Healthcare Conference<br />
with leading German <strong>and</strong> selected <strong>European</strong> Small/Mid Cap stocks (companies see page 2) in London.<br />
Please SAVE THE DATE in your diary, a formal invitation will be sent to you shortly, accompanied<br />
by a detailed schedule.<br />
We will offer 1-1 meetings <strong>and</strong> <strong>small</strong> group meetings with the management of the attending<br />
companies <strong>and</strong> present a captivating key note speaker, who will be giving a sector related lunch speech.<br />
Anke Ohm<br />
Event Management – Institutional Clients<br />
Telephone: +49 (2 11) 9 10 25 44<br />
Fax: +49 (2 11) 32 61 19<br />
E-mail: anke.ohm@hsbc.de<br />
Source: HSBC<br />
HSBC Small/Mid-Cap Healthcare Conference<br />
LIST OF ATTENDING COMPANIES*:<br />
Germany:<br />
Curanum, Nursing, EUR203m<br />
Celesio, Wholesale/Pharmacies, EUR8.3bn<br />
Fresenius Medical Care, Medical Systems/Services, EUR11bn<br />
QIAGEN, Medtech/Diagnosis, EUR2.3bn<br />
Carl Zeiss Meditec, Medtech, EUR1.1bn<br />
Drägerwerk, Medtech, EUR866m<br />
Sartorius, Medtech, EUR743m<br />
STRATEC Biomedical, Medtech, EUR243m<br />
PULSION Medical Systems, Medtech, EUR51m<br />
CompuGROUP, Healthcare Equipment, EUR651m<br />
Greece:<br />
Lavipharm, Wholesale, EUR175m<br />
Switzerl<strong>and</strong>:<br />
Sonova (formerly Phonak), Hearing Systems, EUR4.5bn<br />
Nobel Biocare, Implants, EUR5.2bn<br />
UK:<br />
Vectura, Pharmaceuticals, EUR320m<br />
* Companies listed by Sector <strong>and</strong> Market Capitalization<br />
Source: HSBC<br />
10
Mid cap<br />
<strong>European</strong> <strong>small</strong> <strong>and</strong> <strong>mid</strong> <strong>caps</strong><br />
17 October <strong>2007</strong><br />
abc<br />
At our third HSBC Small <strong>and</strong> Mid-Cap SRI Conference on 28-29 January <strong>2008</strong> in Frankfurt, we will<br />
present 35 German <strong>and</strong> <strong>European</strong> <strong>small</strong>- <strong>and</strong> <strong>mid</strong>-cap companies that we believe to be among those<br />
companies leading the way in combining economic growth <strong>and</strong> shareholder value creation with a socially<br />
responsible business model <strong>and</strong> approach.<br />
3. HSBC Small / Mid Cap SRI-Conference<br />
- Responsible Growth – Investments for the Future -<br />
Please SAVE THE DATE in your diary!<br />
Frankfurt Main, 28 - 29 January <strong>2008</strong><br />
HSBC Trinkaus & Burkhardt cordially invites you to its<br />
Small / Mid Cap Socially Responsible Investment Conference.<br />
We will present Small / Mid cap companies, who are among those leading the way<br />
in combining economic growth <strong>and</strong> shareholder value creation with socially<br />
responsible business models <strong>and</strong> attitudes. (Please see planned participants page 2)<br />
Venue:<br />
Hilton Frankfurt<br />
Hochstrasse 4<br />
60313 Frankfurt<br />
Anke Ohm<br />
Event Management / Inst. Clients<br />
Telephone: +49 (2 11) 9 10 25 44<br />
Fax: +49 (2 11) 9 10 26 34<br />
E-mail:<br />
anke.ohm@hsbctrinkaus.de<br />
Source: HSBC<br />
PARTICIPATING COMPANIES<br />
(PRELIMINARY LIST)<br />
<strong>European</strong> companies (28 January, <strong>2008</strong>) German companies (29 January, <strong>2008</strong>)<br />
Abengoa<br />
Suzlon<br />
Agor<br />
Pfeiffer Vaccum<br />
Andritz<br />
Tomra<br />
Biogas Nord<br />
Phönix Sonnenstrom<br />
BDI<br />
Vectrix<br />
Biopetrol Industries<br />
Q-Cells<br />
BWT<br />
Veolia<br />
Centrosolar<br />
Rational<br />
Christ Water<br />
Vestas<br />
Centrotec<br />
REpower Systems<br />
Clipper Windpower<br />
Conergy<br />
Roth & Rau<br />
Energies Nouvelles / EdF<br />
CropEnergies<br />
Schmack Biogas<br />
Gamesa<br />
Deutz<br />
SGL Carbon<br />
Kingspan<br />
Envitec Biogas<br />
Smart Fuel Cells<br />
Lassila & Tikanoja<br />
Elring Klinger<br />
Solar Millenium<br />
MayrMelnhof<br />
EOP Biodiesel<br />
SolarWorld<br />
Meyer Burger Technology<br />
ErSol<br />
Solon<br />
NIBE<br />
Interseroh<br />
Steico<br />
Uralita<br />
K+S<br />
Techem<br />
PV Crystalox Solar<br />
Krones<br />
Verbio<br />
REC<br />
KWS Saat<br />
Wacker Chemie<br />
Rockwool<br />
Manz Automation<br />
Washtec<br />
Schulthess<br />
MAX Automation<br />
Seche Environnement<br />
MVV Energie<br />
Shanks<br />
Nordex<br />
SIG<br />
Petrotec<br />
Source: HSBC<br />
11
Mid cap<br />
<strong>European</strong> <strong>small</strong> <strong>and</strong> <strong>mid</strong> <strong>caps</strong><br />
17 October <strong>2007</strong><br />
abc<br />
Regional focus: France<br />
Growth gap between France <strong>and</strong> the Eurozone set to diminish<br />
France should hold up, in our opinion, thanks to the rebound in<br />
the automotive <strong>and</strong> aerospace industries<br />
Sarkozy’s fiscal plan should increase disposable income by<br />
€ € 13.7bn <strong>and</strong> benefit major firms in sectors employing large<br />
numbers of unskilled workers<br />
The macroeconomic view<br />
Weak industrial production was one of the main<br />
items that dragged down French economic growth<br />
last year, notably in the automotive sector. The<br />
situation has been improving since the beginning<br />
of <strong>2007</strong>, however, with the introduction of new<br />
car models in France. Furthermore, deliveries of<br />
the Airbus A380, the first of which is expected in<br />
October, should bolster exports. As a result of this<br />
counter-cyclical trend, along with favourable<br />
fiscal measures, we expect the French economy to<br />
exp<strong>and</strong> 1.8% in both <strong>2007</strong> <strong>and</strong> <strong>2008</strong>, despite what<br />
is likely to be slowing growth in the Eurozone.<br />
Tax breaks to prop up household<br />
spending<br />
The French economy is still being fuelled by<br />
consumer spending. Measures have been<br />
proposed to exempt overtime hours from income<br />
tax <strong>and</strong> social security levies, as well as to limit<br />
the tax burden, ie, income tax, wealth tax, local<br />
taxes, <strong>and</strong> social charges to a combined total of<br />
50% of income. According to our calculations,<br />
this should add 1.1 percentage point, or<br />
EUR13.7bn, to gross disposable income in <strong>2008</strong>.<br />
We expect such tax breaks, effective 1 October<br />
<strong>2007</strong>, to buoy consumer spending <strong>and</strong> offset any<br />
increase in the unemployment rate. The other<br />
facet of the tax package, which makes interest on<br />
new home loans deductible from income tax,<br />
should bolster the residential property market <strong>and</strong><br />
is tantamount to a 34bp decrease in interest rates.<br />
The labour-market reforms planned for <strong>2008</strong><br />
could limit the anticipated rise in the<br />
unemployment rate to 8.9%, from 8.6% currently.<br />
Growth should prove resistant to the<br />
impact of tighter monetary policy<br />
We expect household spending to be only slightly<br />
impacted by the tighter money supply, which we<br />
believe should be partially offset by the planned<br />
tax cuts. The expected slump in the housing<br />
market is likely to be delayed until tighter<br />
monetary policy pushes up interest rates on home<br />
loans by 34bp. Furthermore, a potential short term<br />
interest rate increase due to the financial turmoil<br />
will have little impact on households that have<br />
already borrowed. Debt-funded business<br />
investment could slow with a tightening of<br />
monetary policy. However, the French<br />
government has said it will seek to enact<br />
corporate tax reforms in <strong>2008</strong>, to complement the<br />
lowering of on-payroll costs.<br />
Pierre Bosset<br />
Head of Equity Research, France<br />
HSBC Bank plc<br />
+33 1 56 52 43 10<br />
pierre.bosset@hsbc.fr<br />
Mathilde Lemoine<br />
Economist<br />
HSBC France<br />
+33 1 40 70 32 66<br />
mathilde.lemoine@hsbc.fr<br />
12
Mid cap<br />
<strong>European</strong> <strong>small</strong> <strong>and</strong> <strong>mid</strong> <strong>caps</strong><br />
17 October <strong>2007</strong><br />
abc<br />
Main movers – French <strong>small</strong> <strong>and</strong> <strong>mid</strong> <strong>caps</strong><br />
HSBC Smaller <strong>European</strong> Comp index (France) – top performers*<br />
HSBC Smaller <strong>European</strong> Comp index (France) – worst performers*<br />
Top 10 companies Performance relative to index Top 10 companies Performance relative to index<br />
RECYLEX SA +190.3 INFOGRAMES ENTERTAIN -53.0<br />
UBISOFT ENTERTAIN +85.3 SOITEC -51.7<br />
AUDIKA +66.0 DERICHEBOURG -48.9<br />
SELOGER PROMESSES +65.3 ETAM DEVELOPPEMENT -40.6<br />
STALLERGENES +64.9 SPIR COMMUNICATION -35.8<br />
WAVECOM +55.3 NRJ GROUP -33.9<br />
VILMORIN CL & CIE +51.2 ARCHOS -33.8<br />
BUSINESS&DECISION +50.9 LACIE SA -32.8<br />
THEOLIA +50.6 AVENIR TELECOM -31.8<br />
COMPLETEL EUROPE N +48.6 ASSYSTEM -29.4<br />
Source: HSBC, *(02.01.<strong>2007</strong> – 28.09.<strong>2007</strong>) Source: HSBC, *(02.01.<strong>2007</strong> – 28.09.<strong>2007</strong>)<br />
HSBC Smaller <strong>European</strong> Companies index (all) versus HSBC<br />
Smaller <strong>European</strong> Companies index (France)<br />
CAC40 index versus CAC100 index <strong>and</strong> CAC 90 index (top<br />
190 French <strong>small</strong> <strong>and</strong> <strong>mid</strong>-cap stocks)<br />
114<br />
111<br />
108<br />
105<br />
102<br />
99<br />
96<br />
Jan-07 Mar-07 May -07 Jul-07 Sep-07<br />
HSBC Smaller <strong>European</strong> Companies HSBC Smaller <strong>European</strong> Companies (FRA)<br />
110<br />
105<br />
100<br />
95<br />
90<br />
Jan-07 Mar-07 May -07 Jul-07 Sep-07<br />
CAC 40 CAC 100 CAC 90<br />
Source: HSBC<br />
Source: Datastream<br />
HSBC Smaller <strong>European</strong> Companies Index (FR) – lowest PE<br />
HSBC Smaller <strong>European</strong> Companies Index (FR) – Highest <strong>2007</strong>e<br />
dividend yield (payable in <strong>2008</strong>)<br />
Top 10 companies Forward 12-month PE Top 10 companies Forward 12-month net dividend yield<br />
SCOR SA 7.7 x Maurel Et Prom 7.5%<br />
Rhodia SA 8.1 x Kaufman & Broad SA 5.5%<br />
Nexity 8.2 x Tour Eiffel 5.4%<br />
Montupet Sa 8.3 x M6 Metropole Television 5.3%<br />
Ims Int Met Serv 8.5 x Spir Communication SA 5.2%<br />
LACIE SA 9.0 x LACIE SA 4.9%<br />
Recylex SA 9.2 x SCOR SA 4.6%<br />
Groupe Crit SA 9.8 x Avenir Telecom 4.5%<br />
Steria (Groupe) 10.0 x Smtpc 4.4%<br />
Kaufman & Broad SA 10.1 x Montupet Sa 4.3%<br />
Source: HSBC, JCF<br />
Source: HSBC, JCF<br />
13
Mid cap<br />
<strong>European</strong> <strong>small</strong> <strong>and</strong> <strong>mid</strong> <strong>caps</strong><br />
17 October <strong>2007</strong><br />
abc<br />
Regional focus: Germany<br />
Robust German GDP growth expected on the back of healthy<br />
balance sheets<br />
Small <strong>and</strong> <strong>mid</strong> <strong>caps</strong> set to be potential beneficiaries of German<br />
corporate tax reform in <strong>2008</strong>e<br />
Falling unemployment rate should provide a boost to consumption<br />
Macroeconomic view<br />
Leading indicators for Germany suggest that the<br />
economic momentum being witnessed in <strong>2007</strong><br />
may be sustainable, as the outlook remains robust,<br />
with HSBC GDP growth forecasts now for an<br />
expansion of perhaps 3% y-o-y in <strong>2007</strong> <strong>and</strong> 2.2%<br />
in <strong>2008</strong>. Furthermore, private consumption,<br />
temporarily constrained by the VAT increase in<br />
January <strong>2007</strong>, is expected to regain strength in<br />
<strong>2008</strong> (1.5% y-o-y growth in <strong>2008</strong>e versus a 0.1%<br />
decline in <strong>2007</strong>e, we estimate). In addition,<br />
Germany’s exceptional credit discipline (solid<br />
balance sheets at German companies, <strong>and</strong> high<br />
household savings rate) gives the economy a<br />
comfortable buffer from potential liquidity<br />
crunches or increasing credit spreads.<br />
Corporate tax reform<br />
By <strong>2008</strong>, the tax burden on German companies<br />
should have been reduced to below 30% (from<br />
39% currently) in a bid to improve the country’s<br />
international competitiveness <strong>and</strong> make it more<br />
attractive to investors. The reduction in the total<br />
tax burden will stem largely from a planned<br />
reduction in corporate income tax from 25% to<br />
15%. This should result in higher reported net<br />
income <strong>and</strong>, hence, higher EPS. However, not all<br />
companies will benefit to the same extent from the<br />
reduction in income tax. As German companies<br />
that generate most of their revenues in Germany<br />
are set to benefit more than companies with a large<br />
proportion of revenues from abroad, we expect<br />
<strong>small</strong> <strong>and</strong> <strong>mid</strong>-cap firms to benefit more than, say,<br />
German blue chips (many of which generate most<br />
of their sales abroad).<br />
Declining unemployment rate<br />
Germany’s unemployment rate is falling, reaching<br />
a new low of 8.8% in September <strong>2007</strong>, down from<br />
10.1% just a year before. This <strong>and</strong> a corresponding<br />
drop in the savings rate (according to our<br />
economists) should support a more significant<br />
recovery in consumer spending than has<br />
materialised to date.<br />
We believe that this falling-savings-rate effect<br />
will start showing in H2 <strong>2007</strong>, but much more so<br />
in <strong>2008</strong>. This view is supported by the HDE, the<br />
umbrella association of German retailers. While<br />
the HDE sees little consumption recovery so far, it<br />
says momentum is improving. For H2, the HDE<br />
expects nominal market growth of 1.5% y-o-y,<br />
though it says its guidance could prove overly<br />
cautious if economic developments remain robust.<br />
Key contact for German stocks::<br />
Thomas Teetz<br />
Head of Equity Research,<br />
Germany<br />
HSBC Trinkaus & Burkhardt AG<br />
+49 211 910 2353<br />
thomas.teetz@hsbc.de<br />
Burkhard Weiss<br />
Product Coordinator S/M Cap<br />
Research<br />
HSBC Trinkaus & Burkhardt AG<br />
+49 211 910 3722<br />
burkhard.weiss@hsbc.de<br />
14
Mid cap<br />
<strong>European</strong> <strong>small</strong> <strong>and</strong> <strong>mid</strong> <strong>caps</strong><br />
17 October <strong>2007</strong><br />
abc<br />
Main movers – German <strong>small</strong> <strong>and</strong> <strong>mid</strong> <strong>caps</strong><br />
HSBC Smaller <strong>European</strong> Companies Index (GER) – top performers*<br />
HSBC Smaller <strong>European</strong> Companies Index (GER) – worst performers*<br />
Top 10 companies Performance relative to index Top 10 companies Performance relative to index<br />
ROTH & RAU AG +419.5 VERBIO AG -74.7<br />
MANZ AUTOMATION AG +384.2 GPC BIOTECH -56.1<br />
SOLON AG +232.5 IKB DT INDUSTRIEBK -53.1<br />
NORDEX AG +148.9 PATRIZIA IMMO AG -52.9<br />
SOLAR MILLENNIUM +114.3 BIOPETROL INDUSTRIES -45.3<br />
SGL CARBON +112.5 GAGFAH SA -43.2<br />
STRABAG +107.4 H & R WASAG -40.6<br />
AIXTRON +102.3 DEUTSCHE WOHNEN (BR) -38.5<br />
GILDEMEISTER +100.7 MLP AG -38.5<br />
ARQUES INDUSTRIES +100.2 BOEWE SYSTEC -35.3<br />
Source: HSBC, (02.01.<strong>2007</strong> – 28.09.<strong>2007</strong>) Source: HSBC, (02.01.<strong>2007</strong> – 28.09.<strong>2007</strong>)<br />
HSBC Smaller <strong>European</strong> Companies Index (all) versus HSBC<br />
Smaller <strong>European</strong> Companies Index (Germany)<br />
124<br />
DAX versus MidCap market index (Top 100 German <strong>small</strong><br />
<strong>and</strong> <strong>mid</strong>-cap stocks)<br />
125<br />
119<br />
120<br />
114<br />
115<br />
109<br />
104<br />
99<br />
94<br />
Jan-07 Mar-07 May -07 Jul-07 Sep-07<br />
110<br />
105<br />
100<br />
95<br />
Jan-07 Mar-07 May -07 Jul-07 Sep-07<br />
HSBC Smaller <strong>European</strong> Companies HSBC Smaller <strong>European</strong> Companies (GER )<br />
DAX 30<br />
MidCap market index<br />
Source: HSBC<br />
Source: Datastream<br />
HSBC Smaller <strong>European</strong> Companies Index (GER) – lowest PE<br />
Top 10 companies<br />
Forward 12-month<br />
PE<br />
HSBC Smaller <strong>European</strong> Companies Index (GER) – highest <strong>2007</strong>e<br />
dividend yield (payable in <strong>2008</strong>)<br />
Top 10 companies<br />
Forward 12-month net<br />
dividend yield<br />
ARQUES Industries AG 5.3 x Baader Wertpapierh<strong>and</strong>elsbank AG 12.1%<br />
Vivacon AG 6.1 x Lloyd Fonds AG 9.5%<br />
Baader Wertpapierh<strong>and</strong>elsbank AG 6.1 x HCI Capital AG 9.0%<br />
Indus Holding AG 7.7 x MPC (Munchmeyer Petersen Ca 8.0%<br />
Colonia Real Estate AG 7.9 x DAB Bank AG 7.3%<br />
WMF AG 8.9 x AWD Holding AG 7.4%<br />
Dyckerhoff AG 9.0 x WMF AG 6.8%<br />
Lloyd Fonds AG 9.0 x Telegate AG 6.6%<br />
HCI Capital AG 9.3 x MLP AG 5.8%<br />
Grammer AG 9.4 x ProSiebenSat.1 Media AG 5.6%<br />
Source: HSBC, JCF<br />
Source: HSBC, JCF<br />
15
Mid cap<br />
<strong>European</strong> <strong>small</strong> <strong>and</strong> <strong>mid</strong> <strong>caps</strong><br />
17 October <strong>2007</strong><br />
abc<br />
Regional focus: Greece<br />
Medium-term macroeconomic environment remains benign, with<br />
high real economic growth providing a boost to corporate profitability<br />
Liberalisation of the energy market is attracting investment from<br />
domestic <strong>and</strong> foreign players<br />
Greek companies’ exposure to central <strong>and</strong> southeastern Europe is<br />
growing rapidly<br />
Macroeconomic view<br />
The medium-term outlook for the Greek economy<br />
remains favourable, in our view. We expect real<br />
GDP growth of 4.1% in <strong>2007</strong> <strong>and</strong> 3.9% in <strong>2008</strong>,<br />
well above the EU 13 average (2.6% <strong>and</strong> 1.9% in<br />
<strong>2007</strong>e <strong>and</strong> <strong>2008</strong>e according to HSBC estimates).<br />
Economic growth should be underpinned, we<br />
believe, by (a) healthy private consumption (a<br />
function of robust real wage growth, employment<br />
gains <strong>and</strong> positive wealth effects on rising equity<br />
<strong>and</strong> real-estate markets), (b) a favourable policy<br />
mix, supported by accommodating monetary<br />
conditions, persisting rapid credit expansion to<br />
households <strong>and</strong> tax reform gains <strong>and</strong> (c) robust<br />
investment spending on continued inflows of EU<br />
funds, strong residential construction <strong>and</strong> a sharp<br />
pick-up in corporate investment (driven by low<br />
real lending rates, special incentives <strong>and</strong> increased<br />
private-sector participation in infrastructure<br />
spending through public-private partnerships).<br />
Energy market liberalisation<br />
Electricity dem<strong>and</strong> in Greece has grown by nearly<br />
50% over the past decade <strong>and</strong> is forecasted by<br />
HTSO (Hellenic Transmission system operator) to<br />
exp<strong>and</strong> by 3% pa through 2012 (<strong>and</strong> by 2.5%<br />
annually thereafter). Furthermore, electricity<br />
reserve margins remain very tight, while the<br />
country’s rich RES (renewable energy source)<br />
potential is largely unexploited. The benign sector<br />
outlook, coupled with the full liberalisation of the<br />
electricity market (as of July <strong>2007</strong>) <strong>and</strong> special<br />
incentives provided under the RES law, have<br />
attracted considerable investment from both<br />
Greek <strong>and</strong> large foreign groups. With the<br />
exception of Terna (TERr.AT), all other domestic<br />
players have formed strategic partnerships with<br />
large <strong>European</strong> utilities.<br />
Growing exposure to C&SEE<br />
The Greek corporate sector is committing more<br />
<strong>and</strong> more capital to exp<strong>and</strong>ing across central <strong>and</strong><br />
southeastern Europe, placing special emphasis on<br />
its neighbouring Balkan economies <strong>and</strong>, most<br />
recently, Turkey. Although domestic operations<br />
should remain the chief driver of corporate<br />
earnings for the majority of Greek <strong>small</strong> <strong>and</strong> <strong>mid</strong><br />
<strong>caps</strong>, increasing exposure to central <strong>and</strong><br />
southeastern Europe is a longer-duration theme,<br />
which, in our view, is certain to feature more <strong>and</strong><br />
more on investors’ radar screens going forward.<br />
By our estimates, c20% of our Greek <strong>small</strong> <strong>and</strong><br />
<strong>mid</strong>-cap universe’s earnings will come from this<br />
region in <strong>2008</strong>e.<br />
Key contact for Greece stocks:<br />
Joanna Telioudi<br />
Head of Equity Research, Greece<br />
HSBC Pantelakis Securities<br />
+30 210 696 5209<br />
joanna.telioudi@hsbc.gr<br />
16
Mid cap<br />
<strong>European</strong> <strong>small</strong> <strong>and</strong> <strong>mid</strong> <strong>caps</strong><br />
17 October <strong>2007</strong><br />
abc<br />
Main movers – Greece <strong>small</strong> <strong>and</strong> <strong>mid</strong> <strong>caps</strong><br />
HSBC Smaller <strong>European</strong> Comp index (Greece) – Top performers*<br />
HSBC Smaller <strong>European</strong> Comp index (Greece) – Worst performers*<br />
Top 10 companies Performance relative to index Top 10 companies Performance relative to index<br />
SPRIDER SA +241.4 LAVIPHARM -41.7<br />
KLOUKINAS-LAPPAS +121.5 TECHNIKI OLYMPIAKI -39.8<br />
ANEK LINES +112.2 GENIKI BANK SA -34.4<br />
VIVARTIA SA +100.4 ASPIS BANK -30.0<br />
ALAPIS S.A. +99.9 MARFIN EGNATIA BK -22.3<br />
IASO SA +70.2 HELLENIC DUTY FREE -22.1<br />
METKA +69.7 BABIS VOVOS SA -18.3<br />
HELLENIC EXCH SA HLD +63.9 ALUM CO OF GREECE -15.7<br />
FOURLIS +62.2 TITAN CEMENT PREF -14.9<br />
SIDENOR METAL PROC +61.5 GREEK POSTAL SAVIN -14.7<br />
Source: HSBC, *(02.01.<strong>2007</strong> – 28.09.<strong>2007</strong>) Source: HSBC, * (02.01.<strong>2007</strong> – 28.09.<strong>2007</strong>)<br />
HSBC Smaller <strong>European</strong> Companies Index (all) versus HSBC<br />
Smaller <strong>European</strong> Companies Index (Greece)<br />
115<br />
110<br />
105<br />
100<br />
95<br />
Jan-07 Mar-07 May -07 Jul-07 Sep-07<br />
HSBC Smaller <strong>European</strong> Companies<br />
HSBC Smaller <strong>European</strong> Companies (GRE)<br />
FTSE/ATHEX 20 (Greece blue-chip Index) versus FTSE/ATHEX<br />
40 <strong>and</strong> FTSE/ATHEX 140 (Top Greek <strong>small</strong> & <strong>mid</strong>-cap stocks)<br />
135<br />
130<br />
125<br />
120<br />
115<br />
110<br />
105<br />
100<br />
95<br />
Jan-07 Mar-07 May -07 Jul-07 Sep-07<br />
ATHEX 20 ATHEX 40 ATHEX 140<br />
Source: HSBC<br />
Source: Datastream<br />
HSBC Smaller <strong>European</strong> Comp index (GRE) – lowest PE<br />
Top 10 companies<br />
12-month forward<br />
PE<br />
HSBC Smaller <strong>European</strong> Comp index (GRE) – highest <strong>2007</strong>e<br />
dividend yield (payable in <strong>2008</strong>)<br />
Top 10 companies<br />
12-month forward net<br />
dividend yield<br />
Technical Olympic SA 3.8 x Motor Oil Hellas Corinth 6.8%<br />
Sidenor 8.5 x Hellenic Duty Free Shops SA 5.8%<br />
Aluminium Co Of Greece 8.6 x Heracles General Cement 5.8%<br />
I.Kloukinas-I.Lappas 8.7 x Aluminium Co Of Greece 5.6%<br />
Lamda Development SA 9.1 x Autohellas Hertz 5.0%<br />
Titan Cement 10.7 x Greek Postal Savings Bank SA 4.7%<br />
Autohellas Hertz 11.0 x Metka SA 4.3%<br />
Folli Follie SA 11.4 x Hellenic Petroleum Sa 3.8%<br />
Blue Star Maritime 11.5 x I.Kloukinas-I.Lappas 3.8%<br />
Babis Vovos Int 11.7 x Agricultural Bk Greece 3.6%<br />
Source: HSBC, JCF<br />
Source: HSBC, JCF<br />
17
Mid cap<br />
<strong>European</strong> <strong>small</strong> <strong>and</strong> <strong>mid</strong> <strong>caps</strong><br />
17 October <strong>2007</strong><br />
abc<br />
Regional focus: UK<br />
Substantial deterioration in consumer spending (HSBC expects<br />
consumer spending growth of only 0.8% in <strong>2008</strong>e)<br />
Rising inflation in non-discretionary household spending<br />
categories magnifies pressure on discretionary spending<br />
Housing to go from spending enabler to spending disabler<br />
Macroeconomic view<br />
HSBC recently lowered its estimate for UK<br />
consumer spending growth in <strong>2008</strong>e to only 0.8%<br />
<strong>and</strong> we do not expect an interest-rate cut until<br />
February <strong>2008</strong>. We have looked at the housing<br />
market’s grip on UK consumers, who have<br />
become too used to steady house-price inflation,<br />
which they have used as a proxy for saving. We<br />
believe that house-price declines will unnerve<br />
consumers’ propensity to spend. As for the<br />
pressures on household budgets, the<br />
incontrovertible conclusion is that inflation is<br />
rising on the non-discretionary side of household<br />
spending, which means even more pressure on the<br />
discretionary element, which fuels this sector.<br />
Food prices will be a particular pressure point.<br />
UK retailers head for troubled waters<br />
Equally worrying is the raft of cost pressures<br />
facing retailers <strong>and</strong> the possibility of adverse<br />
currency movements for a change. Retailers that<br />
have enjoyed (<strong>and</strong> continue to promise) gross<br />
margin expansion will be gasping for breath -<br />
clothing retailers are most exposed here, but gross<br />
margin optimism is also central to earnings<br />
growth expectations at, say, WH Smith (SMWH<br />
LN) <strong>and</strong> Home Retail (HOME LN). Therefore, we<br />
have recently cut our sales growth expectations<br />
for <strong>2008</strong>e for most of our UK retailing universe.<br />
Index view for UK market<br />
We held firm on our 7000 end-year FTSE 100<br />
index target throughout the July-August turmoil<br />
<strong>and</strong>, after the subsequent 700-point bounce, we<br />
see no reason to change it now. The reasons why<br />
we remain positive are also unchanged. Corporate<br />
profitability is as attractive as ever. The interestrate<br />
cycle appears to have peaked (certainly if rate<br />
expectations are any guide). And valuations,<br />
inexpensive even before the recent correction, in<br />
our view, look even more compelling now.<br />
Elsewhere, M&A activity may be down, but we<br />
think it’s far from out (trade buyers, petrodollarfinanced<br />
buyers <strong>and</strong> Asian FX reserve-financed<br />
buyers look likely c<strong>and</strong>idates to stimulate a reacceleration<br />
in activity going forward). In<br />
addition, pension funding levels, an ongoing<br />
concern for many, but not for us, are now moving<br />
sharply back into surplus. Within the broader UK<br />
market, we continue to prefer large <strong>caps</strong> over <strong>mid</strong><br />
<strong>and</strong> <strong>small</strong> <strong>caps</strong>. The large-cap theme appears to be<br />
gathering momentum. Since the start of the<br />
second quarter of this year, the FTSE 100 has<br />
outperformed the 250 by 7.5%.<br />
Key contact for UK stocks:<br />
David May<br />
Head of Equity Research, EMEA<br />
HSBC Bank plc<br />
+44 (0) 02079916781<br />
david.may@hsbcib.com<br />
Kevin Gardiner<br />
Head of Global Equity Strategy<br />
HSBC Bank plc (UK)<br />
+44 20 7991 6714<br />
kevin.gardiner@hsbcib.com<br />
18
Mid cap<br />
<strong>European</strong> <strong>small</strong> <strong>and</strong> <strong>mid</strong> <strong>caps</strong><br />
17 October <strong>2007</strong><br />
abc<br />
Main movers – UK <strong>small</strong> <strong>and</strong> <strong>mid</strong> <strong>caps</strong><br />
HSBC Smaller <strong>European</strong> Comp index (UK) – top performers*<br />
HSBC Smaller <strong>European</strong> Comp Index (UK) – worst performers*<br />
Top 10 companies Performance relative to index Top 10 companies Performance relative to index<br />
TANFIELD 199.7 NORTHERN ROCK -84.5<br />
CLIMATE EXCHANGE 166.7 AVIS EUROPE -58.0<br />
INTL FERRO METALS 126.0 PARAGON GROUP OF COS -57.1<br />
CORIN GROUP 108.3 CENTRAL AFRICAN MI -55.5<br />
LAVENDON GROUP 88.6 CAPITAL & REGIONAL -54.5<br />
SENIOR 73.7 DEBENHAMS -52.6<br />
AUTONOMY CORP 69.0 WOOLWORTHS GROUP -50.5<br />
AMEC 67.8 MAPELEY -49.3<br />
IMPERIAL ENERGY CO 66.4 SAVILLS -48.5<br />
GAME GROUP 61.4 RAYMARINE -48.4<br />
Source: HSBC, * (02.01.<strong>2007</strong> – 28.09.<strong>2007</strong>) Source: HSBC, * (02.01.<strong>2007</strong> – 28.09.<strong>2007</strong>)<br />
HSBC Smaller <strong>European</strong> Companies Index (all) versus HSBC<br />
Smaller <strong>European</strong> Companies Index (UK)<br />
FTSE100 versus FTSE350 (top 350 UK stocks)<br />
130<br />
110<br />
105<br />
100<br />
95<br />
90<br />
J an-07 Mar-07 M ay -07 Jul-07 Sep-07<br />
HSBC Smaller <strong>European</strong> Companies HSBC Sm aller <strong>European</strong> Companies (UK)<br />
125<br />
120<br />
115<br />
110<br />
105<br />
100<br />
95<br />
90<br />
Jan-07 Mar-07 May -07 Jul-07 Sep-07<br />
FTSE 100 FTSE 350<br />
Source: HSBC<br />
Source: Datastream<br />
HSBC Smaller <strong>European</strong> Companies Index (UK) – lowest PE<br />
HSBC Smaller <strong>European</strong> Companies Index (UK) – highest <strong>2007</strong>e<br />
dividend yield (payable in <strong>2008</strong>)<br />
Top 10 companies 12-month forward PE Top 10 companies 12-month forward net dividend yield<br />
RAB Capital Plc 8.4 x Woolworths Group 10.0%<br />
Johnson Service Group 8.5 x Drax Group PLC 9.7%<br />
Smiths News Plc 8.5 x Mapeley Ltd. 9.5%<br />
Pendragon 8.6 x Chesnara Plc 8.1%<br />
Brit Insurance Holdings 8.6 x Paragon Group Of Cies 8.0%<br />
Sports Direct International Plc 8.8 x Bradford And Bingley 7.7%<br />
Lupus Capital 8.8 x Pendragon 7.3%<br />
TT Electronics 8.9 x Electrocomponents 7.2%<br />
Johnston Press 9.0 x Provident Financial 7.1%<br />
SThree Plc 9.3 x Debenhams Plc 6.9%<br />
Source: HSBC, JCF<br />
Source: HSBC, JCF<br />
19
Mid cap<br />
<strong>European</strong> <strong>small</strong> <strong>and</strong> <strong>mid</strong> <strong>caps</strong><br />
17 October <strong>2007</strong><br />
abc<br />
<strong>European</strong> <strong>small</strong> <strong>and</strong> <strong>mid</strong>cap<br />
stock <strong>picks</strong> for <strong>Q4</strong>/<strong>Q1</strong><br />
Best ideas from our French<br />
universe<br />
Ingenico is one of the world’s leading providers of<br />
payment solutions. The company has built up its<br />
position by adopting an aggressive, but carefully<br />
targeted acquisition policy. In the years to come,<br />
the company should benefit by upgrading its<br />
installed networks to EMV (Europay-Mastercard-<br />
Visa st<strong>and</strong>ard) <strong>and</strong> the rollout of electronic<br />
payment projects in emerging markets. Moreover,<br />
Ingenico has announced that negotiations to acquire<br />
Sagem Monetel (Safran group) are in their<br />
advanced stages. We see this as a strong potential<br />
driver of further margin improvement <strong>and</strong> value<br />
creation. Hence, we maintain our Overweight<br />
rating <strong>and</strong> DCF-based target price of EUR26,<br />
implying potential return of 21%.<br />
Séché Environnement is the third-largest player<br />
in waste management in France, far behind Suez<br />
<strong>and</strong> Véolia Environnement. Because of its <strong>small</strong>er<br />
size <strong>and</strong> more pure-play positioning, the company<br />
has been able to maintain sustained organic<br />
growth for the last 10 years (6-8% on average). Its<br />
recent acquisition of 33% of water management<br />
company Saur underpins the group’s aim to<br />
become a multi-services company. With this<br />
transaction, Séché should become the third-largest<br />
multi-utility player in France. We expect Séché to<br />
continue to benefit from a increasingly favourable<br />
regulatory environment <strong>and</strong> its ability to boost<br />
treatment capacity at a steady pace. We rate the<br />
stock Overweight, with a DCF-based target price<br />
of EUR138, implying 11% potential return.<br />
Teleperformance is a leading player in the<br />
outsourced call-centre market, ranked No.2 in the<br />
world after Convergys (United States). The group<br />
has increased its market share (3.2% calculated on<br />
2006 sales) with average organic growth of 9.5%<br />
pa over the past six years versus only 7.0% for the<br />
market. The company’s strong organic growth is<br />
combined with an active external growth policy,<br />
aimed at improving the group's geographic grid<br />
<strong>and</strong> presence in countries targeted for strategic<br />
expansion (the US, the UK, France <strong>and</strong><br />
Germany). After the capital increase in November<br />
2006 (EUR260m) <strong>and</strong> external growth, paid for in<br />
cash, the resulting financial leverage on the<br />
balance sheet is the main value driver for the<br />
company, in our view. Our DCF-based target<br />
price of EUR38 implies a potential return of 38%<br />
<strong>and</strong> justifies our Overweight rating.<br />
Best ideas from our German<br />
universe<br />
Carl Zeiss Meditec is a supplier of medical<br />
devices <strong>and</strong> services in the ophthalmology <strong>and</strong><br />
neuro/ENT-surgery business. With the recent<br />
acquisitions of Carl Zeiss Surgical, IOL Tech <strong>and</strong><br />
AcriTech, Carl Zeiss Meditec has widened its<br />
product portfolio in these areas. We see the high<br />
proportion of R&D expenses <strong>and</strong> the further<br />
development of the group’s sales network as<br />
supportive to the company’s further growth.<br />
20
Mid cap<br />
<strong>European</strong> <strong>small</strong> <strong>and</strong> <strong>mid</strong> <strong>caps</strong><br />
17 October <strong>2007</strong><br />
abc<br />
Based on our DCF model, we derive a target price<br />
of EUR19 <strong>and</strong> rate the stock Overweight,<br />
implying 27% potential return.<br />
Deutz is an independent manufacturer of diesel<br />
<strong>and</strong> gas engines, with a highly recognised br<strong>and</strong><br />
image. Following several years of restructuring,<br />
with a successful turnaround in 2002 <strong>and</strong> the<br />
recent disposal of the power systems division, the<br />
focus is now on the expansion of its compact<br />
engines division. We expect Deutz to outperform<br />
the market in terms of growth rates until 2009e<br />
driven by rising captive production volumes. Our<br />
DCF-based target price of EUR11 implies<br />
potential return of about 17% on a 12-month<br />
horizon. As our Neutral b<strong>and</strong> for non-volatile<br />
German stocks is 3.9-13.9%, we have an<br />
Overweight rating on the stock.<br />
Hochtief is a Germany-based construction service<br />
company, with a wide global offering: planning,<br />
financing, building <strong>and</strong> operating facilities. With its<br />
recent acquisition of aurelis (real-estate subsidiary<br />
of Deutsche Bahn), Hochtief gained access to a<br />
broad strategic platform from which it should gain<br />
access to project development <strong>and</strong> assetmanagement<br />
know-how. Moreover, we view<br />
Hochtief as being well positioned to benefit from<br />
the increasing market dem<strong>and</strong> for complex<br />
infrastructure <strong>and</strong> building projects, not only in<br />
emerging regions but also in developed countries<br />
(PPP, facilities management, project development).<br />
Our sum-of-the-parts valuation yields a fair value<br />
of EUR108 (up from EUR101 previously),<br />
implying potential return of 19% from the current<br />
share price. We rate the stock Overweight.<br />
Lanxess is a Germany-based global chemicals<br />
company with a broad portfolio of basic to fine<br />
chemicals <strong>and</strong> is among Europe’s major producers<br />
of chemical <strong>and</strong> polymer products. Lanxess has<br />
been transformed in record time from a merely<br />
profitable restructuring case into a ‘normal’<br />
specialty chemicals group, which is now on a<br />
profitability par with its <strong>European</strong> peers.<br />
However, the market still assigns a significant<br />
discount to Lanxess, of more than 20% based on<br />
<strong>2008</strong>-09e PE <strong>and</strong> EV/EBITDA multiples. As we<br />
do not see this discount as justified, we reiterate<br />
our Overweight rating on the stock, as well as our<br />
target price of EUR47, which implies a potential<br />
return of c32%.<br />
Best ideas from our Greek<br />
universe<br />
<strong>Fourlis</strong> Holdings is a holding company<br />
consisting of three main divisions: IKEA home<br />
furniture, Intersport sportswear retail <strong>and</strong> the<br />
wholesaling of electrical goods, with powerful<br />
br<strong>and</strong>s like Samsung <strong>and</strong> GE. The exclusive <strong>and</strong><br />
lucrative long-term IKEA franchise for Greece,<br />
Cyprus <strong>and</strong> Bulgaria is the company’s key asset.<br />
Moreover, <strong>Fourlis</strong> Holdings st<strong>and</strong>s to gain from<br />
the positive momentum of the exclusive Intersport<br />
franchise, which we believe is well placed to<br />
become one of the largest sportswear apparel<br />
retail chains in southeast Europe. We expect EPS<br />
CAGR of 42% for 2006-09e, primarily driven by<br />
new IKEA store rollouts. Based on our sum-ofthe-parts<br />
valuation, we reiterate our Overweight<br />
rating on the stock <strong>and</strong> raise our target price to<br />
EUR31.3 (from EUR25.5), implying 20%<br />
potential return.<br />
Metka is the leading electromechanical <strong>and</strong> metal<br />
construction company in Greece, actively engaged<br />
in the energy, defence <strong>and</strong> infrastructure sectors.<br />
Because of its excellent track record <strong>and</strong> expertise<br />
in energy projects, we are confident that Metka will<br />
be a major beneficiary of the upcoming<br />
liberalisation of the domestic energy market. In<br />
addition, cooperation agreements with Endesa,<br />
Helllenic Technodomiki <strong>and</strong> Alstom should provide<br />
a steady flow of business, in our view. We rate the<br />
stock Overweight, with a DCF-based target price of<br />
EUR20.5, implying 13% potential return.<br />
21
Mid cap<br />
<strong>European</strong> <strong>small</strong> <strong>and</strong> <strong>mid</strong> <strong>caps</strong><br />
17 October <strong>2007</strong><br />
abc<br />
Best ideas from our UK<br />
universe<br />
First Group is the UK’s largest bus operator<br />
(fourth-largest in London), with approximately<br />
9,000 buses, carrying 2.9m passengers every day. It<br />
is also the UK’s largest passenger rail franchise<br />
operator, with four franchises, one open access<br />
service <strong>and</strong> GB Railfreight. In North America, the<br />
combined First Student <strong>and</strong> Laidlaw business is c5x<br />
the size of its nearest competitor. As management<br />
recently confirmed the Laidlaw acquisition, our<br />
attention now turns to the integration process. We<br />
believe that there is still upside potential to<br />
synergies guidance. In our view, the market is still<br />
underestimating the value of Laidlaw <strong>and</strong> we<br />
remain Overweight, with an 810p target price based<br />
on our DCF sum-of-the-parts valuation, implying<br />
11% potential return.<br />
Spectris is involved in the development <strong>and</strong><br />
manufacture of a range of precision testing <strong>and</strong><br />
inspection instrumentation <strong>and</strong> control equipment<br />
which assists customers in improving the<br />
efficiency, quality <strong>and</strong> cost effectiveness of their<br />
production process. It is currently benefiting from<br />
a strong industrial backdrop in emerging<br />
economies, combined with buoyant market<br />
conditions in Europe; together these areas account<br />
for nearly two-thirds of group sales. In our view,<br />
Spectris shares remain inexpensive, trading on<br />
14.3x <strong>2008</strong>e EPS. This is a 5% valuation premium<br />
to its UK sector peers, but a 30% discount to its<br />
major US peer group. Our 1010p target price<br />
stems from our market-assessed cost of capitalbased<br />
valuation methodology. This implies<br />
potential return of 11% from the current share<br />
price, <strong>and</strong> our rating is Overweight.<br />
22
Mid cap<br />
<strong>European</strong> <strong>small</strong> <strong>and</strong> <strong>mid</strong> <strong>caps</strong><br />
17 October <strong>2007</strong><br />
abc<br />
Company profiles<br />
23
Mid cap<br />
<strong>European</strong> <strong>small</strong> <strong>and</strong> <strong>mid</strong> <strong>caps</strong><br />
17 October <strong>2007</strong><br />
abc<br />
Carl Zeiss Meditec<br />
Leading position in the medical devices <strong>and</strong> service market for<br />
ophthalmology <strong>and</strong> neuro/ENT surgery<br />
Recent AcriTec acquisition to strengthen IOL business<br />
Promising product launches should reanimate organic growth; TP<br />
EUR19, Overweight<br />
Investment summary<br />
Based in Germany, Carl Zeiss Meditech (CZM) is<br />
a globally operating specialist of integrated<br />
medical solutions. After recent acquisitions, it<br />
now focuses on four main divisions: in the<br />
ophthalmology field it has diagnosis <strong>and</strong> laser <strong>and</strong><br />
intraocular lenses (IOL) divisions; the other two<br />
divisions are neuro/ear, nose <strong>and</strong> throat (ENT)<br />
surgery <strong>and</strong> services. Regarding the nature of the<br />
addressed symptoms <strong>and</strong> diseases, demographic<br />
trends signal growing dem<strong>and</strong> for their respective<br />
treatments (eg, by the age of 80, c50% of all<br />
Americans suffer from cataracts, the most<br />
common cause of blindness).<br />
The company is operating in a very dynamic market.<br />
Owing to constantly improving technologies,<br />
diseases that were long inoperable can now be<br />
addressed <strong>and</strong> treated, generating strong growth<br />
opportunities. We expect the completed acquisitions<br />
of IOLtech, Carl Zeiss Surgical <strong>and</strong>, most recently,<br />
Acri.Tec will enable CZM to provide an enhanced<br />
product portfolio to clients. Moreover, we think the<br />
Acri.Tec acquisition should allow CZM to generate<br />
synergies at the cost <strong>and</strong> revenue levels.<br />
FY2006/9M <strong>2007</strong> results…<br />
The 9M figures (FY 2006/07) were strong, but<br />
slightly disappointed our bullish expectations. Sales<br />
were up 45.6% y-o-y (c52% excluding exchange<br />
rate effects) to EUR417.6m, mainly driven by the<br />
recent acquisitions. EBIT increased by 39% to<br />
EUR48.7.1m, representing an 11.7% EBIT margin.<br />
However, organic growth amounted to 7.4% in 9M<br />
2006/07, which is in line with the overall respective<br />
market. Following the 9M results, we slightly<br />
adjusted our top-line expectations for 2006/07e (-<br />
2%). Our new full-year figures see organic growth<br />
rising to 13.3%, mainly driven by the promising<br />
product launches in November <strong>2007</strong> of Cirrus<br />
OCT TM , VisuMax, new IOL lenses.<br />
Key facts ___________________ Financial summary ____________________ ___________Valuation summary____________<br />
Analyst: Christian Packebusch<br />
Year to Revenue EBITDA HSBC HSBC HSBC Yield HSBC EV/ EV/ IC ROIC HSBC<br />
Tel: +49 211 910 2446<br />
(EURm) (EURm) net profit EPS EPS growth (%) PE EBITDA (x) (%) REP<br />
Email: christian.packebusch@hsbc.de<br />
(EURm) (EUR)<br />
(%)<br />
(x) (x)<br />
(x)<br />
Current price (EUR) 15.0 9/2006a 390.6 58.9 26.7 0.33 55.7 0.9 45.7 21.2 4.3 12.0 3.1<br />
Target price (EUR) 19.00 9/<strong>2007</strong>e 581.6 80.3 46.6 0.57 74.6 1.1 26.2 13.3 3.3 14.2 1.9<br />
Mkt cap (EURm) 1,218.8 9/<strong>2008</strong>e 659.0 98.3 57.4 0.71 23.3 1.4 21.2 10.7 2.9 16.0 1.5<br />
Bloomberg AFX GR 9/2009e 730.0 113.9 69.3 0.85 20.6 1.7 17.6 9.1 2.6 17.2 1.3<br />
Reuters<br />
AFXG.DE<br />
Source: company data, HSBC estimates<br />
24
Mid cap<br />
<strong>European</strong> <strong>small</strong> <strong>and</strong> <strong>mid</strong> <strong>caps</strong><br />
17 October <strong>2007</strong><br />
abc<br />
Organisational structure<br />
Carl Zeiss Meditec<br />
Diagnosis<br />
Laser <strong>and</strong> IOL<br />
Neuro / ENT<br />
Services<br />
Primary sales drivers:<br />
diagnostic systems Stratus<br />
OCT , IOL Master<br />
Launch of Cirrus OCT in<br />
November should trigger sales<br />
<br />
Positive growth in laser<br />
business not compensating<br />
negative growth in IOL<br />
business in 9M 06/07 due to<br />
product portfolio streamlining<br />
<strong>and</strong> platform changes<br />
<br />
<br />
Consolidation of Carl Zeiss<br />
Surgical major sales driver in<br />
FY2006/<strong>2007</strong>e<br />
Primary sales drivers: surgical<br />
microscopes OPMI ® Pentero ®<br />
<strong>and</strong> OPMI ® Vario<br />
<br />
Services include installation of<br />
instruments <strong>and</strong> systems,<br />
maintenance ex service<br />
agreements <strong>and</strong> guarantees as<br />
well as IT services.<br />
54% of sales in 9M FY 2006/07 18% of sales in 9M FY 2006/07<br />
19% of sales in 9M FY 2006/07<br />
9% of sales in 9M FY 2006/07<br />
Source: Carl Zeiss Meditec, HSBC<br />
Company profile – at a glance<br />
Carl Zeiss Meditec has a leading position in the<br />
global market for ophthalmology devices <strong>and</strong><br />
systems. External growth, ie, the acquisition of Carl<br />
Zeiss Surgical, also gives the company premium<br />
access to neuro/ENT surgery. Non-organic growth<br />
contributed c84% of the 45.6% revenue growth in<br />
the first nine months of FY 2006/07.<br />
Following the recent acquisitions, Carl Zeiss<br />
Meditec now operates in four business segments:<br />
diagnosis; neuro/ENT; laser <strong>and</strong> IOL; <strong>and</strong> service.<br />
The company develops, manufactures, <strong>and</strong><br />
distributes devices <strong>and</strong> integrated medical<br />
solutions for the diagnosis, disease management,<br />
treatment <strong>and</strong> aftercare of the four main<br />
ophthalmic disorders: vision defects, cataracts,<br />
glaucoma <strong>and</strong> retinal disorders. In the neuro/ENT<br />
market, the company focuses on surgical<br />
microscopes <strong>and</strong> other digital visualisation<br />
solutions for surgical <strong>and</strong> dental applications.<br />
Carl Zeiss Meditec is regionally diversified, with<br />
subsidiaries in North America, France, Japan <strong>and</strong><br />
Spain, <strong>and</strong> employs more than 1,900 people<br />
worldwide. The company has production facilities in<br />
Germany, California <strong>and</strong> France. The Americas,<br />
including the US, continues to be the company’s<br />
main sales generator. Sales in this region have risen<br />
by +39% to EUR176.5m in 9M FY 2006/07.<br />
Shareholder structure<br />
As of 31 July <strong>2007</strong>, Carl Zeiss Group was the main<br />
shareholder, with a 65% stake. The remaining 35%<br />
were free float in the German TecDax Index, of<br />
which 70% is held by institutionals.<br />
Carl Zeiss Meditec - Sales by division 9M 2006/07 Carl Zeiss Meditec - Sales by region 9M 2006/07<br />
Serv ice<br />
Asia/Pacific<br />
Germany<br />
9%<br />
21%<br />
7%<br />
EMEA<br />
Neuro/ENT<br />
(ex GER)<br />
19%<br />
31%<br />
Diagnosis<br />
54%<br />
Laser/IOL<br />
18%<br />
Am ericas<br />
41%<br />
Source: Carl Zeiss Meditec, HSBC<br />
Source: Carl Zeiss Meditec, HSBC<br />
25
Mid cap<br />
<strong>European</strong> <strong>small</strong> <strong>and</strong> <strong>mid</strong> <strong>caps</strong><br />
17 October <strong>2007</strong><br />
abc<br />
Investment case<br />
We expect the future development of the sales<br />
network (23.5% of sales in 9M 2006/07), as well<br />
as the investments in R&D (10.6%) <strong>and</strong> the<br />
launch of three promising products to trigger<br />
additional future organic growth. Hence, we<br />
forecast organic growth of c13.3% for <strong>2007</strong>/08e.<br />
The 9M 2006/07 figures include the negative impact<br />
from the lost law suit versus Notal Vision Inc in Q2<br />
(-cEUR2.8m before taxes). This one-time effect<br />
distorts the 9M figures <strong>and</strong> will have less of an effect<br />
in the FY 2006/07e results. In <strong>Q4</strong> 2006/<strong>2007</strong>e, we<br />
expect Carl Zeiss Meditec to report a cEUR1.5m<br />
extraordinary income from tendering its 5% stake in<br />
Wavelight to Alcon. This should partially offset the<br />
negative effect of the law suit.<br />
Following the recent changes in the business of<br />
CZM (streamlining of IOL portfolio, change in<br />
platform strategy, currency effects), we slightly<br />
lower our FY 2006/<strong>2007</strong> forecast, but maintain<br />
our forecasts for <strong>2008</strong> onwards.<br />
Change in FY 2006/07e forecasts<br />
EURm FY 2006/07e new FY 2006/07e old % change<br />
Sales 581.6 594.6 -2.2%<br />
EBIT 68.6 74.7 -8.2%<br />
EBIT margin 11.8% 12.6% -0.8pp<br />
Net profit 43.6 45.9 -5.0%<br />
Source: HSBC estimates<br />
We view the most recent acquisition of Acri.Tec<br />
as a positive move for CZM. Acri.Tec’s strength<br />
in the IOL segment complements CZM’s product<br />
portfolio. This is especially the case for refractive<br />
error correction. IOL (<strong>and</strong> respective surgery<br />
disposables) is one of the fastest-growing areas of<br />
ophthalmology (c10% pa in the <strong>mid</strong>term).<br />
The potential acquisition of competitor Wavelight<br />
was cancelled <strong>and</strong> the already acquired 5% stake<br />
tendered to Alcon. We view this step as positive,<br />
since Wavelight does not offer exposure to<br />
significantly better products or clients.<br />
Catalysts<br />
Promising product launches in <strong>Q1</strong> <strong>and</strong> onwards,<br />
following the AAO conference in November are:<br />
The femtosecond laser VisuMax<br />
The Cirrus OCT TM providing volumetric <strong>and</strong><br />
high definition scans<br />
The XL Stabi ZO® <strong>and</strong> Invent ZO®<br />
intraocular lenses<br />
We expect further synergies <strong>and</strong> efficiency gains<br />
from the successful integration of the recently<br />
consolidated Carl Zeiss Surgical, Carl Zeiss S.A.,<br />
Ioltech S.R.L., Acri.Tec AG <strong>and</strong> the restructuring<br />
of the Carl Zeiss Vertriebsgesellschaft mbH,<br />
which should translate into a further rise in<br />
operating margins.<br />
Investment risks<br />
Rising competition could have a negative effect on<br />
margins <strong>and</strong> market share. Furthermore, the<br />
reduction of cost reimbursement for certain<br />
treatments by health insurance funds could reduce<br />
the dem<strong>and</strong> for the company’s products. In addition,<br />
acquisition <strong>and</strong> execution risks in connection with<br />
the integration of Carl Zeiss Surgical <strong>and</strong> Acri.Tec<br />
could affect our expected margin improvement. As<br />
seen in the 9M figures, exchange-rate developments<br />
also pose a risk to CZM.<br />
Valuation<br />
We calculate a DCF-based target price of EUR19,<br />
while assuming an 8.4% cost of ungeared equity<br />
(4.4% risk-free rate, 4.5% equity risk-premium,<br />
beta 1.0). Our target price of EUR19 implies a<br />
potential total return of 27% from the current<br />
share price versus the hurdle rate for non-volatile<br />
<strong>European</strong> stocks of 8.9% +/-5ppt. We, therefore,<br />
rate the stock Overweight.<br />
26
Mid cap<br />
<strong>European</strong> <strong>small</strong> <strong>and</strong> <strong>mid</strong> <strong>caps</strong><br />
17 October <strong>2007</strong><br />
abc<br />
Financials & valuation: Carl Zeiss Meditec<br />
Financial statements<br />
Year to 09/2006a 09/<strong>2007</strong>e 09/<strong>2008</strong>e 09/2009e<br />
Profit & loss summary (EURm)<br />
Revenue 390.6 581.6 659.0 730.0<br />
EBITDA 58.9 80.3 98.3 113.9<br />
Depreciation & amortisation -10.8 -11.6 -12.5 -14.1<br />
Operating profit/EBIT 48.1 68.6 85.8 99.8<br />
Net interest -0.9 3.2 7.9 11.0<br />
PBT 45.6 76.4 93.7 110.7<br />
HSBC PBT 45.6 76.4 93.7 110.7<br />
Taxation -15.9 -28.3 -34.7 -39.9<br />
Net profit 26.7 46.6 57.4 69.3<br />
HSBC net profit 26.7 46.6 57.4 69.3<br />
Cash flow summary (EURm)<br />
Cash flow from operations 28.4 -30.6 41.9 77.5<br />
Capex -5.5 -7.0 -12.0 -15.0<br />
Cash flow from investment -18.4 -16.1 -17.0 -21.0<br />
Dividends -13.0 -11.4 -13.1 -17.2<br />
Change in net debt 25.1 -182.9 -15.1 -23.3<br />
FCF equity 22.0 -10.1 38.5 70.0<br />
Balance sheet summary (EURm)<br />
Intangible fixed assets 127.0 128.1 128.1 128.7<br />
Tangible fixed assets 29.9 33.3 37.8 44.0<br />
Current assets 212.3 489.9 525.2 557.6<br />
Cash & others 51.3 224.7 224.7 224.7<br />
Total assets 387.4 682.7 722.4 761.7<br />
Operating liabilities 30.4 99.8 107.0 113.9<br />
Gross debt 72.7 63.2 48.1 24.8<br />
Net debt 21.4 -161.5 -176.6 -199.9<br />
Shareholders funds 223.1 451.3 495.7 547.7<br />
Invested capital 287.6 326.8 359.4 391.8<br />
Ratio, growth <strong>and</strong> per share analysis<br />
Year to 09/2006a 09/<strong>2007</strong>e 09/<strong>2008</strong>e 09/2009e<br />
Y-o-y % change<br />
Revenue 20.7 48.9 13.3 10.8<br />
EBITDA 29.2 36.4 22.5 15.8<br />
Operating profit 31.4 42.7 25.0 16.3<br />
PBT 32.0 67.8 22.5 18.2<br />
HSBC EPS 55.7 74.6 23.3 20.6<br />
Ratios (%)<br />
Revenue/IC (x) 1.5 1.9 1.9 1.9<br />
ROIC 12.0 14.2 16.0 17.2<br />
ROE 12.4 13.8 12.1 13.3<br />
ROA 8.4 9.4 8.6 9.6<br />
EBITDA margin 15.1 13.8 14.9 15.6<br />
Operating profit margin 12.3 11.8 13.0 13.7<br />
EBITDA/net interest (x) 65.6<br />
Net debt/equity 9.2 -34.8 -34.7 -35.6<br />
Net debt/EBITDA (x) 0.4 -2.0 -1.8 -1.8<br />
CF from operations/net debt 132.8<br />
Per share data (EUR)<br />
EPS Rep (fully diluted) 0.33 0.57 0.71 0.85<br />
HSBC EPS (fully diluted) 0.33 0.57 0.71 0.85<br />
DPS 0.14 0.16 0.21 0.26<br />
NAV 2.74 5.55 6.10 6.74<br />
Valuation data<br />
Overweight<br />
Year to 09/2006a 09/<strong>2007</strong>e 09/<strong>2008</strong>e 09/2009e<br />
EV/sales 3.2 1.8 1.6 1.4<br />
EV/EBITDA 21.2 13.3 10.7 9.1<br />
EV/IC 4.3 3.3 2.9 2.6<br />
PE* 45.7 26.2 21.2 17.6<br />
P/NAV 5.5 2.7 2.5 2.2<br />
FCF yield (%) 1.8 -0.8 3.1 5.7<br />
Dividend yield (%) 0.9 1.1 1.4 1.7<br />
Note: * = Based on HSBC EPS (fully diluted)<br />
Issuer information<br />
Share price (EUR) 14.99 Target price (EUR) 19.00 Potent'l tot rtn (%) 26.8<br />
Reuters (Equity) AFXG.DE Bloomberg (Equity) AFX GR<br />
Market cap (USDm) 1727.3 Market cap (EURm) 1218.8<br />
Free float (%) 35 Enterprise value (EURm) 1070.3<br />
Country Germany Sector Health Care Equipment<br />
Analyst Christian Packebusch Contact +49 0 211 9102446<br />
Price relative<br />
20<br />
19<br />
18<br />
17<br />
16<br />
15<br />
14<br />
13<br />
12<br />
11<br />
10<br />
Oct-06 Apr-07 Oct-07<br />
Carl Zeiss Meditec Rel to DAX-100<br />
Source: HSBC<br />
Note: price at close of 12 Oct <strong>2007</strong><br />
20<br />
19<br />
18<br />
17<br />
16<br />
15<br />
14<br />
13<br />
12<br />
11<br />
10<br />
27
Mid cap<br />
<strong>European</strong> <strong>small</strong> <strong>and</strong> <strong>mid</strong> <strong>caps</strong><br />
17 October <strong>2007</strong><br />
abc<br />
Deutz<br />
Strong Q2 top-line momentum <strong>and</strong> substantial EBIT margin<br />
improvement in Compact Engines, despite ongoing production<br />
bottlenecks<br />
We expect stress factors to fully disappear in H2 <strong>2007</strong> <strong>and</strong> a<br />
return to the fore of the structural growth story - driven by OEM<br />
outsourcing<br />
10% premium for far above-average CAGR <strong>2007</strong>-09e of 17%, vs<br />
7% in our German Engineering universe. Overweight rating <strong>and</strong><br />
EUR11.0 target price remain unchanged<br />
Investment summary<br />
Top-line CAGR <strong>2007</strong>-09e of 17%<br />
Q2 <strong>2007</strong> results support our view that margin<br />
pressure, resulting from production bottlenecks is<br />
a temporary issue. We continue to believe that the<br />
structural growth story, which is driven by an<br />
OEM outsourcing trend on the back of steadily<br />
tightening emission thresholds, should again come<br />
to the fore. The recent disposal at an attractive<br />
price of the Power Systems division - which<br />
lacked synergies with the rapidly growing<br />
Compact Engines division - has further sharpened<br />
the company’s short-to-<strong>mid</strong>-term growth profile<br />
<strong>and</strong> also creates the financial scope to sufficiently<br />
exploit the considerable long term growth<br />
potential of compact engines. We now expect a<br />
<strong>2007</strong>-09 CAGR of 17% (10% before), far above<br />
the 4% average of the relevant market, above all<br />
driven by increasing captive production volumes.<br />
Underlying EBIT margin improving<br />
Q2 saw strong momentum in the remaining<br />
Compact Engines division (eg sales +43% y-o-y,<br />
EBIT +26%) <strong>and</strong> a substantial improvement of the<br />
EBIT margin, from 4% in <strong>Q1</strong> <strong>2007</strong> to 6%, despite<br />
ongoing production bottlenecks, which emerged in<br />
<strong>Q4</strong> 2006, due to much stronger-than-expected<br />
dem<strong>and</strong> (Q2 margin >7% if adjusted for the<br />
bottleneck impact).<br />
Key facts ____________________Financial summary _____________________ __________ Valuation summary ___________<br />
Analyst: Juergen Siebrecht<br />
Year to Revenue EBITDA HSBC HSBC HSBC Yield HSBC EV/ EV/ IC ROIC HSBC<br />
Tel: +49 211 910 3350<br />
(EURm) (EURm) net profit EPS EPS growth (%) PE EBITDA (x) (%) REP<br />
Email: juergen.siebrecht@hsbc.de<br />
(EURm) (EUR)<br />
(%)<br />
(x) (x)<br />
(x)<br />
Current price (EUR) 9.4 12/2006 1,490.0 154.1 60.9 0.51 220.5 0.0 18.3 9.2 2.0 11.3 1.6<br />
Target price (EUR) 11.0 12/<strong>2007</strong>e 1,550.0 161.7 68.5 0.58 12.5 1.4 16.3 6.3 1.8 12.9 1.2<br />
Mkt cap (EURm) 1,105.0 12/<strong>2008</strong>e 1,749.0 191.2 89.8 0.76 31.0 2.0 12.4 5.3 1.6 16.7 0.8<br />
Bloomberg DEZ GR 12/2009e 1,840.6 202.4 100.1 0.85 11.5 2.1 11.1 4.9 1.4 15.7 0.8<br />
Reuters<br />
DEZG.DE<br />
Source: company data, HSBC estimates<br />
28
Mid cap<br />
<strong>European</strong> <strong>small</strong> <strong>and</strong> <strong>mid</strong> <strong>caps</strong><br />
17 October <strong>2007</strong><br />
abc<br />
DEUTZ organisational structure<br />
DEUTZ<br />
Compact Compact Engines<br />
Engines<br />
• •Oil<strong>and</strong> Air-, oil-, water- <strong>and</strong> water-cooled engines engines with outputs with outputs of up of to up 500kW<br />
to 500kW<br />
for on-road <strong>and</strong> off non-road applications<br />
• Tailor made solutions for customers<br />
• DEUTZ Customised solutions<br />
Deutz Deutz Customised Power Systems<br />
Solutions<br />
• Engines, • Air-cooled gensets engines<br />
<strong>and</strong> systems with outputs of up to 4.0 MW<br />
Used • Water-cooled to convert engines renewable above <strong>and</strong> 8 fossil litres fuels<br />
cylinder capacity<br />
• Project-related • Other, non-engine systems activities business (eg special that involves generator/sets)<br />
high degree of<br />
engineering<br />
Source: DEUTZ<br />
While Deutz lowered its <strong>2007</strong> EBIT margin target<br />
from around 7% to more than 6% at Q2, it<br />
substantially increased its <strong>2007</strong> top-line target<br />
from 10% to 20-25%, implying a substantial<br />
increase in the Compact Engines top-line<br />
expectation to +30% y-o-y. We expect a solid<br />
H2 <strong>2007</strong> Compact Engines performance, driven<br />
by ongoing high volume growth (HSBCe<br />
Compact Engines sales H2 +27% y-o-y) <strong>and</strong> even<br />
higher EBIT growth (HSBCe Compact Engines<br />
H2 EBIT +70%). This is driven by a<br />
normalisation of component supply, on the back<br />
of conducted capacity expansions <strong>and</strong> further<br />
price increases, both indicated at Q2, as well as on<br />
ongoing cost optimisation progress.<br />
We expect the company to meet its <strong>2007</strong> EBIT<br />
margin target of more than c6% (HSBCe 6.3%)<br />
<strong>and</strong> see further EBIT margin expansion in <strong>2008</strong><br />
(we estimate c7% in <strong>2008</strong>, up from a one-off<br />
adjusted 5.5% in 2006) as: (1) the two largest<br />
compact engines outsourcing agreements should<br />
be fully ramped up by then <strong>and</strong> in the meantime,<br />
capacity problems, which caused margin pressure<br />
in <strong>2007</strong>, should be resolved. Second, the company<br />
should be able to profit from a broad range of<br />
engine innovations released over the last two<br />
years <strong>and</strong> from a relative low level of R&D<br />
spending (with no new emission thresholds<br />
requiring major engine development efforts).<br />
Valuation not fully reflecting growth<br />
Given an expected <strong>2007</strong>-09 CAGR of 17% for<br />
Deutz, substantially above the 7%, that we expect<br />
for our German Small & Mid-Cap Engineering<br />
universe on the one h<strong>and</strong>, <strong>and</strong> average EBIT<br />
margins <strong>2007</strong>-09 in line with the sector, on the<br />
other, we allow for a 10% valuation premium,<br />
which leaves us with a target price of EUR11.0<br />
<strong>and</strong> an Overweight rating.<br />
Deutz: sales by division (FY <strong>2007</strong>e) Deutz: sales by region (FY <strong>2007</strong>e)<br />
Customised<br />
Solutions<br />
18%<br />
Compact<br />
Engines<br />
82%<br />
Other<br />
<strong>European</strong><br />
43%<br />
Middle East<br />
4%<br />
Africa<br />
3%<br />
Germany<br />
27%<br />
America<br />
14%<br />
Asia/Pacific<br />
9%<br />
Source: HSBC estimates<br />
Source: HSBC estimates<br />
29
Mid cap<br />
<strong>European</strong> <strong>small</strong> <strong>and</strong> <strong>mid</strong> <strong>caps</strong><br />
17 October <strong>2007</strong><br />
abc<br />
Company profile – at a glance<br />
Deutz is an independent manufacturer of diesel<br />
engines, with a long history <strong>and</strong> a highly<br />
recognised br<strong>and</strong> image. Following several years<br />
of restructuring <strong>and</strong> a successful turnaround in<br />
2002, management shifted its strategic focus to<br />
business expansion in 2006. This has also been<br />
supported by the emergence of positive structural<br />
trends in the market, such as steadily tightening<br />
emission thresholds <strong>and</strong> greater model diversity,<br />
in conjunction with shorter serial model<br />
circulation, which triggered an outsourcing trend<br />
among OEMs due to the increased R&D<br />
requirements <strong>and</strong> lack of scale effects. Deutz’s<br />
core business, compact engines, has been the key<br />
beneficiary of this trend, which is reflected in the<br />
high growth of divisional sales over the last few<br />
years <strong>and</strong> the build-up of several large<br />
outsourcing agreements.<br />
Deutz sold its Power Systems division, shortly ahead<br />
of Q2 <strong>2007</strong>, for an attractive price (EV disposal price<br />
of EUR360m implies an EV/EBITDA of 9x based<br />
on our <strong>2008</strong> estimates). We regard the disposal as<br />
strategically sensible: despite the high theoretical<br />
margin potential of the business, resulting from the<br />
high service intensity of sold machines, the build-up<br />
of a sufficient installed base has probably become an<br />
increasingly difficult task in the industry. Apart from<br />
an existing strong competitor with an advanced<br />
technological base (GE’s subsidiary Jenbacher),<br />
Tognum also recently announced that it was<br />
targeting an expansion of its corresponding business.<br />
Power Systems lacked synergies with the<br />
dominant <strong>and</strong> rapidly growing Compact Engines<br />
division, for which several months ago Deutz had<br />
pronounced an aggressive growth strategy, calling<br />
for an increase in the annual production volume<br />
by at least 100% until 2010. We believe that via<br />
the Power Systems disposal, Deutz now has the<br />
financial scope to sufficiently exploit the high<br />
long-term growth potential of compact engines.<br />
Investment case<br />
We think the current, somewhat weaker,<br />
sentiment towards the stock, resulting from<br />
production-bottleneck-induced margin pressure<br />
<strong>and</strong> a pending CEO replacement offers a good<br />
buying opportunity, given that we expect these<br />
stress factors to be temporary <strong>and</strong> to be resolved<br />
in the course of H2 <strong>2007</strong>. We do not see any<br />
fundamental impact resulting from the departure<br />
of CEO Gordon Riske. Although he successfully<br />
implemented the re-alignment of the group, a<br />
changed market environment (steadily tightening<br />
emission thresholds, triggering compact engine<br />
outsourcing) has also greatly helped <strong>and</strong> these<br />
positive trends should remain.<br />
We believe that Deutz’ structural growth story<br />
(company target is to at least double annual<br />
engine output by 2010 vs 2006) will soon be in<br />
the spotlight again. Should management succeed<br />
in this <strong>and</strong> should the company generate a<br />
sustainable EBIT margin of 7.5% by then, we<br />
could justify a long-term fair value of EUR15 per<br />
share by applying the long-term average German<br />
Industrials 12-month-forward 15.3x PE from JCF<br />
on our 2010 estimates.<br />
Potential catalysts<br />
Announcement of new CEO <strong>and</strong> more growth<br />
capex visibility<br />
The pending new CEO announcement <strong>and</strong> the<br />
poor visibility with regard to concrete further<br />
growth investments (the recent private placement<br />
<strong>and</strong> the Power Systems disposal lead to<br />
EUR370m available extra cash for growth) are a<br />
load factor for the shares. We believe that both<br />
issues are closely related to each other <strong>and</strong> hence<br />
the announcement of a credible new CEO should<br />
be a trigger for the shares.<br />
30
Mid cap<br />
<strong>European</strong> <strong>small</strong> <strong>and</strong> <strong>mid</strong> <strong>caps</strong><br />
17 October <strong>2007</strong><br />
abc<br />
Solution to bottleneck problems by H2<br />
Deutz <strong>and</strong> its suppliers have already invested in<br />
component capacity expansion, which should be<br />
fully available by H2 <strong>2007</strong>. While Q2 already<br />
showed much margin improvement, we expect the<br />
bottleneck problem to be fully resolved in <strong>Q4</strong> <strong>2007</strong><br />
latest, <strong>and</strong> hence also expect the focus to shift back<br />
to the company’s structural growth story.<br />
Further larger engine co-operations<br />
Structural factors in the market create incentives<br />
among OEMs to outsource engine production.<br />
Deutz has profited in the past from this trend <strong>and</strong>,<br />
in our view, there is still potential for Deutz to<br />
establish further larger engine outsourcing<br />
agreements. Deutz’ largest co-operations<br />
comprise an annual output of 30,000 (eg such as<br />
the most recent co-operation with Volvo for the<br />
new Light/Medium truck series when fully<br />
ramped up in <strong>2008</strong>). Depending on the engine<br />
series, unit prices range from EUR2,000-8,000.<br />
Applying these figures to a potential new 30,000<br />
co-operation would result in additional sales of<br />
EUR60-240m pa.<br />
Valuation<br />
We apply a valuation premium to the German<br />
Engineering sector of c10%, given that we are<br />
expecting substantially above-average top-line<br />
CAGR in <strong>2007</strong>-09 of 17%, vs 7% for the sector,<br />
<strong>and</strong> see an average EBIT margin for <strong>2007</strong>-09<br />
nearly in line at 6.9% vs 7.1% for the sector. By<br />
applying a c10% premium to the average German<br />
Engineering <strong>2008</strong>e EV/EBITDA of 5.9x <strong>and</strong><br />
average <strong>2008</strong>e PE of 12.6x, we arrive at a target<br />
price of EUR11.0. With an implied potential total<br />
return of 17% (incl. dividends) on our usual 12-<br />
month horizon; compared with our 3.9-13.9%<br />
Neutral b<strong>and</strong> for non-volatile German stocks, we<br />
assign an Overweight rating.<br />
Investment risks<br />
Risks to our forecasts <strong>and</strong> ratings could occur<br />
from a weakening of the US dollar (which<br />
accounts for c15% of total sales) <strong>and</strong> dependency<br />
on a few large customers (two major customers<br />
should account for c30% of sales in the medium<br />
term). Also, a delayed elimination of the<br />
production bottlenecks could mean that the<br />
company will not achieve its <strong>2007</strong> targets.<br />
31
Mid cap<br />
<strong>European</strong> <strong>small</strong> <strong>and</strong> <strong>mid</strong> <strong>caps</strong><br />
17 October <strong>2007</strong><br />
abc<br />
Financials & valuation: Deutz<br />
Financial statements<br />
Year to 12/2006a 12/<strong>2007</strong>e 12/<strong>2008</strong>e 12/2009e<br />
Profit & loss summary (EURm)<br />
Revenue 1490.0 1550.0 1749.0 1840.6<br />
EBITDA 154.1 161.7 191.2 202.4<br />
Depreciation & amortisation -65.3 -62.4 -66.9 -69.3<br />
Operating profit/EBIT 88.8 99.3 124.3 133.1<br />
Net interest -22.1 -16.0 -12.2 -11.2<br />
PBT 71.4 272.0 111.8 127.5<br />
HSBC PBT 71.4 82.0 111.8 127.5<br />
Taxation -9.9 -16.5 -22.0 -27.4<br />
Net profit 62.1 252.5 89.8 100.1<br />
HSBC net profit 60.9 68.5 89.8 100.1<br />
Cash flow summary (EURm)<br />
Cash flow from operations 104.6 66.3 123.8 157.3<br />
Capex -85.8 -100.0 -80.0 -80.0<br />
Cash flow from investment -85.2 -3.0 -103.0 -103.0<br />
Dividends 0.0 -15.9 -15.6 -22.4<br />
Change in net debt -68.3 -327.9 0.6 -26.2<br />
FCF equity 39.2 48.5 49.2 71.0<br />
Balance sheet summary (EURm)<br />
Intangible fixed assets 100.3 103.6 106.7 109.6<br />
Tangible fixed assets 377.0 254.3 287.3 315.3<br />
Current assets 605.2 898.9 969.4 1001.9<br />
Cash & others 49.4 349.4 349.4 349.4<br />
Total assets 1162.9 1397.2 1503.8 1567.2<br />
Operating liabilities 322.0 331.6 363.5 378.2<br />
Gross debt 378.7 350.8 351.4 325.3<br />
Net debt 329.3 1.4 2.0 -24.1<br />
Shareholders funds 358.5 611.0 685.2 760.1<br />
Invested capital 711.1 575.7 650.5 699.3<br />
Ratio, growth <strong>and</strong> per share analysis<br />
Year to 12/2006a 12/<strong>2007</strong>e 12/<strong>2008</strong>e 12/2009e<br />
Y-o-y % change<br />
Revenue 12.6 4.0 12.8 5.2<br />
EBITDA -12.2 4.9 18.2 5.8<br />
Operating profit -19.4 11.8 25.2 7.1<br />
PBT -17.2 281.0 -58.9 14.1<br />
HSBC EPS 220.5 12.5 31.0 11.5<br />
Ratios (%)<br />
Revenue/IC (x) 2.1 2.4 2.9 2.7<br />
ROIC 11.3 12.9 16.7 15.7<br />
ROE 20.1 14.1 13.9 13.9<br />
ROA 7.4 21.6 7.4 7.6<br />
EBITDA margin 10.3 10.4 10.9 11.0<br />
Operating profit margin 6.0 6.4 7.1 7.2<br />
EBITDA/net interest (x) 7.0 10.1 15.7 18.0<br />
Net debt/equity 91.9 0.2 0.3 -3.2<br />
Net debt/EBITDA (x) 2.1 0.0 0.0 -0.1<br />
CF from operations/net debt 31.8 4662.2 6070.5<br />
Per share data (EUR)<br />
EPS Rep (fully diluted) 0.52 2.13 0.76 0.85<br />
HSBC EPS (fully diluted) 0.51 0.58 0.76 0.85<br />
DPS 0.00 0.13 0.19 0.20<br />
NAV 3.02 5.16 5.78 6.41<br />
Valuation data<br />
Overweight<br />
Year to 12/2006a 12/<strong>2007</strong>e 12/<strong>2008</strong>e 12/2009e<br />
EV/sales 0.9 0.7 0.6 0.5<br />
EV/EBITDA 9.2 6.3 5.3 4.9<br />
EV/IC 2.0 1.8 1.6 1.4<br />
PE* 18.3 16.3 12.4 11.1<br />
P/NAV 3.1 1.8 1.6 1.5<br />
FCF yield (%) 3.6 4.7 4.8 7.0<br />
Dividend yield (%) 0.0 1.4 2.0 2.1<br />
Note: * = Based on HSBC EPS (fully diluted)<br />
Issuer information<br />
Share price (EUR) 9.42 Target price (EUR) 11.00 Potent'l tot rtn (%) 16.8<br />
Reuters (Equity) DEZG.DE Bloomberg (Equity) DEZ GR<br />
Market cap (USDm) 1565.9 Market cap (EURm) 1105.0<br />
Free float (%) 60 Enterprise value (EURm) 1022.2<br />
Country Germany Sector Machinery<br />
Analyst Juergen Siebrecht Contact +49 211 910 3350<br />
Price relative<br />
14<br />
13<br />
12<br />
11<br />
10<br />
9<br />
8<br />
7<br />
6<br />
Oct-06 Apr-07 Oct-07<br />
Deutz Rel to DAX-100<br />
Source: HSBC<br />
Note: price at close of 12 Oct <strong>2007</strong><br />
14<br />
13<br />
12<br />
11<br />
10<br />
9<br />
8<br />
7<br />
6<br />
32
Mid cap<br />
<strong>European</strong> <strong>small</strong> <strong>and</strong> <strong>mid</strong> <strong>caps</strong><br />
17 October <strong>2007</strong><br />
abc<br />
FirstGroup<br />
Closed Laidlaw acquisition cements North American position<br />
Further upside potential from increased synergies, property<br />
disposals <strong>and</strong> possible Greyhound sale<br />
Reiterate Overweight rating <strong>and</strong> DCF-based 810p target price<br />
Investment summary<br />
With the Laidlaw acquisition now closed, our<br />
attention turns to the integration process. We are<br />
buoyed by the fact that the result of the antitrust<br />
review is less onerous than first thought <strong>and</strong><br />
believe that there is still upside to synergies<br />
guidance. In our view, the market is still<br />
underestimating the value of Laidlaw <strong>and</strong> we<br />
remain Overweight with an 810p target price.<br />
Laidlaw acquisition now closed<br />
FirstGroup has confirmed that the Laidlaw<br />
acquisition was closed as of 1 October (it is in our<br />
numbers from October) <strong>and</strong> used the statement to<br />
disclose positive integration news:<br />
Antitrust outcome <strong>and</strong> contract retention<br />
better than that which the company guided to<br />
in February, with an aggregated loss of 3% of<br />
combined school bus fleet versus previous<br />
guidance of c10% of Laidlaw fleet<br />
Upside potential to the property portfolio,<br />
with current valuations from the company in<br />
excess of USD200m<br />
Opportunity to release cUSD200m to<br />
USD300m cash from the Laidlaw captive<br />
insurance fund<br />
Positive news on funding with all debt<br />
facilities in place <strong>and</strong> strong cash generation<br />
negating further equity issue requirement<br />
Upbeat six-month trading statement<br />
Accompanying the Laidlaw closure<br />
announcement was a positive 6M trading<br />
statement. This gives comfort that management<br />
has not neglected the UK business at the expense<br />
of the Laidlaw acquisition.<br />
Key facts ____________________Financial summary _____________________ __________ Valuation summary ___________<br />
Analyst: Tommy Bryson<br />
Year to Revenue EBITDA<br />
Yield<br />
EV/ EV/ IC ROIC<br />
(GBPm) (GBPm)<br />
(%)<br />
(x) (%)<br />
Tel: +44 20 7991 6799<br />
Email: tommy.bryson@hsbcib.com<br />
HSBC<br />
net profit<br />
(GBPm)<br />
HSBC<br />
EPS<br />
(GBp)<br />
HSBC<br />
EPS growth<br />
(%)<br />
HSBC<br />
PE<br />
(x)<br />
EBITDA<br />
(x)<br />
Current price (GBp) 734 3/<strong>2007</strong>a 3,708.8 398.9 134.3 0.34 9.3 2.1 21.7 9.3 2.8 13.5 1.6<br />
Target price (GBp) 810 3/<strong>2008</strong>e 4,679.4 554.3 184.0 0.42 24.4 2.3 17.5 10.2 2.6 11.6 1.7<br />
Mkt cap (GBPm) 3,192.8 3/2009e 5,754.0 741.3 225.0 0.51 22.3 2.6 14.3 7.2 1.7 10.9 1.2<br />
Bloomberg FGP LN 3/2010e 6,020.5 793.7 237.9 0.54 5.8 2.8 13.5 6.4 1.7 12.0 1.0<br />
Reuters<br />
FGP.L<br />
Source: company data, HSBC estimates<br />
HSBC<br />
REP<br />
(x)<br />
33
Mid cap<br />
<strong>European</strong> <strong>small</strong> <strong>and</strong> <strong>mid</strong> <strong>caps</strong><br />
17 October <strong>2007</strong><br />
abc<br />
Organisational structure<br />
FirstGroup<br />
London<br />
c15% market share London bus<br />
UK bus UK rail North America<br />
Regional<br />
Operations in Scotl<strong>and</strong>, York, Leeds,<br />
Manchester, Sheffield, Stoke-on-Trent,<br />
Leicester, Birmingham, Worcester, Norwich,<br />
Ipswich, Northampton, Southampton,<br />
Portsmouth, Bristol, Swansea, Cardiff <strong>and</strong><br />
Plymouth<br />
Source: HSBC<br />
First Capital Connect spans SE Engl<strong>and</strong>,<br />
First Great Western runs across S & W<br />
Engl<strong>and</strong>, the Cotswolds <strong>and</strong> S Wales<br />
TransPennine Express runs intercity<br />
between the north-west, Yorkshire <strong>and</strong> NE<br />
Engl<strong>and</strong><br />
First ScotRail provides c95% of Scottish rail<br />
services <strong>and</strong> links with London<br />
Hull trains is open access between London<br />
Kings Cross <strong>and</strong> Hull<br />
US operations include yellow school bus<br />
(student), the transit division (public transport<br />
systems <strong>and</strong> airport shuttle bus services), the<br />
services unit (vehicle maintenance) <strong>and</strong><br />
Greyhound (from Laidlaw)<br />
Laidlaw acquisition completed on Monday 1<br />
October for cGBP1.9bn<br />
UK bus reported 1.5% passenger volume growth,<br />
greater than 5% revenue growth <strong>and</strong> a margin<br />
uptick of more than 100bp (HSBCe <strong>2008</strong>: 2%,<br />
6.3% <strong>and</strong> +60bp, respectively). Performance in<br />
rail was equally impressive, with passenger<br />
revenue growth up 9% on a like-for-like basis<br />
(HSBCe <strong>2008</strong>: +8.8%).<br />
Additionally, existing North American operations<br />
are experiencing healthy growth, stable operating<br />
margins <strong>and</strong> positive transit contract renewals.<br />
Company profile – at a glance<br />
FirstGroup is the UK’s largest bus operator<br />
(fourth largest in London), with approximately<br />
9,000 buses, carrying 2.9m passengers every day.<br />
It is also the UK’s largest passenger rail franchise<br />
operator with four franchises, one open access<br />
service <strong>and</strong> GB Railfreight. In North America, the<br />
combined First Student <strong>and</strong> Laidlaw business is<br />
c5x the size of its nearest competitor <strong>and</strong><br />
FirstGroup also operates First Transit (public<br />
transport systems <strong>and</strong> airport shuttle bus services)<br />
<strong>and</strong> First Services (vehicle maintenance).<br />
Investment case<br />
Of the c500,000 school buses operating in North<br />
America, roughly one-third are operated by<br />
private contractors, with the remaining two-thirds<br />
operated by the school districts themselves (ie,<br />
they purchase buses <strong>and</strong> hire the drivers directly).<br />
The benefits to school districts of outsourcing<br />
include timesaving <strong>and</strong> lower fixed costs<br />
(contractors benefit from economies of scale).<br />
Together with Laidlaw, we estimate that<br />
FirstGroup (through its First Student br<strong>and</strong>) has<br />
c41% of the North American school bus<br />
contracted market (ie, c12% of the total market).<br />
Clearly Laidlaw cements FirstGroup’s foothold in<br />
the North American yellow school bus market,<br />
which is likely to benefit from more<br />
FirstGroup: sales by division (FY <strong>2007</strong>) FirstGroup: sales by region (FY <strong>2007</strong>)<br />
North<br />
America<br />
22%<br />
UK bus<br />
29%<br />
North<br />
America<br />
22%<br />
UK rail<br />
49%<br />
United<br />
Kingdom<br />
78%<br />
Source: FirstGroup, HSBC<br />
Source: FirstGroup, HSBC<br />
34
Mid cap<br />
<strong>European</strong> <strong>small</strong> <strong>and</strong> <strong>mid</strong> <strong>caps</strong><br />
17 October <strong>2007</strong><br />
abc<br />
subcontracting, <strong>and</strong> we note that FirstGroup is<br />
now the UK’s largest rail operator, with franchise<br />
renewal risk not on the horizon until 2012.<br />
FirstGroup (along with Arriva, Overweight ARI<br />
LN) is our top pick in the UK bus <strong>and</strong> rail sector.<br />
It is trading at a slight premium on calendarised<br />
FY 2009e PE of 13.7x versus the sector on 12.6x<br />
<strong>and</strong> calendarised FY 2009e EV/EBITA ex-rail of<br />
14.5x versus the sector on 14.4x, but this is before<br />
taking into account upside to synergies.<br />
Catalysts<br />
7 November H1 results <strong>and</strong> Laidlaw update<br />
We expect the H1 results to be strong (particularly in<br />
light of the recent trading statement) <strong>and</strong> think that<br />
the market will quite rightly choose to focus on<br />
Laidlaw updates at this stage. With current synergies<br />
guidance of USD70m per annum looking light given<br />
that roughly half of this comes from stripping out<br />
Laidlaw plc costs, <strong>and</strong> the Laidlaw books only<br />
recently opened to FirstGroup at a branch <strong>and</strong><br />
contract data level, we think that there is plenty of<br />
scope for further good news at this stage.<br />
Potential Greyhound sale?<br />
Greyhound, c23% of Laidlaw FY <strong>2007</strong><br />
management estimates EBITDA, is not a natural<br />
fit with FirstGroup’s existing North American<br />
activities. In addition, we think that it increases<br />
the likelihood of management stretch in terms of<br />
both integrating <strong>and</strong> managing the exp<strong>and</strong>ed<br />
operations. Consequently, we think that the<br />
market might welcome a potential sale of<br />
Greyhound (Stagecoach, Underweight SGC LN,<br />
management stated at its FY results that it would<br />
look at it if it became available).<br />
By applying the pro-forma trailing EV/EBITDA<br />
multiple of 6.8x (pre-synergies) at which FirstGroup<br />
acquired Laidlaw, we get a valuation of cUSD796m<br />
for Greyhound, which, all other things being equal,<br />
would reduce FirstGroup’s <strong>2008</strong>e net debt to<br />
EBITDA ratio to 3.4x from 4.2x.<br />
We expect an update on plans for Greyhound at<br />
the same time as the H1 results on 7 November.<br />
Valuation<br />
FirstGroup sum-of-the-parts (FY <strong>2008</strong>e)<br />
Exit<br />
multiple<br />
(x)<br />
NPV Per<br />
(GBPm) share<br />
(GBp)<br />
Per<br />
share<br />
(%)<br />
EV/<br />
EBITDA<br />
(x)<br />
EV/<br />
EBITA<br />
(x)<br />
Bus 6.5 1720 395 49 9.0 14.9<br />
Rail 577 133 16<br />
North America 7.5 3777 868 107 8.8 15.4<br />
Head office 10 -200 -46 -6<br />
Net debt -2309 -531 -65<br />
Pensions deficit -88 -20 -3<br />
Minority interest -14 -3 0<br />
SOTP 3462 796 98<br />
Balance sheet efficiency 69 16 2<br />
Target price GBp 810<br />
Source: HSBC estimates<br />
Our DCF-based sum-of-the-parts valuation gives<br />
us a base-case corporate NPV of GBP3,462m, or<br />
796p per share, which is 8.4% higher than the<br />
734p at which FirstGroup is currently trading. Our<br />
7.4% WACC includes a 5.2% risk-free rate, 3.5%<br />
equity risk premium <strong>and</strong> the Bloomberg-observed<br />
two-year average adjusted beta of 0.94.<br />
We think that FirstGroup could raise GBP1,050m<br />
for buybacks in FY 2011e to take the net debt-to-<br />
EBITDA to 3.0x in that year. This level of<br />
buyback at our 796p SOTP valuation would<br />
increase our FY 2011e EPS by 1.3p <strong>and</strong> applying<br />
the pre-buyback PE multiple of 12.5x gives<br />
additional value of 16p per share.<br />
We re-iterate our target price of 810p per share<br />
<strong>and</strong> Overweight rating.<br />
Investment risks<br />
Downside risks to our thesis include integration<br />
problems with Laidlaw, management stretch in<br />
dealing with the enlarged business <strong>and</strong> any<br />
potential terrorist incident in the UK slowing<br />
down medium-term UK bus patronage growth.<br />
35
Mid cap<br />
<strong>European</strong> <strong>small</strong> <strong>and</strong> <strong>mid</strong> <strong>caps</strong><br />
17 October <strong>2007</strong><br />
abc<br />
Financials & valuation: FirstGroup<br />
Overweight<br />
Financial statements<br />
Year to 03/<strong>2007</strong>a 03/<strong>2008</strong>e 03/2009e 03/2010e<br />
Profit & loss summary (GBPm)<br />
Revenue 3,709 4,679 5,754 6,020<br />
EBITDA 399 554 741 794<br />
Depreciation & amortisation -140 -202 -271 -286<br />
Operating profit/EBITA 249 352 470 508<br />
Net interest -63 -104 -164 -184<br />
PBT 140 233 296 314<br />
HSBC PBT 196 248 306 324<br />
Taxation -38 -61 -77 -82<br />
Net profit 92 160 203 215<br />
HSBC net profit 134 184 225 238<br />
Cash flow summary (GBPm)<br />
Cash flow from operations 305 452 579 610<br />
Capex -251 -215 -250 -250<br />
Cash flow from investment -222 -2,115 -250 -250<br />
Dividends -68 -75 -82 -90<br />
Change in net debt -167 1,739 -247 -269<br />
FCF equity 52 191 264 291<br />
Balance sheet summary (GBPm)<br />
Intangible fixed assets 530 1,608 1,598 1,588<br />
Tangible fixed assets 1,060 1,914 1,893 1,857<br />
Current assets 861 626 797 988<br />
Cash & others 411 148 295 464<br />
Total assets 2,543 4,240 4,380 4,525<br />
Operating liabilities 836 880 918 952<br />
Gross debt 891 2,366 2,266 2,166<br />
Net debt 571 2,309 2,062 1,793<br />
Shareholders funds 596 681 802 927<br />
Invested capital 1,204 3,120 3,075 3,017<br />
Ratio, growth <strong>and</strong> per share analysis<br />
Year to 03/<strong>2007</strong>a 03/<strong>2008</strong>e 03/2009e 03/2010e<br />
Key forecast drivers<br />
Year to 03/<strong>2007</strong>a 03/<strong>2008</strong>e 03/2009e 03/2010e<br />
Bus average fuel price 67 67 70 70<br />
Rail revenue growth 9.9 56.6 8.8 7.7<br />
Rail margin 6.0 6.3 6.3 6.4<br />
Student contract retention 95 90 90 95<br />
Student new contracts 9.8 150.0 125.0 10.0<br />
Student average fuel price 53 62 70 70<br />
Valuation data<br />
Year to 03/<strong>2007</strong>a 03/<strong>2008</strong>e 03/2009e 03/2010e<br />
EV/sales 1.0 1.2 0.9 0.8<br />
EV/EBITDA 9.3 10.2 7.2 6.4<br />
EV/IC 2.8 2.6 1.7 1.7<br />
PE* 21.7 17.5 14.3 13.5<br />
P/NAV 4.9 4.7 4.0 3.5<br />
FCF yield (%) 2.3 4.5 7.0 8.1<br />
Dividend yield (%) 2.1 2.3 2.6 2.8<br />
Note: * = Based on HSBC EPS (basic)<br />
Price relative<br />
821<br />
721<br />
621<br />
521<br />
421<br />
321<br />
221<br />
Source: HSBC<br />
2005 2006 <strong>2007</strong> <strong>2008</strong><br />
FirstGroup Rel to FTSE ALL-SHARE<br />
821<br />
721<br />
621<br />
521<br />
421<br />
321<br />
221<br />
Y-o-y % change<br />
Revenue 22.4 26.2 23.0 4.6<br />
EBITDA 13.4 39.0 33.7 7.1<br />
Operating profit 10.5 41.5 33.5 8.0<br />
PBT -10.9 66.5 26.9 5.9<br />
HSBC EPS 9.3 24.5 22.3 5.8<br />
Ratios (%)<br />
Revenue/IC (x) 3.0 2.2 1.9 2.0<br />
ROIC 13.5 11.6 10.9 12.0<br />
ROE 29.3 28.8 30.3 27.5<br />
ROA 6.7 7.6 8.1 8.5<br />
EBITDA margin 10.8 11.8 12.9 13.2<br />
Operating profit margin 6.7 7.5 8.2 8.4<br />
EBITDA/net interest (x) 6.3 5.3 4.5 4.3<br />
Net debt/equity 93.9 332.2 251.7 189.7<br />
Net debt/EBITDA (x) 1.4 4.2 2.8 2.3<br />
CF from operations/net debt 53.4 19.6 28.1 34.0<br />
Per share data (GBPp)<br />
EPS reported (fully diluted) 22.81 36.09 45.91 48.67<br />
HSBC EPS (fully diluted) 33.41 41.59 50.85 53.77<br />
DPS 15.50 17.05 18.75 20.63<br />
NAV 149.84 155.40 182.99 211.48<br />
Note: price at close of 12 Oct <strong>2007</strong><br />
Stated accounts as of 31 Mar 2005 are IFRS compliant<br />
36
Mid cap<br />
<strong>European</strong> <strong>small</strong> <strong>and</strong> <strong>mid</strong> <strong>caps</strong><br />
17 October <strong>2007</strong><br />
abc<br />
<strong>Fourlis</strong> Holdings<br />
Unmatched growth prospects courtesy of the exclusive, lucrative,<br />
long-term IKEA franchise licence for Greece, Cyprus <strong>and</strong> Bulgaria<br />
We expect EPS CAGR of 42% for 2006-09e <strong>and</strong> 32% for 2006-<br />
11e, primarily driven by aggressive new IKEA store rollouts <strong>and</strong><br />
strong like-for-like (LFL) same-store sales momentum<br />
We reiterate our Overweight rating <strong>and</strong> raise our target price to<br />
EUR31.3 (EUR25.5 previously), mirroring upward IKEA earnings<br />
revisions on higher LFL revenue growth <strong>and</strong> margin assumptions<br />
Investment summary<br />
<strong>Fourlis</strong> Holdings’ (FH) key asset is the exclusive,<br />
lucrative, long-term franchise agreement with<br />
Swedish IKEA Group, encompassing Greece,<br />
Cyprus <strong>and</strong> Bulgaria. FH also st<strong>and</strong>s to gain from<br />
the positive momentum of the exclusive Intersport<br />
franchise, which looks well-placed to become one<br />
of the largest sportswear apparel retail chains in<br />
South-East Europe. FH’s third business division<br />
of electronics wholesaling plays a <strong>small</strong> role in<br />
earnings contribution.<br />
Solid IKEA <strong>and</strong> wholesaling Q2 performance<br />
lead to valuation upgrades<br />
Q2 <strong>2007</strong> group results were well ahead of our<br />
forecasts (39-43% higher) at the EBITDA <strong>and</strong><br />
earnings levels, largely on the back of an<br />
impressive wholesale performance (on upbeat<br />
dem<strong>and</strong> for Samsung flat TV screens <strong>and</strong> airconditioners<br />
in Greece <strong>and</strong> Romania), as well as<br />
stronger-than-expected margins from IKEA,<br />
mirroring a higher value-added sales mix. We<br />
raise our group EPS forecast by 12% for <strong>2007</strong> <strong>and</strong><br />
7% for <strong>2008</strong>, largely reflecting major upward<br />
revisions in our earnings forecasts for the<br />
wholesale division. In turn, the improved earnings<br />
outlook for existing IKEA stores – on higher<br />
penetration (number of visitors rose 14% in H1),<br />
ticket value, as well as stronger margins, more<br />
than offset the negative impact from delaying the<br />
second Athens-based IKEA store opening to<br />
March <strong>2008</strong>, in our view.<br />
Key facts ____________________ Financial summary_____________________ __________ Valuation summary ___________<br />
Analyst: Spiros Tsangalakis<br />
Year to Revenue EBITDA HSBC HSBC HSBC Yield HSBC EV/ EV/ IC ROIC HSBC<br />
Tel: +30 210 6965 212<br />
(EURm) (EURm) net profit EPS EPS growth (%) PE EBITDA (x) (%) REP<br />
Email: spiros.tsangalakis@hpss.hsbc.gr<br />
(EURm) (EUR)<br />
(%)<br />
(x) (x)<br />
(x)<br />
Current price (EUR) 26.1 12/2006 487.0 49.5 25.5 0.50 33.4 0.7 52.1 29.0 8.1 14.2 4.7<br />
Target price (EUR) 31.3 12/<strong>2007</strong>e 596.5 62.3 44.1 0.87 72.9 1.2 30.2 23.4 6.5 21.1 2.5<br />
Mkt cap (EURm) 1,329.9 12/<strong>2008</strong>e 760.7 92.4 56.0 1.10 27.0 1.5 23.7 16.0 4.8 25.1 1.6<br />
Bloomberg FOYRK GA 12/2009e 934.9 119.6 72.9 1.43 30.1 1.7 18.2 12.6 3.9 23.8 1.4<br />
Reuters<br />
FRLr.AT<br />
Source: HSBC Pantelakis Securities estimates, <strong>Fourlis</strong><br />
37
Mid cap<br />
<strong>European</strong> <strong>small</strong> <strong>and</strong> <strong>mid</strong> <strong>caps</strong><br />
17 October <strong>2007</strong><br />
abc<br />
<strong>Fourlis</strong> Holdings: <strong>2007</strong>-08e forecasts revisions by business segment (EURm)<br />
_____________FY <strong>2007</strong>e __________ _____________ FY <strong>2008</strong>e ___________<br />
FY 2006a Old New Revision y-o-y Old New Revision y-o-y<br />
Sales IKEA 200.8 270.0 246.9 -9% 23% 391.6 373.8 -5% 51%<br />
Existing IKEA stores 200.8 213.8 234.9 10% 17% 217.6 234.3 8% 0%<br />
Intersport 45.5 56.5 56.5 0% 24% 65.0 65.0 0% 15%<br />
Wholesale 235.7 267.3 287.3 7% 22% 292.8 315.3 8% 10%<br />
Total sales 482.1 593.7 590.7 -1% 23% 749.3 754.1 1% 28%<br />
Recurring EBITDA IKEA 40.2 51.5 51.6 0% 28% 73.3 71.4 -3% 38%<br />
Existing IKEA stores 40.2 43.2 47.5 10% 18% 44.2 48.3 9% 2%<br />
Intersport 5.0 6.7 6.7 0% 35% 7.8 7.8 0% 17%<br />
Wholesale 6.1 7.2 12.0 67% 96% 7.8 13.2 69% 10%<br />
Consolidation differences (1.2)<br />
Total recurring EBITDA 50.1 65.3 70.3 8% 40% 88.9 92.4 4% 31%<br />
Recurring earnings IKEA 21.5 30.7 31.3 2% 45% 45.3 44.2 -2% 41%<br />
Existing IKEA stores 21.5 26.4 29.2 10% 36% 27.2 29.6 9% 1%<br />
Intersport 2.2 3.8 3.8 0% 71% 4.8 4.8 0% 26%<br />
Wholesale 1.3 2.8 7.1 150% 458% 3.2 8.0 150% 13%<br />
Consolidation differences 0.5 1.9 1.9 (0.8) (1.0)<br />
Total recurring earnings 25.5 39.3 44.1 12% 73% 52.6 56.0 7% 27%<br />
Source: <strong>Fourlis</strong> Holdings, HSBC Pantelakis Securities estimates<br />
This is five months later than previously expected<br />
because of archaeological finds discovered in the car<br />
park. We now expect group 2006-09 sales, HSBC<br />
EBITDA <strong>and</strong> HSBC EPS CAGRs of 24%, 34% <strong>and</strong><br />
42%, respectively, primarily driven by aggressive<br />
IKEA network expansion in Greece, Cyprus <strong>and</strong><br />
Bulgaria. On our forecasts, IKEA should account for<br />
55% <strong>and</strong> 81% of FY 2009 group sales (vs 42% in<br />
<strong>2007</strong>e) <strong>and</strong> EBITDA (vs 70% in <strong>2007</strong>e).<br />
Company profile – at a glance<br />
FH is a holding company consisting of three main<br />
divisions: IKEA home furniture, Intersport<br />
sportswear retail <strong>and</strong> electrical goods wholesale,<br />
including powerful br<strong>and</strong>s like Samsung <strong>and</strong> GE.<br />
The IKEA business segment started operating in<br />
2001, as FH, pursuant to its exclusive franchise<br />
agreement signed in 2000 with IKEA Group<br />
(Europe’s largest home furniture retailer) for Greece<br />
<strong>and</strong> Cyprus, launched its first store in Thessaloniki,<br />
Northern Greece. In June 2006, the IKEA franchise<br />
licence was extended to Bulgaria. FH’s franchise<br />
agreement with IKEA Group is based on a low<br />
single-digit commission on net sales.<br />
Investment case<br />
Following the second IKEA store opening in East<br />
Athens (April 2004), FH sold a 21.5% stake in<br />
Kotsovolos to Dixons. This move highlighted the<br />
group’s strategic decision to disengage from the<br />
stagnant <strong>and</strong> highly competitive market of electrical<br />
appliances retailing, shifting its focus towards the<br />
lucrative IKEA franchise. The unparalleled success<br />
of IKEA in Greece reflects, in our view, the structure<br />
of the local home products market. This market is<br />
highly fragmented, with very few organised chains,<br />
which, because of expensive pricing, lack a large<br />
client base. This is where IKEA has built its<br />
competitive edge, offering a wide variety of highquality<br />
home products, combining good design at<br />
low prices.<br />
The expansion of the exclusive Intersport franchise,<br />
both at home <strong>and</strong> abroad (ie, Cyprus, Bulgaria <strong>and</strong><br />
Romania), is also crucial to FH’s growth strategy.<br />
By extending its foothold in SE Europe, capitalising<br />
on its know-how <strong>and</strong> extensive product offering,<br />
Intersport could well turn into one of the largest<br />
athletics apparel retail chains in South East Europe.<br />
Finally, we expect the electrical appliances<br />
wholesale business to maintain its upbeat<br />
momentum (both in sales <strong>and</strong> earnings) over our 3-<br />
year forecast period, adding value to the group. That<br />
said, the division’s contribution to group earnings<br />
should remain modest (12% of total in FY 2009e).<br />
38
Mid cap<br />
<strong>European</strong> <strong>small</strong> <strong>and</strong> <strong>mid</strong> <strong>caps</strong><br />
17 October <strong>2007</strong><br />
abc<br />
<strong>Fourlis</strong> Holdings: sum-of–parts valuation (EURm)<br />
Business division Valuation method EV % of total Minorities Net debt Eq. value New eq. value/sh Old eq. value/sh<br />
IKEA 3-stages DCF 1,600.4 90.1% 81.0 41.8 1,477.6 29.0 24.3<br />
Intersport <strong>2007</strong>e EV/EBITDA 7.5x 50.0 2.8% 0.7 49.3 1.0 1.0<br />
Wholesale activity <strong>2007</strong>e EV/EBITDA 6.5x 77.8 4.4% 55.2 22.6 0.4 -0.6<br />
Asset for sale Book value 29.5 1.7% 29.5 0.6 0.6<br />
Kotsovolos Put option 18.6 1.0% 18.6 0.4 0.3<br />
<strong>Fourlis</strong> Holding - 2.7 (2.7) -0.1 -0.1<br />
Total 1,776.3 100.0% 81.0 100.4 1,594.9 31.3 25.6<br />
Source: <strong>Fourlis</strong> Holdings, HSBC Pantelakis Securities estimates<br />
Catalysts<br />
Dynamic expansion of the IKEA franchise<br />
Given fast-growing br<strong>and</strong> awareness <strong>and</strong><br />
popularity in Greece, FH seeks to exploit its<br />
regional IKEA franchise licence to its full<br />
potential. The group targets a minimum of seven<br />
new IKEA stores in Greece (+4) <strong>and</strong> Bulgaria<br />
(+3) over the next 3-4 years, compared with two<br />
stores in Greece <strong>and</strong> one in Cyprus currently. The<br />
first Cyprus-based store (Larnaca) opened its<br />
doors in September <strong>2007</strong>. We expect sales from<br />
Cyprus <strong>and</strong> the upcoming IKEA Rentis store to<br />
reach EUR52m <strong>and</strong> EUR83m in FY <strong>2008</strong>. This<br />
development, coupled with healthy organic<br />
growth, should boost the IKEA division’s sales<br />
<strong>and</strong> EBITDA to EUR374m (up 51% y-o-y) <strong>and</strong><br />
EUR71m (up 64% y-o-y) in FY <strong>2008</strong>, we think.<br />
Coming into play in H1 2009 with the Sofia store<br />
rollout <strong>and</strong> with the addition of at least two more<br />
outlets by end-2010, Bulgarian operations should<br />
then drive the IKEA franchise’s future growth. By<br />
2011, we expect the three Bulgarian IKEA stores<br />
to generate aggregate sales, EBITDA <strong>and</strong> net<br />
earnings of EUR152m, EUR29m <strong>and</strong> EUR15m,<br />
accounting for 13%, 18% <strong>and</strong> 15% of the group’s<br />
total, respectively.<br />
FH’s excellent execution record in developing the<br />
IKEA franchise could pave the way for new<br />
licence agreements in the region (eg, Serbia,<br />
FYROM <strong>and</strong> Albania).<br />
Valuation<br />
We have valued FH using a sum-of-the-parts<br />
method (please see table above). Our SOTP<br />
valuation model returns a new a target price of<br />
EUR31.3 per share vs EUR25.5 previously, largely<br />
reflecting our upward revisions to medium- <strong>and</strong><br />
longer-term earnings forecasts for the IKEA<br />
franchise (on faster LFL revenue growth <strong>and</strong> higher<br />
margins), but also the better near-term visibility for<br />
the wholesale business. Our new target price<br />
implies a potential total return of 20%. We thus<br />
reiterate our Overweight rating on FH.<br />
In our view, valuation comparisons on<br />
conventional near-term multiples, fail to fully<br />
capture the dynamic expansion of the IKEA<br />
franchise (accounting for c93 % of FH’s appraised<br />
equity value, on our estimates), which unfolds<br />
over a longer period. We believe that FH deserves<br />
a premium given its outst<strong>and</strong>ing growth outlook<br />
(2006-11e recurring EPS CAGR of 32%) on high<br />
earnings visibility – a unique way of investing in<br />
the unmatched IKEA model.<br />
Investment risks<br />
Key downside risks include: a) delays in the<br />
execution of the IKEA store rollout plan, b)<br />
renegotiation of the IKEA franchise agreement (ie,<br />
higher royalties), c) higher-than-expected<br />
cannibalisation effects from the second IKEA store<br />
in Athens, d) a reduction in disposable income in<br />
any of the countries of operation, e) increasing<br />
working capital requirements, because of the robust<br />
IKEA store network expansion, <strong>and</strong> f) the<br />
emergence of a competitive home furnishing<br />
superstore network.<br />
39
Mid cap<br />
<strong>European</strong> <strong>small</strong> <strong>and</strong> <strong>mid</strong> <strong>caps</strong><br />
17 October <strong>2007</strong><br />
abc<br />
Financials & valuation: <strong>Fourlis</strong><br />
Financial statements<br />
Year to 12/2006a 12/<strong>2007</strong>e 12/<strong>2008</strong>e 12/2009e<br />
Profit & loss summary (EURm)<br />
Revenue 487.0 596.5 760.7 934.9<br />
EBITDA 49.5 62.3 92.4 119.6<br />
Depreciation & amortisation -7.1 -7.7 -10.9 -13.8<br />
Operating profit/EBIT 42.4 54.6 81.5 105.8<br />
Net interest -5.1 -5.7 -7.4 -9.0<br />
PBT 47.9 55.9 92.7 96.8<br />
HSBC PBT 37.9 56.8 74.1 96.8<br />
Taxation -20.6 -12.5 -17.0 -21.2<br />
Net profit 27.4 43.5 74.6 72.9<br />
HSBC net profit 25.5 44.1 56.0 72.9<br />
Cash flow summary (EURm)<br />
Cash flow from operations 15.1 31.9 40.0 67.6<br />
Capex -13.9 -43.0 -65.5 -71.8<br />
Cash flow from investment -26.4 -43.8 -60.2 -69.6<br />
Dividends -9.2 -16.3 -20.4 -22.9<br />
Change in net debt 2.4 20.9 23.0 27.6<br />
FCF equity 1.2 -11.2 -25.6 -4.3<br />
Balance sheet summary (EURm)<br />
Intangible fixed assets 4.3 4.2 4.2 4.1<br />
Tangible fixed assets 101.9 137.2 191.9 249.8<br />
Current assets 221.8 256.1 302.0 343.0<br />
Cash & others 25.5 29.7 21.0 12.8<br />
Total assets 386.5 456.5 552.7 652.1<br />
Operating liabilities 125.8 143.8 170.4 197.7<br />
Gross debt 141.3 166.4 180.7 200.2<br />
Net debt 115.8 136.7 159.7 187.3<br />
Shareholders funds 114.1 141.3 195.5 245.4<br />
Invested capital 176.7 224.1 306.7 386.4<br />
Ratio, growth <strong>and</strong> per share analysis<br />
Year to 12/2006a 12/<strong>2007</strong>e 12/<strong>2008</strong>e 12/2009e<br />
Y-o-y % change<br />
Revenue 17.8 22.5 27.5 22.9<br />
EBITDA 15.5 25.9 48.3 29.5<br />
Operating profit 18.5 28.6 49.4 29.8<br />
PBT 67.8 16.6 65.9 4.4<br />
HSBC EPS 33.4 72.9 27.0 30.1<br />
Ratios (%)<br />
Revenue/IC (x) 2.9 3.0 2.9 2.7<br />
ROIC 14.2 21.1 25.1 23.8<br />
ROE 24.5 34.5 33.3 33.1<br />
ROA 7.6 10.3 15.0 12.5<br />
EBITDA margin 10.2 10.4 12.1 12.8<br />
Operating profit margin 8.7 9.1 10.7 11.3<br />
EBITDA/net interest (x) 9.6 10.9 12.4 13.2<br />
Net debt/equity 101.4 96.8 81.3 75.2<br />
Net debt/EBITDA (x) 2.3 2.2 1.7 1.6<br />
CF from operations/net debt 13.0 23.3 25.0 36.1<br />
Per share data (EUR)<br />
EPS Rep (fully diluted) 0.54 0.85 1.46 1.43<br />
HSBC EPS (fully diluted) 0.50 0.87 1.10 1.43<br />
DPS 0.18 0.32 0.40 0.45<br />
NAV 2.24 2.77 3.84 4.82<br />
New IKEA stores <strong>2008</strong>-2010<br />
Overweight<br />
Location Opening Investment (HSBCe)<br />
IKEA Athens West (Rentis) Mar-08 EUR10m<br />
IKEA Ioannina (NW Greece) Oct-08 EUR24m<br />
IKEA Larissa (central Greece) Feb-09 EUR24m<br />
IKEA Bulgaria 1 (Sofia) May-09 EUR22m<br />
IKEA Bulgaria 2 (Burgas) Oct-09 EUR21m<br />
IKEA Heraclion (Crete) Nov-09 EUR27m<br />
IKEA Bulgaria 3 (Plovdiv) Sep-10 EUR20m<br />
Valuation data<br />
Year to 12/2006a 12/<strong>2007</strong>e 12/<strong>2008</strong>e 12/2009e<br />
EV/sales 3.0 2.4 1.9 1.6<br />
EV/EBITDA 29.0 23.4 16.0 12.6<br />
EV/IC 8.1 6.5 4.8 3.9<br />
PE* 52.1 30.2 23.7 18.2<br />
P/NAV 11.7 9.4 6.8 5.4<br />
FCF yield (%) 0.1 -0.8 -1.9 -0.3<br />
Dividend yield (%) 0.7 1.2 1.5 1.7<br />
Note: * = Based on HSBC EPS (fully diluted)<br />
Issuer information<br />
Share price (EUR) 26.10 Target price (EUR) 31.30 Potent'l tot rtn (%) 19.9<br />
Reuters (Equity) FRLr.AT Bloomberg (Equity) FOYRK GA<br />
Market cap (USDm) 1884.6 Market cap (EURm) 1329.9<br />
Free float (%) 70 Enterprise value (EURm) 1457.2<br />
Country Greece Sector Household Durables<br />
Analyst Spiros Tsangalakis Contact 30 210 6965 212<br />
Price relative<br />
29<br />
27<br />
25<br />
23<br />
21<br />
19<br />
17<br />
15<br />
13<br />
11<br />
Oct-06 Apr-07 Oct-07<br />
<strong>Fourlis</strong> Rel to ATHENS SE<br />
Source: HSBC<br />
Note: price at close of 12 Oct <strong>2007</strong><br />
29<br />
27<br />
25<br />
23<br />
21<br />
19<br />
17<br />
15<br />
13<br />
11<br />
40
Mid cap<br />
<strong>European</strong> <strong>small</strong> <strong>and</strong> <strong>mid</strong> <strong>caps</strong><br />
17 October <strong>2007</strong><br />
abc<br />
Hochtief<br />
Coverage of the entire construction value chain on a global scale<br />
Growth catalysts are an increased focus on attractive service<br />
areas, synergies between the different business lines <strong>and</strong><br />
globalisation<br />
Our sum-of-the-parts valuation shows a new target price of<br />
EUR108 (EUR101 previously), implying 19% potential return;<br />
Overweight<br />
Investment summary<br />
Hochtief offers a broad portfolio of international<br />
construction activities <strong>and</strong> construction-related<br />
services. The main element of this strategy is an<br />
integrated approach offering solutions for the<br />
entire life cycle of construction activities: from<br />
developing, designing, financing <strong>and</strong> construction<br />
to the operational management of buildings.<br />
Hochtief is also able to manage complex projects<br />
cross border. Given this set-up, we think the<br />
company is well positioned to benefit from the<br />
increasing market volume for complex<br />
infrastructure <strong>and</strong> building projects, not only in<br />
emerging regions, but also in developed countries<br />
(PPP, facility management, project development).<br />
In recent weeks Hochtief has taken four important<br />
steps both to broaden its business opportunities <strong>and</strong><br />
focus on more stable <strong>and</strong> higher-margin business:<br />
1 The merger of activities in the Gulf region of<br />
Leighton with Al Habtoor, (Hochtief’s<br />
Leighton stake is 45% with EUR1.65bn<br />
revenues enables Hochtief/Leighton to play a<br />
leading role in one of the fastest growing<br />
regions globally.<br />
2 With the acquisition of aurelis from Deutsche<br />
Bahn, Hochtief gains access to a real estate<br />
portfolio of 27m sqm. We are convinced that<br />
Hochtief will be able to generate relatively<br />
quickly a substantial return both in the rental<br />
<strong>and</strong> development parts of the portfolio.<br />
Key facts ____________________Financial summary _____________________ ___________ Valuation summary ___________<br />
Analyst: Thomas Teetz<br />
Year to Revenue EBITDA HSBC HSBC HSBC Yield HSBC EV/ EV/ IC ROIC HSBC<br />
Tel: +49 211 910 2353<br />
(EURm) (EURm) net profit EPS EPS growth (%) PE EBITDA (x) (%) REP<br />
Email: thomas.teetz@hsbc.de<br />
(EURm) (EUR)<br />
(%)<br />
(x) (x)<br />
(x)<br />
Current price (EUR) 91.1 12/2006 15,508.0 651.8 89.1 1.27 41.5 1.2 71.6 7.7 3.0 10.8 2.2<br />
Target price (EUR) 108.0 12/<strong>2007</strong>e 15,910.2 712.3 106.6 1.52 19.7 1.3 59.8 7.1 2.9 13.9 1.7<br />
Mkt cap (EURm) 5,747.5 12/<strong>2008</strong>e 16,305.4 845.2 156.1 2.23 46.4 1.4 40.8 6.0 2.8 16.2 1.4<br />
Bloomberg HOT GR 12/2009e 17,454.6 869.6 158.7 2.27 1.6 1.5 40.2 4.0 1.9 16.5 0.9<br />
Reuters<br />
HOTG.DE<br />
Source: HSBC estimates<br />
41
Mid cap<br />
<strong>European</strong> <strong>small</strong> <strong>and</strong> <strong>mid</strong> <strong>caps</strong><br />
17 October <strong>2007</strong><br />
abc<br />
3 The takeover of Flatiron Construction, a<br />
leading US construction company in the<br />
infrastructure sector, fits perfectly into<br />
Hochtief’s existing infrastructure <strong>and</strong> PPP<br />
activities <strong>and</strong> should lead to interesting<br />
synergy effects, in our view.<br />
4 Hochtief’s planned takeover of the Vattenfall<br />
energy contracting unit in Germany should<br />
enable it to play a leading role in a growthintensive<br />
business area (expected growth rates<br />
of more than 15%).<br />
These strategic steps are not adequately reflected<br />
in the stock price, in our view. Our sum-of-theparts<br />
analysis leads to a fair value of EUR108 per<br />
share. Nearly 85% of the market value is<br />
represented by the 54% Leighton stake, meaning<br />
that ll remaining activities would have an implied<br />
value of EUR1bn, which is a clear undervaluation<br />
in our view.<br />
Company profile – at a glance<br />
Hochtief covers the entire construction value<br />
chain, divided into five segments:<br />
1 Hochtief Airport division operates six airports<br />
(Athens, Budapest, Düsseldorf, Hamburg,<br />
Sydney <strong>and</strong> Tirana).This portfolio makes the<br />
company one of the leading operators in this<br />
segment worldwide. The main focus for further<br />
value generation here will be the development<br />
of the existing portfolio (optimisation of rental<br />
structure, further revenue potential, etc) <strong>and</strong><br />
selective expansion (expected privatisations in<br />
<strong>2007</strong>-08: Abu Dhabi, Bucharest, Chicago,<br />
Lisbon, Prague).<br />
2 The Development division encompasses<br />
mainly the PPP <strong>and</strong> facility management<br />
business, but also the real estate development<br />
(aurelis). We expect a much stronger impact<br />
on revenues/earnings from this business line<br />
in years to come as public infrastructure<br />
contracts (buildings, roads) <strong>and</strong> the<br />
professional management of buildings should<br />
offer significant growth potential. From<br />
aurelis we also expect significant earnings<br />
contributions from 2009 onwards.<br />
3 Construction services Asia/Pacific is<br />
represented by the 54% stake in the leading<br />
Australian construction company Leighton.<br />
Increasing penetration of new <strong>and</strong> growing<br />
markets like the Gulf region (Al Habtoor<br />
deal), India <strong>and</strong> Macao, <strong>and</strong> ongoing growth<br />
in the infrastructure segment, are the main<br />
drivers of this segment.<br />
4 Construction Services Americas (Turner)<br />
is mainly focused on attractive niche<br />
segments like retail, education/science <strong>and</strong><br />
healthcare buildings. Generally these<br />
segments are not as cyclical as residential<br />
Hochtief: sales by division in %, 2006 Hochtief: EBT by division in %, 2006<br />
Hochtief Europe<br />
13.0%<br />
Hochtief<br />
Dev elopment<br />
6.5%<br />
Hochtief Airports<br />
0.6%<br />
Hochtief Europe<br />
0.5%<br />
Hochtief<br />
Dev elopm ent<br />
11.3%<br />
Hochtief Airports<br />
8.7%<br />
Hochtief Americas<br />
14.6%<br />
Hochtief<br />
Americas<br />
42.9%<br />
Hochtief Asia<br />
37.0%<br />
Hochtief Asia<br />
64.9%<br />
Source: company data, HSBC<br />
Source: company data, HSBC<br />
42
Mid cap<br />
<strong>European</strong> <strong>small</strong> <strong>and</strong> <strong>mid</strong> <strong>caps</strong><br />
17 October <strong>2007</strong><br />
abc<br />
construction (which is not part of Turner’s<br />
business) <strong>and</strong> should not dramatically suffer<br />
from a potential US recession. Given the<br />
acquisition of Flatiron, Hochtief is now also<br />
active in the US infrastructure/PPP business.<br />
5 Construction services Europe is focused on<br />
the German construction business (which<br />
experienced huge problems in <strong>2007</strong>, due to<br />
strong price increases for<br />
materials/subcontractors) <strong>and</strong> the CEE area. We<br />
expect that the significant loss in <strong>2007</strong><br />
(EUR130m in Germany) will be turned into a<br />
<strong>small</strong> positive earnings contribution in <strong>2008</strong>-09.<br />
Investment case<br />
Hochtief is one of the most interesting<br />
infrastructure plays in Europe, in our view. Future<br />
challenges in this sector are a rising complexity in<br />
infrastructure projects, which dem<strong>and</strong> complete<br />
solutions <strong>and</strong> an international production <strong>and</strong><br />
distribution network. In both areas we see<br />
Hochtief as well-positioned. In <strong>2007</strong>, the stock<br />
suffered a slight dip resulting from the struggling<br />
German construction business generating a loss of<br />
EUR130m. In our view, this area is not really<br />
relevant for the stock’s valuation as the <strong>European</strong><br />
construction business accounts for less than 3% of<br />
Hochtiefs EV in our sum-of-the-parts valuation.<br />
This indicates a clear mispricing, in our view, as<br />
the remaining segments should be valued higher<br />
than EUR0.8bn (see valuation section). One other<br />
point of note is that the airport stake alone has a<br />
value of at least EUR1.3bn (HSBCe): this would<br />
be sufficient to purchase the project development<br />
business, the US <strong>and</strong> <strong>European</strong> construction<br />
businesses, with EUR0.5bn left over in a<br />
hypothetical break-up scenario.<br />
Catalysts<br />
Main catalysts in our view could be:<br />
Further unexpected operational improvements<br />
at Leighton, mainly due to the Al Habtoor<br />
deal (there should be a significant earnings<br />
contribution from this already in <strong>2008</strong>)<br />
Successful airport participations in <strong>2008</strong><br />
(Lisbon, Prague)<br />
New larger PPP deals (schools, toll roads)<br />
Large infrastructure or construction deals in<br />
the CEE (including Russia, for example the<br />
Olympic games in Sotchi 2012)<br />
The realisation of key projects from the<br />
aurelis portfolio<br />
The main driver for the share price in the last two<br />
years has been Leighton’s strong performance:<br />
The increase in market value of the Leighton<br />
stake over that period amounted as of 11 October<br />
<strong>2007</strong> to EUR5.4bn, from EUR1.3bn as of 26<br />
September 2005) – but Hochtief’s market cap in<br />
the same period only increased by EUR3.6bn to<br />
EUR6.4bn (as of 10 October <strong>2007</strong>). That means<br />
that the implied value for all the remaining<br />
businesses .has decreased by EUR0.5bn to<br />
EUR0.8bn – despite huge operational<br />
improvements mainly in the airport <strong>and</strong> project<br />
development divisions.<br />
43
Mid cap<br />
<strong>European</strong> <strong>small</strong> <strong>and</strong> <strong>mid</strong> <strong>caps</strong><br />
17 October <strong>2007</strong><br />
abc<br />
Valuation<br />
Owing to Hochtiefs diversified business profile,<br />
we think that a sum-of-the-parts analysis is the<br />
most appropriate valuation method. We use<br />
varying methods to arrive at a fair value for each<br />
business line (for more details see our report<br />
“Further upside potential from undervalued units”<br />
published 24 September).<br />
We value Airports with the NAV provided by the<br />
company. For the development business we use<br />
various discounted earnings models; for Leighton<br />
we use the current market valuation, while we<br />
assume multiple valuations both for Hochtief<br />
Americas <strong>and</strong> Europe. As a result, we get a new<br />
target price of EUR108 (old EUR101); this<br />
adjustment reflects the recent increase in<br />
Leighton’s share price<br />
We do not include any conglomerate discount as<br />
Hochtief’s business structure enables the company<br />
to generate interesting synergy effects. Thus, we<br />
believe a premium to our target price would be<br />
more appropriate.<br />
Investment risks<br />
We believe that major risks to our view include:<br />
A slowing in Leighton`s infrastructure <strong>and</strong><br />
contract mining business<br />
A slower-than-expected order intake in the<br />
PPP business<br />
Ongoing problems in the German<br />
construction business<br />
A recession in the US, which would affect the<br />
valuation of Turner<br />
Increasing credit crunch discussions<br />
Sum-of-the-parts valuation <strong>2007</strong>e<br />
Business unit (in EURm) Method <strong>and</strong> assumptions<br />
1 Airports 1,252<br />
Airports 1,244 Internally-calculated NPV by Hochtief as of 31 December <strong>2007</strong><br />
Transport & Logistic Consultancy Ltd. 8 EV= P/S ratio of 2.0 for <strong>2007</strong><br />
2 Development 1,415<br />
PPP projects 703 NPV, rollover to <strong>2007</strong><br />
aurelis 302 Net value increase based on <strong>2008</strong> results of our model<br />
Facility management, Asset Management, Project Development 411 EV/EBIT <strong>2008</strong>e 10x, PPP solutions expected to deliver a breakeven EBIT in <strong>2008</strong>e<br />
3 Asia Pacific 4,883<br />
Leighton 4,883 Discount of 10% on current price<br />
4 Americas 611<br />
Turner 589 EV/EBIT <strong>2008</strong>e 8.0x (America peer group)<br />
Hochtief do Brasil 22 2x book value of equity 2006, 91.5% stake<br />
Construction Europe 200 10x EBT <strong>2008</strong>e, basis valuation of <strong>European</strong> construction companies<br />
5 Enterprise value (1-5) 8,361<br />
6 Cash & cash equivalents 2,076 as of 30 June <strong>2007</strong><br />
7 -Correction of net cash (Leighton) -400 as estimated to avoid double accounting<br />
-Pledged marketable securities -36 as of 30 June <strong>2007</strong><br />
-Debt -1,169 as of 30 June <strong>2007</strong><br />
10 -Prepayments -300 as of 30 June <strong>2007</strong><br />
11 -Pension provisions -33 as of 30 June <strong>2007</strong><br />
12 -Corporate functions -895 EV/EBIT <strong>2008</strong>e 10x<br />
13 Implied equity value (6-14) 7,604<br />
14 Conglomerate discount 0%<br />
15 Equity target value (12)*[1-(13)] 7604<br />
No. of shares (million) 70.00<br />
Target price per share 108<br />
Current share price 91.1<br />
Potential return +18.6%<br />
Source: company data, HSBC estimates<br />
44
Mid cap<br />
<strong>European</strong> <strong>small</strong> <strong>and</strong> <strong>mid</strong> <strong>caps</strong><br />
17 October <strong>2007</strong><br />
abc<br />
Financials & valuation: Hochtief<br />
Financial statements<br />
Year to 12/2006a 12/<strong>2007</strong>e 12/<strong>2008</strong>e 12/2009e<br />
Profit & loss summary (EURm)<br />
Revenue 15508.0 15910.2 16305.4 17454.6<br />
EBITDA 651.8 712.3 845.2 869.6<br />
Depreciation & amortisation -324.5 -321.9 -360.0 -360.0<br />
Operating profit/EBIT 327.3 390.4 485.2 509.6<br />
Net interest 24.8 38.7 22.3 22.3<br />
PBT 338.1 422.6 507.4 531.9<br />
HSBC PBT 338.1 422.6 507.4 531.9<br />
Taxation -136.7 -165.5 -208.1 -218.1<br />
Net profit 89.1 106.6 156.1 158.7<br />
HSBC net profit 89.1 106.6 156.1 158.7<br />
Cash flow summary (EURm)<br />
Cash flow from operations 490.9 581.8 661.8 520.3<br />
Capex -263.7 -370.0 -390.0 -390.0<br />
Cash flow from investment -362.3 -605.0 -420.0 -420.0<br />
Dividends -63.0 -77.0 -84.0 -91.0<br />
Change in net debt -486.8 228.0 -27.9 -9.9<br />
FCF equity 471.1 225.7 274.2 297.7<br />
Balance sheet summary (EURm)<br />
Intangible fixed assets 397.0 412.0 427.0 442.0<br />
Tangible fixed assets 847.0 905.1 945.1 985.1<br />
Current assets 5942.6 5578.8 5925.8 6193.3<br />
Cash & others 2328.1 1876.0 2131.0 2131.0<br />
Total assets 8355.5 8264.8 8661.8 8989.2<br />
Operating liabilities 3880.8 3975.2 4067.9 4337.6<br />
Gross debt 1077.2 853.1 1080.2 1070.3<br />
Net debt -1250.9 -1022.9 -1050.8 -1060.7<br />
Shareholders funds 1812.0 1841.6 1913.8 1981.4<br />
Invested capital 1677.1 1744.1 1798.3 1851.1<br />
Ratio, growth <strong>and</strong> per share analysis<br />
Year to 12/2006a 12/<strong>2007</strong>e 12/<strong>2008</strong>e 12/2009e<br />
Y-o-y % change<br />
Revenue 13.6 2.6 2.5 7.0<br />
EBITDA -0.1 9.3 18.7 2.9<br />
Operating profit -10.6 19.3 24.3 5.0<br />
PBT 2.7 25.0 20.1 4.8<br />
HSBC EPS 41.5 19.7 46.4 1.6<br />
Ratios (%)<br />
Revenue/IC (x) 8.6 9.3 9.2 9.6<br />
ROIC 10.8 13.9 16.2 16.5<br />
ROE 5.0 5.8 8.3 8.1<br />
ROA 2.9 3.8 4.3 4.3<br />
EBITDA margin 4.2 4.5 5.2 5.0<br />
Operating profit margin 2.1 2.5 3.0 2.9<br />
EBITDA/net interest (x)<br />
Net debt/equity -53.2 -43.0 -42.9 -42.1<br />
Net debt/EBITDA (x) -1.9 -1.4 -1.2 -1.2<br />
CF from operations/net debt<br />
Per share data (EUR)<br />
EPS Rep (fully diluted) 1.27 1.52 2.23 2.27<br />
HSBC EPS (fully diluted) 1.27 1.52 2.23 2.27<br />
DPS 1.10 1.20 1.30 1.40<br />
NAV 25.89 26.31 27.34 28.31<br />
Valuation data<br />
Overweight<br />
Year to 12/2006a 12/<strong>2007</strong>e 12/<strong>2008</strong>e 12/2009e<br />
EV/sales 0.3 0.3 0.3 0.2<br />
EV/EBITDA 7.8 7.1 6.0 4.0<br />
EV/IC 3.0 2.9 2.8 1.9<br />
PE* 71.6 59.8 40.8 40.2<br />
P/NAV 3.5 3.5 3.3 3.2<br />
FCF yield (%) 7.5 3.7 4.5 6.6<br />
Dividend yield (%) 1.2 1.3 1.4 1.5<br />
Note: * = Based on HSBC EPS (fully diluted)<br />
Issuer information<br />
Share price (EUR) 91.10 Target price (EUR) 108.00 Potent'l tot rtn (%) 18.6<br />
Reuters (Equity) HOTG.DE Bloomberg (Equity) HOT GR<br />
Market cap (USDm) 8145.1 Market cap (EURm) 5747.5<br />
Free float (%) 68.7 Enterprise value (EURm) 5069.8<br />
Country Germany Sector Construction & Engineering<br />
Analyst Thomas Teetz Contact 49 211 9102353<br />
Price relative<br />
102<br />
92<br />
82<br />
72<br />
62<br />
52<br />
42<br />
42<br />
Oct-06 Apr-07 Oct-07<br />
Hochtief Rel to DAX-100<br />
Source: HSBC<br />
Note: price at close of 12 Oct <strong>2007</strong><br />
102<br />
92<br />
82<br />
72<br />
62<br />
52<br />
45
Mid cap<br />
<strong>European</strong> <strong>small</strong> <strong>and</strong> <strong>mid</strong> <strong>caps</strong><br />
17 October <strong>2007</strong><br />
abc<br />
Ingenico<br />
Solid fundamentals <strong>and</strong> high entry barriers: Ingenico needs to shift<br />
into high gear to benefit from the ongoing changes in a buoyant<br />
market, we think<br />
We believe current negotiations with Sagem Monetel are potential<br />
strong driver for further margin improvement <strong>and</strong> value creation<br />
Generation of cash flow has only just begun, supporting our<br />
Overweight rating <strong>and</strong> EUR26 target price (21% potential return)<br />
Investment summary<br />
Buoyed by sustained growth in the point of sales<br />
(PoS) terminal markets (CAGR of +8% until from<br />
<strong>2007</strong>-2010e), Ingenico should continue to benefit<br />
from upgrades of installed networks to EMV<br />
(Europay Mastercard Visa st<strong>and</strong>ard) <strong>and</strong> from the<br />
roll-out of electronic payment projects in<br />
emerging markets. Capitalising on its<br />
technological innovation, global coverage <strong>and</strong><br />
strong entrepreneurial spirit, the group’s business<br />
model has escaped unscathed from multiple<br />
management changes in the past few years.<br />
Following the departure of group chairman, Amedeo<br />
d’Angelo – the man who put the group back on its<br />
feet – Ingenico is now looking to accelerate growth<br />
in order to: 1) win back its position as global leader<br />
in the payment-card terminal market via the<br />
acquisition of Safran’s PoS terminals business<br />
(valued at EUR3 per share according to our<br />
estimates); <strong>and</strong> 2) move up the value chain through<br />
services <strong>and</strong> software integration.<br />
With a strong recovery in volumes expected by<br />
the company in H2, we believe that the efforts<br />
made to improve the gross margin (up 350bp in<br />
H1 <strong>2007</strong>) will continue to yield profitability.<br />
According to our estimates, gross margin could<br />
advance at a strong pace, possibly climbing 300bp<br />
in H2 <strong>2007</strong> from the H2 2006 level to reach<br />
nearly 45% before indirect costs. We reiterate our<br />
Overweight rating <strong>and</strong> leave our EUR26 target<br />
price unchanged (excluding the planned link-up<br />
with Sagem).<br />
Key facts ____________________Financial summary _____________________ ___________ Valuation summary ___________<br />
Analyst: Christophe Quarante<br />
Year to Revenue EBITDA HSBC HSBC HSBC Yield HSBC EV/ EV/IC ROIC HSBC<br />
Tel: +33 (0) 1 56 52 43 12<br />
(EURm) (EURm) net profit EPS EPS growth (%) PE (x) EBITDA (x) (%) REP (x)<br />
Email: christophe.quarante@hsbc.com<br />
(EURm) (EUR) (%)<br />
(x)<br />
Current price (EUR) 21.6 12/2006a 506.2 37.9 16.2 0.52 -138.5 0.0 41.6 20.9 3.7 10.6 3.6<br />
Target price (EUR) 26.0 12/<strong>2007</strong>e 572.5 61.7 33.6 1.03 97.9 0.0 21.1 12.4 3.3 17.1 2.0<br />
Mkt cap (EURm) 706.0 12/<strong>2008</strong>e 641.2 88.1 48.5 1.48 44.3 0.0 14.6 8.3 3.2 23.3 1.4<br />
Bloomberg ING FP 12/2009e 723.6 107.6 61.0 1.86 25.9 0.0 11.6 6.5 2.9 27.4 1.1<br />
Reuters<br />
INGC.PA<br />
Source: company data, HSBC estimates<br />
46
Mid cap<br />
<strong>European</strong> <strong>small</strong> <strong>and</strong> <strong>mid</strong> <strong>caps</strong><br />
17 October <strong>2007</strong><br />
abc<br />
Company profile<br />
A group built on external growth<br />
From the outset, Ingenico has built up its market<br />
positions through external growth, a strategy that has<br />
allowed the group to develop more quickly. For the<br />
most part, the group carries out acquisitions to build<br />
market share. The group’s most recent acquisitions<br />
are listed in the chart below.<br />
Major acquisitions carried out by Ingenico (consolidated<br />
sales)<br />
Source: Ingenico<br />
After the appointment of chairman Amedeo<br />
d’Angelo in 2005, the top priorities were to: 1)<br />
reposition the group in more value-added services,<br />
2/ gain market share, <strong>and</strong> 3) restore profitability.<br />
Repositioning beginning with<br />
MoneyLine acquisition<br />
As PoS terminal market growth trends go, the<br />
value of downstream products <strong>and</strong> services in<br />
particular (ie, application software <strong>and</strong> services<br />
platforms) is rising. The acquisition of<br />
MoneyLine (EV/sales 2006e: 1.6x; EV/EBIT<br />
2006e: 8.9x) in 2006 gave Ingenico access to this<br />
market (EUR1.3bn in <strong>2008</strong>e, estimation from<br />
Ingenico) <strong>and</strong> presented it with many<br />
opportunities in terms of software applications.<br />
On the road to recovery<br />
Since 2005, the group’s reorganisation has<br />
resulted in: 1) mass purchasing; 2) cost reduction,<br />
ie, ‘redesign to cost’[same product made with less<br />
components], reduction of product-sourcing costs;<br />
<strong>and</strong>, finally, 3) the refocusing on the supply chain<br />
<strong>and</strong> its impact on lowering indirect charges.<br />
Thanks to such measures, a 410bp improvement<br />
was recorded from 2005 to 2006. The contribution<br />
of charges breaks down as follows: R&D (-1.5%<br />
of revenue), marketing expenses (-1%) <strong>and</strong><br />
administrative costs (-1.6% of revenue). This<br />
positive trend is accelerating, with a further gross<br />
margin improvement in H1 <strong>2007</strong> (up 350bp).<br />
Sagem Monetel: a real<br />
opportunity for the group<br />
On 26 July <strong>2007</strong>, Ingenico announced that<br />
negotiations to acquire Sagem Monetel (part of<br />
the Safran Group) were in advanced stages.<br />
According to our analysis, the planned merger<br />
between these two companies implies synergies of<br />
around EUR30m (ie, 3.5% of combined 2009<br />
revenues) made possible thanks to three areas of<br />
cost rationalisation: R&D (0.8% of 2009e sales);<br />
sales <strong>and</strong> marketing (1.2%); <strong>and</strong><br />
overheads/administrative costs (1.5%). This<br />
operation, valued at EUR3 per share according to<br />
our estimates, should strongly enhance the EPS of<br />
the new entity by 26%, excluding any debt<br />
inherited from Sagem Monetel.<br />
47
Mid cap<br />
<strong>European</strong> <strong>small</strong> <strong>and</strong> <strong>mid</strong> <strong>caps</strong><br />
17 October <strong>2007</strong><br />
abc<br />
Details of gross margin trend between H1 2005 <strong>and</strong> H1 <strong>2007</strong><br />
50.00%<br />
Prospective operating margin trends (% sales)<br />
50.00%<br />
40.00%<br />
40.00%<br />
30.00%<br />
30.00%<br />
20.00%<br />
20.00%<br />
10.00%<br />
10.00%<br />
0.00%<br />
H1 2005 H2 2005 2005 H1 2006 H2 2006 2006 H1 <strong>2007</strong><br />
0.00%<br />
FY 04 FY 05 FY 06 FY 07e FY 08e FY 09e<br />
PoS Gross margin<br />
Gross margin<br />
-10.00%<br />
Operating marginn<br />
Gross margin<br />
R&D Overheads & Adm. Sales & Marketing<br />
Gross margin after indirect costs Soft & Sces gross margin -20.00%<br />
Source: Ingenico<br />
Source: Ingenico<br />
Forecast profit <strong>and</strong> loss of Ingenico-Sagem Monetel<br />
EURm <strong>2007</strong>e <strong>2008</strong>e 2009e<br />
Revenue – Sagem Monetel 170 200 230<br />
% change 41.70% 17.65% 15.00%<br />
Revenue – Ingenico 543.4 602.0 664.6<br />
% change 7.35% 10.79% 10.41%<br />
Less market share loss -5.0 -20.0 -35.0<br />
Total revenue 708.4 782.0 859.6<br />
EBIT – Sagem Monetel 18.70 24.00 28.75<br />
% of revenue 11.00% 12% 12.50%<br />
EBIT – Ingenico 50.4 73.9 88.7<br />
% of revenue 9.27% 12.28% 13.35%<br />
Total EBIT 68.57 95.48 112.87<br />
% of revenue 9.68% 12.21% 13.13%<br />
Pre-tax synergy 1 15 30<br />
Post-tax synergy 0.7 10.5 21<br />
Net profit – Ingenico 32.21 47.52 58.22<br />
Net profit –Sagem Monetel 13.09 16.80 20.13<br />
Total net profit 45.80 74.00 97.80<br />
Number of pre-operation<br />
32.76 32.76 32.76<br />
shares (millions)<br />
EPS pre-operation (EUR) 0.98 1.45 1.78<br />
Number of post-operation 43.68 43.68 43.68<br />
shares (millions)<br />
EPS post-operation (EUR) 1.05 1.69 2.24<br />
Enhancement/dilution 6.64% 16.79% 26.00%<br />
Source: company data, HSBC estimates<br />
Catalysts<br />
Regarding Ingenico’s prospects for gross margin<br />
growth, we believe the following areas are likely<br />
sources of improvement:<br />
Continued streamlining <strong>and</strong> building of a<br />
product platform to st<strong>and</strong>ardise the production<br />
process. For example, reducing the number of<br />
motherboards, as well as lowering the number<br />
of product references to fewer than 200.<br />
Streamlining the supply chain through:<br />
1) initiatives targeting distribution channels,<br />
<strong>and</strong> 2) the reallocation of manufacturing assets<br />
to improve the flexibility of outsourced<br />
electronic components, which will,<br />
furthermore, be produced in low-cost markets.<br />
We believe that the Ingenico share price will be<br />
driven by three powerful catalysts:<br />
Continued growth with or without any<br />
acquisitions. Sagem Monetel, the most likely<br />
operation, would not only strengthen<br />
Ingenico’s R&D facility, but in our view offers<br />
an excellent fit in terms of product mix <strong>and</strong><br />
would give Ingenico faster access to new PoS<br />
terminal markets. Without any acquisitions, we<br />
believe Ingenico should still benefit from the<br />
growth in the PoS terminal markets (CAGR of<br />
+8% until 2010e).<br />
Improvements in operating margin through<br />
the synergies generated by the potential<br />
Sagem Monetel merger <strong>and</strong>, in particular, the<br />
integration of services into the group’s PoS<br />
terminal offering (notably for applications<br />
software)<br />
Value creation generated by strategic<br />
refocusing, the progressive repositioning of the<br />
group on the value chain (client-server) <strong>and</strong><br />
optimised free-cash-flow generation.<br />
48
Mid cap<br />
<strong>European</strong> <strong>small</strong> <strong>and</strong> <strong>mid</strong> <strong>caps</strong><br />
17 October <strong>2007</strong><br />
abc<br />
Valuation<br />
Our DCF valuation for Ingenico is based on the<br />
following assumptions: 1) WACC of 10 %; 11.6%<br />
cost of capital (long bond yield of 4.4%, market<br />
premium of 4.5%, a beta of 1.6) <strong>and</strong> normative<br />
gearing at 20%, <strong>and</strong> 2) an average terminal<br />
growth rate between 1% <strong>and</strong> 3%. Our DCF gives<br />
a target price of EUR26, which implies a total<br />
potential return of 21%, above the Neutral b<strong>and</strong> of<br />
our model, which is 3.9-13.9%. We, therefore,<br />
reiterate our Overweight rating on the stock.<br />
Investment risks<br />
We have identified, except for the possible failure<br />
of the announced deal with Sagem Monetel, three<br />
major downside risks: 1) exchange rates – the<br />
company bills its clients in euros, but pays some<br />
of its suppliers in US dollars (around 40% of<br />
purchases), 2) rising interest rates, given our<br />
DCF-based valuation method, 3) a global<br />
economic downturn having a negative affect on<br />
secure payments.<br />
49
Mid cap<br />
<strong>European</strong> <strong>small</strong> <strong>and</strong> <strong>mid</strong> <strong>caps</strong><br />
17 October <strong>2007</strong><br />
abc<br />
Financials & valuation: Ingenico<br />
Financial statements<br />
Year to 12/2006a 12/<strong>2007</strong>e 12/<strong>2008</strong>e 12/2009e<br />
Profit & loss summary (EURm)<br />
Revenue 506.2 572.5 641.2 723.6<br />
EBITDA 37.9 61.7 88.1 107.6<br />
Depreciation & amortisation -6.4 -8.1 -8.9 -10.8<br />
Operating profit/EBIT 31.5 53.6 79.2 96.9<br />
Net interest -7.8 -5.7 -6.7 -5.6<br />
PBT 23.6 47.9 72.5 91.3<br />
HSBC PBT 23.6 47.9 72.5 91.3<br />
Taxation -7.4 -14.4 -23.9 -30.1<br />
Net profit 16.2 33.4 48.5 61.0<br />
HSBC net profit 16.2 33.4 48.5 61.0<br />
Cash flow summary (EURm)<br />
Cash flow from operations 36.0 29.6 55.3 68.7<br />
Capex -10.3 -12.7 -13.0 -20.0<br />
Cash flow from investment 2.1 -0.6 -12.3 -19.3<br />
Dividends 0.0 -11.3 -11.4 -15.2<br />
Change in net debt -30.5 -25.6 -31.5 -34.2<br />
FCF equity 22.1 8.6 32.3 38.7<br />
Balance sheet summary (EURm)<br />
Intangible fixed assets 111.4 101.4 91.4 81.4<br />
Tangible fixed assets 16.8 22.1 26.2 35.4<br />
Current assets 309.6 359.1 397.2 452.1<br />
Cash & others 67.6 83.8 96.3 123.6<br />
Total assets 459.6 504.4 536.6 590.7<br />
Operating liabilities 155.3 173.5 187.5 202.7<br />
Gross debt 159.4 150.0 131.0 124.0<br />
Net debt 91.8 66.2 34.7 0.4<br />
Shareholders funds 144.1 180.8 217.8 263.7<br />
Invested capital 214.9 225.4 230.9 242.7<br />
Ratio, growth <strong>and</strong> per share analysis<br />
Year to 12/2006a 12/<strong>2007</strong>e 12/<strong>2008</strong>e 12/2009e<br />
Y-o-y % change<br />
Revenue 15.9 13.1 12.0 12.8<br />
EBITDA 63.0 42.8 22.1<br />
Operating profit 70.4 47.7 22.3<br />
PBT 102.8 51.3 25.9<br />
HSBC EPS 96.9 45.0 25.9<br />
Ratios (%)<br />
Revenue/IC (x) 2.5 2.6 2.8 3.1<br />
ROIC 10.6 17.0 23.3 27.4<br />
ROE 13.6 20.6 24.3 25.4<br />
ROA 4.8 7.8 10.2 11.5<br />
EBITDA margin 7.5 10.8 13.7 14.9<br />
Operating profit margin 6.2 9.4 12.3 13.4<br />
EBITDA/net interest (x) 4.8 10.8 13.2 19.2<br />
Net debt/equity 63.7 36.6 15.9 0.2<br />
Net debt/EBITDA (x) 2.4 1.1 0.4 0.0<br />
CF from operations/net debt 39.2 44.7 159.6 15832.8<br />
Per share data (EUR)<br />
EPS Rep (fully diluted) 0.52 1.02 1.48 1.86<br />
HSBC EPS (fully diluted) 0.52 1.02 1.48 1.86<br />
DPS 0.00 0.00 0.00 0.00<br />
NAV 4.60 5.52 6.65 8.05<br />
Valuation data<br />
Overweight<br />
Year to 12/2006a 12/<strong>2007</strong>e 12/<strong>2008</strong>e 12/2009e<br />
EV/sales 1.6 1.3 1.1 1.0<br />
EV/EBITDA 20.9 12.4 8.3 6.5<br />
EV/IC 3.7 3.4 3.2 2.9<br />
PE* 41.6 21.1 14.6 11.6<br />
P/NAV 4.7 3.9 3.2 2.7<br />
FCF yield (%) 3.2 1.2 4.6 5.5<br />
Dividend yield (%) 0.0 0.0 0.0 0.0<br />
Note: * = Based on HSBC EPS (fully diluted)<br />
Issuer information<br />
Share price (EUR) 21.55 Target price (EUR) 26.00 Potent'l tot rtn (%) 20.6<br />
Reuters (Equity) INGC.PA Bloomberg (Equity) ING FP<br />
Market cap (USDm) 1000.5 Market cap (EURm) 706.0<br />
Free float (%) 100 Enterprise value (EURm) 764.9<br />
Country France Sector Electronic Equipment<br />
Analyst Christophe Quarante Contact +33 1 56 52 43 12<br />
Price relative<br />
25<br />
24<br />
23<br />
22<br />
21<br />
20<br />
19<br />
18<br />
17<br />
16<br />
15<br />
Oct-06 Apr-07 Oct-07<br />
Ingenico Rel to SBF-120<br />
Source: HSBC<br />
Note: price at close of 12 Oct <strong>2007</strong><br />
25<br />
24<br />
23<br />
22<br />
21<br />
20<br />
19<br />
18<br />
17<br />
16<br />
15<br />
50
Mid cap<br />
<strong>European</strong> <strong>small</strong> <strong>and</strong> <strong>mid</strong> <strong>caps</strong><br />
17 October <strong>2007</strong><br />
abc<br />
Lanxess<br />
LXS has been transformed into a stable chemicals company…<br />
…with a portfolio that achieves a profitability in line with peers<br />
However, LXS still trades at an unjustified discount; target price of<br />
EUR47.0 implies c32% potential return: Overweight<br />
Investment summary<br />
Higher quality than perceived<br />
Since Lanxess’ spin-off in 2005, management has<br />
done a great deal to transform the business from a<br />
restructuring case into a ‘normal’ specialty<br />
chemicals company. Thanks to extensive<br />
restructuring <strong>and</strong> divestitures, we believe that the<br />
characteristics of the current product portfolio are<br />
better than currently acknowledged by the market.<br />
Exposure to petrochemicals, operating leverage<br />
<strong>and</strong> therefore risk has been reduced significantly<br />
<strong>and</strong> the company’s financing is stable <strong>and</strong> should<br />
be unaffected by the current market turmoil, in<br />
our view.<br />
Furthermore, we are convinced of management’s<br />
focus on value creation with regard to capital<br />
allocation, <strong>and</strong> as a result see acquisitions of <strong>small</strong>-to<br />
<strong>mid</strong>sized businesses as a potential positive catalyst<br />
for the share price. The company’s strong balance<br />
sheet <strong>and</strong> the fact that current market conditions<br />
make it difficult for private equity to compete for<br />
potential takeover targets should be supportive for<br />
LXS in this regard.<br />
Profitability in line with peers…<br />
Thanks to the ongoing operational improvements,<br />
management recently brought its 2009 target of<br />
achieving a margin in line with its peers one year<br />
forward. Our (unchanged) estimates reflect this<br />
target <strong>and</strong> see an EBITDA margin improvement<br />
from 9.7% in 2006, to 12.7% for 2009e, implying<br />
an EBITDA CAGR of c6% (07-09e).<br />
…but Lanxess still trades at a discount<br />
Although Lanxess is now on a par with its <strong>European</strong><br />
peers in terms of profitability, the market still assigns<br />
a significant discount of more than 20% based on<br />
<strong>2008</strong>-09e PE <strong>and</strong> EV/EBITDA multiples. Despite or<br />
just because of the continuous deleveraging of the<br />
balance sheet, we do not see the discount as justified.<br />
Key facts ____________________Financial summary _____________________ ___________ Valuation summary ___________<br />
Analyst: Sebastian Satz<br />
Year to Revenue EBITDA HSBC HSBC HSBC Yield HSBC EV/ EV/ IC ROIC HSBC<br />
Tel: +49 211 910 2373<br />
(EURm) (EURm) net profit EPS EPS growth (%) PE EBITDA (x) (%) REP<br />
Email: sebastian.satz@hsbc.de<br />
(EURm) (EUR)<br />
(%)<br />
(x) (x)<br />
(x)<br />
Current price (EUR) 35.5 12/2006a 6,944.0 675.0 229.1 2.71 102.8 0.7 13.1 5.8 2.2 16.7 1.0<br />
Target price (EUR) 47.0 12/<strong>2007</strong>e 6,545.9 713.5 260.4 3.13 15.6 0.7 11.4 5.3 2.2 18.9 0.9<br />
Mkt cap (EURm) 3,006.6 12/<strong>2008</strong>e 6,132.4 767.1 305.5 3.67 17.3 1.4 9.7 4.7 2.0 20.6 0.8<br />
Bloomberg LXS GR 12/2009e 6,349.9 807.2 335.1 4.03 9.7 1.6 8.8 4.1 1.9 21.5 0.7<br />
Reuters<br />
LXSG.DE<br />
Source: HSBC<br />
51
Mid cap<br />
<strong>European</strong> <strong>small</strong> <strong>and</strong> <strong>mid</strong> <strong>caps</strong><br />
17 October <strong>2007</strong><br />
abc<br />
Lanxess — organisational structure, <strong>2007</strong>*<br />
Performance Polymers<br />
(45% of sales / margin level: )<br />
Butyl Rubber (11% / )<br />
Polybutadiene Rubber (9% / )<br />
Technical Rubber Products (11% / )<br />
Semi-Crystalline Products (14% / )<br />
Advanced Intermediates<br />
(20% / )<br />
Basic Chemicals (15% / )<br />
Saltigo (5% / )<br />
Performance Chemicals<br />
(35% / )<br />
Material Protection Products (3% / )<br />
Inorganic Pigments (7% / )<br />
Functional Chemicals (6% / )<br />
Leather (7% / )<br />
RheinChemie (4% / )<br />
Rubber Chemicals (5% / )<br />
Ion Exchange Resins (3% / )<br />
*Note: The arrow indicates the margin level (EBITDA pre-exceptionals 2006): 10-15%, below 10%, more than 15%<br />
Source: Lanxess, HSBC estimates<br />
Consequentially, we reiterate our Overweight rating<br />
as well as our price target of EUR47, which implies<br />
a potential return of c32%.<br />
Company profile – at a glance<br />
Lanxess is a German-based, globally operating<br />
chemicals company with a broad portfolio ranging<br />
from basic to fine chemicals. A member of the<br />
MDax, it was spun-off from Bayer in 2004 <strong>and</strong><br />
publicly listed in January 2005. It is among Europe’s<br />
major producers of chemical <strong>and</strong> polymer products.<br />
Originally, the company operated through four<br />
divisions (Performance Rubber, Engineering<br />
Plastics, Chemical Intermediates <strong>and</strong> Performance<br />
Chemicals). On 25 September <strong>2007</strong>, management<br />
announced that it would reorganise its remaining 13<br />
business units into three segments, following its<br />
latest divestment of the Lustran Polymers business<br />
unit in June <strong>2007</strong>. Lanxess now operates in three<br />
divisions, namely Performance Polymers, Advanced<br />
Intermediates <strong>and</strong> Performance Chemicals, with the<br />
first being the most important in terms of revenues.<br />
Some 46% of Lanxess’ assets <strong>and</strong> c50% of its<br />
c16,000 employees are based in Germany, although<br />
its revenues are less biased towards its domestic<br />
market. Asia, as one of the company’s main growth<br />
drivers, is of increasing importance within the<br />
company’s sales split <strong>and</strong> now accounts for c18% of<br />
group revenues.<br />
Lanxess —– sales by division, FY 2006 Lanxess — sales by region, FY 2006<br />
Adv anced<br />
Intermediates<br />
19%<br />
Performance<br />
Poly mers<br />
44%<br />
Performance<br />
Chemicals<br />
37%<br />
Asia/Pacific<br />
18%<br />
Americas<br />
26%<br />
Germany<br />
23%<br />
EMEA w /o<br />
Germany<br />
33%<br />
Source: Lanxess, HSBC<br />
Source: Lanxess, HSBC<br />
52
Mid cap<br />
<strong>European</strong> <strong>small</strong> <strong>and</strong> <strong>mid</strong> <strong>caps</strong><br />
17 October <strong>2007</strong><br />
abc<br />
Investment case<br />
Lanxess has been transformed in record time from<br />
a highly cyclical, barely profitable restructuring<br />
case into a more stable specialty chemicals group<br />
that is now on a par with its <strong>European</strong> peers. In<br />
the past two years the company implemented<br />
extensive restructuring programmes –the effects<br />
from a significant portion of which are yet to<br />
come in – <strong>and</strong> divested underperforming business<br />
units. In our view, the vast majority of Lanxess’<br />
business units now operate either in markets with<br />
positive growth prospects, a disciplined<br />
supply/dem<strong>and</strong> situation <strong>and</strong>/or where Lanxess<br />
has pricing power. Despite all the operational <strong>and</strong><br />
structural improvements, the stock still trades at a<br />
significant, <strong>and</strong> in our view, unjustified, discount.<br />
Catalysts<br />
M&A activity: we see potential acquisitions as<br />
the most important possible catalyst for the stock.<br />
Here, Lanxess should benefit from its strong<br />
balance sheet <strong>and</strong> the turbulence in the credit<br />
markets, which should make it difficult for private<br />
equity to compete for potential takeover targets.<br />
Moderate re-gearing: While we see a low<br />
gearing level as key to successfully weathering a<br />
potential downturn, some investors perceive<br />
Lanxess’ balance sheet with a net debt/equity<br />
Mid cap<br />
<strong>European</strong> <strong>small</strong> <strong>and</strong> <strong>mid</strong> <strong>caps</strong><br />
17 October <strong>2007</strong><br />
abc<br />
Financials & valuation: Lanxess<br />
Financial statements<br />
Year to 12/2006a 12/<strong>2007</strong>e 12/<strong>2008</strong>e 12/2009e<br />
Profit & loss summary (EURm)<br />
Revenue 6944.0 6545.9 6132.4 6349.9<br />
EBITDA 675.0 713.5 767.1 807.2<br />
Depreciation & amortisation -254.0 -246.1 -240.8 -248.3<br />
Operating profit/EBIT 421.0 467.4 526.4 558.9<br />
Net interest -39.0 -18.0 -9.0 3.5<br />
PBT 287.0 191.4 407.8 481.2<br />
HSBC PBT 332.0 397.9 464.3 507.7<br />
Taxation -85.0 -57.4 -130.5 -154.0<br />
Net profit 197.0 128.8 271.8 321.5<br />
HSBC net profit 229.1 260.4 305.5 335.1<br />
Cash flow summary (EURm)<br />
Cash flow from operations 537.0 511.6 513.0 600.6<br />
Capex -267.0 -298.6 -282.2 -292.7<br />
Cash flow from investment -228.0 -298.6 -282.2 -292.7<br />
Dividends -21.2 -21.2 -19.3 -40.8<br />
Change in net debt -146.0 -127.9 -196.4 -252.1<br />
FCF equity 354.0 489.5 307.3 319.4<br />
Balance sheet summary (EURm)<br />
Intangible fixed assets 41.0 41.0 41.0 41.0<br />
Tangible fixed assets 1559.0 1611.5 1652.9 1697.4<br />
Current assets 2362.0 2097.0 2181.7 2247.0<br />
Cash & others 171.0 122.0 122.0 122.0<br />
Total assets 4205.0 3992.5 4118.7 4228.3<br />
Operating liabilities 2038.0 1909.3 1997.8 2083.0<br />
Gross debt 1202.0 1025.1 828.7 576.6<br />
Net debt 1031.0 903.1 706.7 454.6<br />
Shareholders funds 1403.0 1463.4 1694.5 1967.7<br />
Invested capital 1753.0 1718.2 1755.9 1780.3<br />
Ratio, growth <strong>and</strong> per share analysis<br />
Year to 12/2006a 12/<strong>2007</strong>e 12/<strong>2008</strong>e 12/2009e<br />
Y-o-y % change<br />
Revenue -2.9 -5.7 -6.3 3.5<br />
EBITDA 16.2 5.7 7.5 5.2<br />
Operating profit 26.8 11.0 12.6 6.2<br />
PBT -33.3 113.0 18.0<br />
HSBC EPS 102.8 15.6 17.3 9.7<br />
Ratios (%)<br />
Revenue/IC (x) 3.9 3.8 3.5 3.6<br />
ROIC 16.7 18.9 20.6 21.5<br />
ROE 17.3 18.2 19.4 18.3<br />
ROA 5.1 3.6 7.0 7.8<br />
EBITDA margin 9.7 10.9 12.5 12.7<br />
Operating profit margin 6.1 7.1 8.6 8.8<br />
EBITDA/net interest (x) 17.3 39.6 85.2<br />
Net debt/equity 72.2 60.5 40.8 22.6<br />
Net debt/EBITDA (x) 1.5 1.3 0.9 0.6<br />
CF from operations/net debt 52.1 56.6 72.6 132.1<br />
Per share data (EUR)<br />
EPS Rep (fully diluted) 2.33 1.55 3.27 3.86<br />
HSBC EPS (fully diluted) 2.71 3.13 3.67 4.03<br />
DPS 0.25 0.23 0.49 0.58<br />
NAV 16.58 17.59 20.37 23.65<br />
Valuation data<br />
Overweight<br />
Year to 12/2006a 12/<strong>2007</strong>e 12/<strong>2008</strong>e 12/2009e<br />
EV/sales 0.6 0.6 0.6 0.5<br />
EV/EBITDA 5.7 5.2 4.6 4.1<br />
EV/IC 2.2 2.2 2.0 1.8<br />
PE* 13.1 11.4 9.7 8.8<br />
P/NAV 2.1 2.0 1.7 1.5<br />
FCF yield (%) 12.5 17.3 10.8 11.3<br />
Dividend yield (%) 0.7 0.7 1.4 1.6<br />
Note: * = Based on HSBC EPS (fully diluted)<br />
Issuer information<br />
Share price (EUR) 35.53 Target price (EUR) 47.00 Potent'l tot rtn (%) 32.3<br />
Reuters (Equity) LXSG.DE Bloomberg (Equity) LXS GR<br />
Market cap (USDm) 4189.4 Market cap (EURm) 2956.2<br />
Free float (%) 100 Enterprise value (EURm) 3730.6<br />
Country Germany Sector Chemicals<br />
Analyst Sebastian Satz Contact +49 211 910 2373<br />
Price relative<br />
49<br />
44<br />
39<br />
34<br />
29<br />
24<br />
24<br />
Oct-06 Apr-07 Oct-07<br />
Lanxess Rel to DAX-100<br />
Source: HSBC<br />
Note: price at close of 12 Oct <strong>2007</strong><br />
49<br />
44<br />
39<br />
34<br />
29<br />
54
Mid cap<br />
<strong>European</strong> <strong>small</strong> <strong>and</strong> <strong>mid</strong> <strong>caps</strong><br />
17 October <strong>2007</strong><br />
abc<br />
Metka<br />
In our view, Metka remains a promising vehicle with which to play<br />
the imminent liberalisation of the Greek electricity sector<br />
Consistent financial performer; keeps delivering on expectations<br />
Target price of EUR20.5 (13% potential total return); Overweight<br />
Investment summary<br />
Metka, c52%-owned by Mytilineos Group (MG),<br />
is involved mainly in the EPC (engineeringprocurement-construction)<br />
of power plants.<br />
Overall, we believe that Metka is a consistent<br />
financial performer that keeps delivering on both<br />
our <strong>and</strong> market expectations. We also expect<br />
potential positive newsflow (new project awards<br />
both in Greece <strong>and</strong> abroad) to boost sentiment <strong>and</strong><br />
financials. In our view, Metka remains a<br />
promising vehicle with which to play the<br />
imminent liberalisation of the Greek electricity<br />
sector, while continued international expansion<br />
further improves earnings visibility. On balance,<br />
we believe Metka’s strong backlog, resilient<br />
margins <strong>and</strong> bright prospects are not fully priced<br />
in at current levels.<br />
Strong Q2/H1 <strong>2007</strong> results<br />
Metka released in August a very strong set of H1<br />
interims, which were above our estimates across<br />
the board (with the exception of the top line) on<br />
the back of impressive gross margin performance<br />
<strong>and</strong> cost containment. Metka recorded net profit<br />
of EUR13.5m in Q2 <strong>2007</strong>, matching last year’s<br />
record-high quarterly performance.<br />
Attractive valuation – Overweight<br />
Metka’s share price has gained 86% in absolute<br />
terms y-t-d, outperforming the market by 52%, on<br />
constant positive newsflow <strong>and</strong> strong results.<br />
Having said that, Metka’s relative valuation<br />
against its admittedly much larger peers continues<br />
to look attractive. Metka trades at a discount on<br />
<strong>2007</strong>-09e PE <strong>and</strong> EV/EBITDA, while offering a<br />
significantly higher dividend yield (in <strong>2008</strong>e,<br />
Metka’s DY of 4.6% is among the highest in our<br />
Greek universe, on our estimates), but a weaker<br />
growth outlook (2006-09e EPS CAGR of 14.8%,<br />
versus 18.3% for the peer group).<br />
Key facts ___________________ Financial summary_____________________ ___________Valuation summary____________<br />
Analyst: Vangelis Karanikas<br />
Year to Revenue EBITDA HSBC HSBC HSBC Yield HSBC EV/ EV/ ROIC HSBC<br />
Tel: +30 210 6965 211<br />
(EURm) (EURm) net profit EPS EPS growth (%) PE EBITDA IC (%) REP<br />
Email: vangelis.karanikas@hpss.hsbc.gr<br />
(EURm) (EUR) (%)<br />
(x) (x) (x)<br />
(x)<br />
Current price (EUR) 18.60 12/2006a 294.1 60.8 40.6 0.78 8.7 2.2 23.8 15.8 8.5 45.1 1.7<br />
Target price (EUR) 20.5 12/<strong>2007</strong>e 316.1 70.6 48.3 0.93 19.0 2.7 20.0 13.9 6.2 36.3 1.6<br />
Mkt cap (EURm) 966.3 12/<strong>2008</strong>e 548.8 104.9 75.6 1.46 56.4 4.6 12.8 9.1 5.8 46.3 1.1<br />
Bloomberg METTK GA 12/2009e 494.9 85.8 61.5 1.18 -18.6 4.6 15.7 11.1 5.2 34.8 1.4<br />
Reuters<br />
MTKr.AT<br />
Source: Reuters, HSBC estimates<br />
55
Mid cap<br />
<strong>European</strong> <strong>small</strong> <strong>and</strong> <strong>mid</strong> <strong>caps</strong><br />
17 October <strong>2007</strong><br />
abc<br />
Metka’s sales <strong>and</strong> EBITDA breakdown per project category (IFRS, EURm)<br />
<strong>2007</strong>e % of total <strong>2008</strong>e % of total y-o-y 2009e % of total y-o-y<br />
Sales<br />
EPC/Energy 259.4 82% 446.6 81% 72% 393.0 79% -12%<br />
Defence 20.9 7% 46.2 8% 121% 27.2 5% -41%<br />
Infrastructure* 35.8 11% 56.0 10% 57% 74.7 15% 33%<br />
Total sales 316.1 100% 548.8 100% 74% 494.9 100% -10%<br />
EBITDA ex-management fees<br />
EPC/Energy 58.3 77% 86.7 75% 49% 74.3 76% -14%<br />
Defence 8.2 11% 17.8 15% 117% 9.9 10% -45%<br />
Infrastructure 8.8 12% 11.4 10% 29% 14.0 14% 24%<br />
Total EBITDA ex-mgt fees 75.3 100% 115.9 100% 54% 98.1 100% -15%<br />
EBITDA % ex-mgt fees<br />
EPC/Energy 22.5% 19.4% 18.9%<br />
Defence 39.4% 38.6% 36.2%<br />
Infrastructure 24.5% 20.3% 18.8%<br />
Total EBITDA % ex-mgt fees 23.8% 21.1% 19.8%<br />
*Note that Metka’s subsidiary sales are categorised as infrastructure<br />
Source: HSBC Pantelakis Securities estimates<br />
75<br />
Company profile – at a glance<br />
Metka is the leading electromechanical <strong>and</strong> metal<br />
construction company in Greece, actively engaged<br />
in the energy (construction of thermoelectric,<br />
hydroelectric <strong>and</strong> gas-fired power plants), defence<br />
(co-production of defence systems in co-operation<br />
with foreign manufacturers) <strong>and</strong> infrastructure<br />
(manufacturing of heavy steel constructions <strong>and</strong><br />
integrated electromechanical equipment) sectors.<br />
Metka’s order backlog as at end-H1 <strong>2007</strong> was<br />
cEUR650m, including the Aliveri power plant<br />
project. Energy-related projects account for 91%<br />
of Metka’s backlog, defence accounts for 8% with<br />
the remaining 2% stemming from infrastructure.<br />
To put things into perspective, we expect Metka’s<br />
sales <strong>and</strong> EBITDA margin, ex-management fees,<br />
in <strong>2007</strong>-09e to be largely driven by energy-related<br />
EPC projects (18-20% average margin). The<br />
defence division should provide margin support in<br />
years that defence-related revenues have a more<br />
material contribution to group sales, largely on the<br />
back of the lucrative c40%-margin Leopard project<br />
(8.5% of total <strong>2008</strong>e sales secured by backlog).<br />
We believe that Metka’s low-cost structure <strong>and</strong><br />
experience gives it a considerable competitive<br />
advantage. More importantly, in our view, the<br />
risks for significant medium-term margin<br />
downgrades are low, given the high average<br />
margin of Metka’s EPC project pipeline (20.6%).<br />
Investment case<br />
Overall, our positive view on Metka is based on<br />
the following: a) we are confident that Metka will<br />
Metka : sales by division (FY <strong>2007</strong>e) Metka: EBITDA* by division (FY <strong>2007</strong>e)<br />
Defence<br />
6.6%<br />
22.5% margin 39.4% margin<br />
Defence<br />
10.9%<br />
EPC/Energy<br />
82.1%<br />
Infrastructure<br />
11.3%<br />
EPC/Energy<br />
77.4%<br />
24.5% margin<br />
Infrastructure<br />
11.7%<br />
Source: HSBC estimates<br />
Note: * EBITDA is ex-management fees to MG<br />
Source: HSBC estimates<br />
56
Mid cap<br />
<strong>European</strong> <strong>small</strong> <strong>and</strong> <strong>mid</strong> <strong>caps</strong><br />
17 October <strong>2007</strong><br />
abc<br />
be a major beneficiary of the upcoming domestic<br />
energy market liberalisation, given its excellent<br />
track record <strong>and</strong> expertise in energy projects, b)<br />
MG’s stated strategic focus on energy, the cooperation<br />
agreement with Hellenic Technodomiki<br />
(HT) in thermal power generation <strong>and</strong> the strategic<br />
partnership with Alstom should provide a steady<br />
flow of business for Metka in the medium term,<br />
<strong>and</strong> c) Metka’s international expansion strategy is<br />
now clear <strong>and</strong> we expect it to contribute materially<br />
to group financials post-<strong>2007</strong>.<br />
Catalysts<br />
We see a number of potential pockets of value<br />
that could increase our target price for Metka. In<br />
chronological order, these include:<br />
a) The construction of Endesa Hellas’ EUR800m,<br />
600MW coal-fired power plant, subject to the<br />
granting of the construction licence by the<br />
Development Ministry (EUR0.85/share)<br />
b) The construction of a EUR550m 330MW<br />
lignite-fired power plant, subject to MG <strong>and</strong> HT<br />
winning the Vevi mine tender, which is currently<br />
under way (EUR1.15/share)<br />
c) The completion of Metka’s industrial relocation<br />
project (EUR0.9-1.3/share; however, we do not<br />
expect this to occur in the near future)<br />
d) A potential capital return in 2009e (ie at least<br />
EUR1.0/share, implying a potential return of 6%)<br />
Valuation<br />
In our DCF model, we have used a WACC of 9.1%<br />
<strong>and</strong> a long-term growth rate of 3%. Following the<br />
Aliveri project award, we continue to assume a 33%<br />
success ratio for PPC’s future plant replacement<br />
projects, <strong>and</strong> we also continue to attach a 50%<br />
probability that Endesa Hellas will finally go ahead<br />
with the construction of a 600MW cleantechnology,<br />
coal-fired power plant at a cost of<br />
cEUR800m. On top of that, we assume that Endesa<br />
Hellas will also go ahead with the construction of a<br />
third natural gas-fired CCGT plant in Volos, central<br />
Greece, at a cost of EUR225m, some time in <strong>2008</strong>.<br />
The above projects are included in our valuation<br />
model, but not in our financial estimates.<br />
Our DCF-based target price of EUR20.5/share<br />
implies a one-year potential total return of 12.9%<br />
from current levels, including the FY<strong>2007</strong>e DPS of<br />
EUR0.50 (DY 2.7%). We have an Overweight<br />
rating for Metka. Our TP is based on the assumption<br />
of a 20% long-term (ie post-2010) EBITDA margin<br />
(ex-management fees). We also expect Metka’s<br />
average LT (ie 2011-20) sales to reach EUR700m.<br />
Fair value sensitivity on LT sales <strong>and</strong> EBITDA margin (EUR/share)<br />
___ 2011-20e average sales (EURm) ___<br />
626 662 700 740 783<br />
18.0% 16.6 17.5 18.4 19.4 20.5<br />
19.0% 17.5 18.4 19.5 20.5 21.7<br />
Long-term 20.0% 18.4 19.4 20.5 21.7 22.9<br />
EBITDA % 21.0% 19.3 20.4 21.6 22.8 24.1<br />
22.0% 20.2 21.4 22.6 23.9 25.3<br />
Source: HSBC Pantelakis Securities estimates<br />
Investment risks<br />
The key negative risks to our forecasts <strong>and</strong> rating<br />
are: a) a potential failure by Endesa Hellas to get<br />
the construction licence for the 600MW coal-fired<br />
plant, which would take 4% off our valuation, or<br />
EUR0.8/share; b) a below 33% success rate in<br />
PPC’s future plant recycling programme. The<br />
unlikely scenario of Metka failing to win one out<br />
of three upcoming PPC projects would take 2% off<br />
our valuation, or EUR0.3/share; <strong>and</strong> c) a potential<br />
cancellation of Endesa Hellas’ plans to build a<br />
third natural gas-fired CCGT plant in Volos would<br />
take 3% off our valuation, or EUR0.5/share.<br />
Other negative risks include possible delays in the<br />
liberalisation of the Greek electricity market,<br />
reductions in government defence spending,<br />
weaker-than-anticipated margins, <strong>and</strong> failure to<br />
secure projects in the Balkans together with<br />
Alstom. Finally, human resources capacity<br />
constraints (ie, a failure to secure an adequate<br />
amount of skilled engineers) could result in Metka<br />
turning down potential new projects, especially<br />
outside Greece, or ineffective cost control.<br />
57
Mid cap<br />
<strong>European</strong> <strong>small</strong> <strong>and</strong> <strong>mid</strong> <strong>caps</strong><br />
17 October <strong>2007</strong><br />
abc<br />
Financials & valuation: Metka<br />
Financial statements<br />
Year to 12/2006a 12/<strong>2007</strong>e 12/<strong>2008</strong>e 12/2009e<br />
Profit & loss summary (EURm)<br />
Revenue 294.1 316.1 548.8 494.9<br />
EBITDA 60.8 70.6 104.9 85.8<br />
Depreciation & amortisation -4.9 -4.9 -4.9 -4.8<br />
Operating profit/EBIT 55.9 65.7 100.0 80.9<br />
Net interest 0.0 -0.8 0.9 1.1<br />
PBT 54.9 64.9 100.8 82.0<br />
HSBC PBT 54.9 64.9 100.8 82.0<br />
Taxation -14.4 -16.2 -25.2 -20.5<br />
Net profit 40.6 48.3 75.6 61.5<br />
HSBC net profit 40.6 48.3 75.6 61.5<br />
Cash flow summary (EURm)<br />
Cash flow from operations 11.3 11.1 66.8 47.7<br />
Capex -3.9 -12.0 -4.0 -4.0<br />
Cash flow from investment -1.1 -11.6 -3.6 -3.6<br />
Dividends -20.8 -26.0 -44.2 -44.2<br />
Change in net debt 14.6 23.3 -25.0 0.4<br />
FCF equity 7.7 -0.7 63.9 45.0<br />
Balance sheet summary (EURm)<br />
Intangible fixed assets 8.9 8.9 8.9 8.9<br />
Tangible fixed assets 67.1 74.1 73.2 72.4<br />
Current assets 146.1 185.3 205.1 224.1<br />
Cash & others 8.7 13.2 8.1 7.7<br />
Total assets 225.8 272.1 290.8 309.1<br />
Operating liabilities 100.8 96.6 113.6 114.1<br />
Gross debt 2.2 30.0 0.0 0.0<br />
Net debt/(cash) -6.5 16.8 -8.1 -7.7<br />
Shareholders funds 111.0 133.4 164.9 182.2<br />
Invested capital 112.6 158.6 165.5 183.6<br />
Valuation data<br />
Overweight<br />
Year to 12/2006a 12/<strong>2007</strong>e 12/<strong>2008</strong>e 12/2009e<br />
EV/sales 3.3 3.1 1.7 1.9<br />
EV/EBITDA 15.8 13.9 9.1 11.1<br />
EV/IC 8.5 6.2 5.8 5.2<br />
PE* 23.8 20.0 12.8 15.7<br />
P/NAV 8.7 7.2 5.9 5.3<br />
FCF yield (%) 0.8 -0.1 6.6 4.7<br />
Dividend yield (%) 2.2 2.7 4.6 4.6<br />
Note: * = Based on HSBC EPS (fully diluted)<br />
Issuer information<br />
Share price (EUR) 18.60 Target price (EUR) 20.50 Potent'l tot rtn (%) 12.9<br />
Reuters (Equity) MTKr.AT Bloomberg (Equity) METTK GA<br />
Market cap (USDm) 1,369.4 Market cap (EURm) 966.3<br />
Free float (%) 48 Enterprise value (EURm) 983.1<br />
Country Greece Sector Machinery<br />
Analyst Vangelis Karanikas Contact +30 210 6965 211<br />
Price relative<br />
21<br />
21<br />
19<br />
19<br />
17<br />
17<br />
15<br />
15<br />
13<br />
13<br />
11<br />
11<br />
9<br />
9<br />
7<br />
7<br />
Oct-06 Apr-07 Oct-07<br />
Metka Rel to ATHENS SE<br />
Ratio, growth <strong>and</strong> per share analysis<br />
Year to 12/2006a 12/<strong>2007</strong>e 12/<strong>2008</strong>e 12/2009e<br />
Y-o-y % change<br />
Revenue 38.2 7.5 73.6 -9.8<br />
EBITDA 15.7 16.1 48.6 -18.2<br />
Operating profit 16.4 17.5 52.2 -19.0<br />
PBT 5.4 18.2 55.4 -18.6<br />
HSBC EPS 8.7 19.0 56.4 -18.6<br />
Ratios (%)<br />
Revenue/IC (x) 3.2 2.3 3.4 2.8<br />
ROIC 45.1 36.3 46.3 34.8<br />
ROE 41.2 39.6 50.7 35.5<br />
ROA 16.5 19.8 26.9 20.6<br />
EBITDA margin 20.7 22.3 19.1 17.3<br />
Operating profit margin 19.0 20.8 18.2 16.4<br />
EBITDA/net interest (x) 88.2<br />
Net debt/equity -5.3 11.6 -4.6 -3.9<br />
Net debt/EBITDA (x) -0.1 0.2 -0.1 -0.1<br />
CF from operations/net debt 66.2<br />
Per share data (EUR)<br />
EPS Rep (fully diluted) 0.78 0.93 1.46 1.18<br />
HSBC EPS (fully diluted) 0.78 0.93 1.46 1.18<br />
DPS 0.40 0.50 0.85 0.85<br />
NAV 2.14 2.57 3.17 3.51<br />
Source: HSBC<br />
Note: price at close of 12 Oct <strong>2007</strong><br />
Stated accounts as of 31 Dec 2004 are IFRS compliant<br />
58
Mid cap<br />
<strong>European</strong> <strong>small</strong> <strong>and</strong> <strong>mid</strong> <strong>caps</strong><br />
17 October <strong>2007</strong><br />
abc<br />
Séché Environnement<br />
Stake bought in Saur last April should lead to Séché becoming the<br />
No.3 multi-utility player in France<br />
Seemingly lacklustre H1, but full-year guidance maintained,<br />
auguring well for a dynamic H2<br />
Overweight rating <strong>and</strong> EUR138 target price maintained<br />
Investment summary<br />
So far the only challenger to Suez <strong>and</strong> Veolia in<br />
the pure waste-management market, Séché made a<br />
major strategic move by acquiring of 33% of<br />
HIME last April (controlling holding of water<br />
management company Saur). In our view, Séché’s<br />
first move to take its stake in SAUR in April was<br />
just a first step. The group could well take a<br />
majority stake in Saur given the financial package<br />
set up by the consortium of players which was set<br />
up to acquire Saur <strong>and</strong> we expect Séché to up its<br />
stake in <strong>2008</strong>-2009. Such a move would be not<br />
only an excellent opportunity, given that water<br />
<strong>and</strong> waste treatment in France are dynamic<br />
markets (favourable regulatory framework, high<br />
entry barriers, pricing power in waste treatment,<br />
etc), but also a unique chance for the group, since<br />
Saur’s shareholding structure is now closed to<br />
further investors.<br />
Lacklustre H1, but dynamic H2 ahead<br />
Despite top-line weakness (sales up 2.7% to<br />
EUR178.9m), group margins held up in H1, with<br />
the operating margin on ordinary activities<br />
increasing by 30bp to 15.1%. This rise came<br />
mainly from stable amortisation costs <strong>and</strong><br />
provision levels, thanks to controlled investment<br />
over the past three years.<br />
Management reiterated its organic growth forecast of<br />
around 7% for <strong>2007</strong>, excluding the impact of the<br />
Abidjan soil decontamination contract. This full-year<br />
target reflects group confidence in its ability to<br />
generate average organic growth of 14% in the<br />
second half. The group also confirmed its <strong>2007</strong><br />
operating-margin forecast of 17%. This objective<br />
implies that the H2 operating margin on ordinary<br />
activities will increase by 90bp to 18.6%. We<br />
believe this is feasible, given the group’s prospects<br />
of a rebound in the second half.<br />
Key facts ____________________Financial summary _____________________ ___________ Valuation summary ___________<br />
Murielle André-Pinard<br />
Year to Revenue EBITDA HSBC HSBC HSBC Yield HSBC EV/ EV/ IC ROIC HSBC<br />
Tel: +33 1 56 52 43 16<br />
(EURm) (EURm) net profit EPS EPS growth (%) PE EBITDA (x) (%) REP<br />
Email: murielle.<strong>and</strong>re.pinard@hsbc.com<br />
(EURm) (EUR) (%)<br />
(x) (x)<br />
(x)<br />
Current price (EUR) 124.8 12/2006a 379.3 101.8 34.5 4.29 5.2 1.1 29.1 11.7 1.9 6.5 2.2<br />
Target price (EUR) 138.0 12/<strong>2007</strong>e 391.4 107.4 39.1 4.53 5.7 1.0 27.5 10.2 1.7 6.7 1.9<br />
Mkt cap (EURm) 1,077.4 12/<strong>2008</strong>e 414.5 118.7 54.3 6.29 38.8 1.5 19.8 9.0 1.7 7.9 1.5<br />
Bloomberg SCHP FP 12/2009e 443.5 132.4 60.4 7.00 11.3 1.7 17.8 7.9 1.6 8.4 1.4<br />
Reuters<br />
CCHE.PA<br />
Source: company data, HSBC estimates<br />
59
Mid cap<br />
<strong>European</strong> <strong>small</strong> <strong>and</strong> <strong>mid</strong> <strong>caps</strong><br />
17 October <strong>2007</strong><br />
abc<br />
Positioning of Séché Environnement<br />
Source: company<br />
Overweight; target price of EUR138<br />
Using HSBC DCF model (based on a cost of capital<br />
of 8.9% <strong>and</strong> long-term operating margin of 19.0%),<br />
we derive a target price of EUR138. Our target price<br />
offers a total potential return of c10.6% to the current<br />
share price, <strong>and</strong> we have an Overweight rating on<br />
the stock. In our view, the acquisition of 33% of<br />
Saur was motivated by the group’s aim to create a<br />
coherent multi-services group, which could become<br />
the third-ranking sector player in France.<br />
Company profile – at a glance<br />
Séché Environnement is the third player in the<br />
waste-management market, but it is far behind<br />
Suez <strong>and</strong> Véolia Environnement. Thanks to its<br />
<strong>small</strong>er size <strong>and</strong> its more pure business model, the<br />
group was able to maintain sustained organic<br />
growth over the past 10 years (between 6% <strong>and</strong><br />
8% on average). The group should continue to<br />
benefit from: 1) an increasingly favourable<br />
regulatory environment <strong>and</strong> 2) its ability to boost<br />
treatment capacity steadily <strong>and</strong> to adapt its plants<br />
to deal with the treatment of new waste with<br />
higher value added.<br />
Séché: sales by division (FY 2006) Séché: sales by region (FY 2006)<br />
Upstream<br />
activ ities<br />
20%<br />
Latin America<br />
Asia<br />
Europe<br />
4%<br />
3%<br />
0%<br />
BIW-HW<br />
24%<br />
HIW<br />
56%<br />
France<br />
93%<br />
Source: company<br />
Source: company<br />
60
Mid cap<br />
<strong>European</strong> <strong>small</strong> <strong>and</strong> <strong>mid</strong> <strong>caps</strong><br />
17 October <strong>2007</strong><br />
abc<br />
When Séché Environnement was floated on the<br />
stock market in 1997, it was operating only one<br />
l<strong>and</strong>fill (class I <strong>and</strong> II) near Laval (250 hectares). Its<br />
market capitalisation in 2001 was less than<br />
EUR400m. The successive acquisitions <strong>and</strong><br />
consolidations of Alcor in 2001 <strong>and</strong> Tredi in 2002<br />
lifted this to above the EUR1bn mark. With Saur, the<br />
group is, in our view, now about to undergo another<br />
change in size.<br />
Investment case<br />
In our view, the acquisition of 33% of Saur was<br />
motivated by the group’s aim to create a coherent<br />
multi-services group, which could become the<br />
third-ranking sector player in France. We expect<br />
significant synergies, not only in waste collection<br />
<strong>and</strong> treatment, but also in water activities, which<br />
have several things in common, namely, the same<br />
client base, similar ties with local authorities <strong>and</strong><br />
attractive business models (high entry barriers,<br />
recurring cash flow). The recent announcement of<br />
Suez Environnement’s future market listing is<br />
particularly interesting. Not only does this mean<br />
that another pure investment vehicle will exist<br />
alongside Séché Environnement, but it will also<br />
give the environment market a powerful boost,<br />
<strong>and</strong> reduce dispersion risk for Séché.<br />
Catalysts<br />
There are several potential catalysts that we think<br />
could lead to a medium-term revaluation:<br />
Confirmation of growth acceleration in the<br />
coming quarters’ releases<br />
Positive regulatory changes, resulting from<br />
the Grenelle de l’Environnement in France<br />
Reassuring announcements regarding Saur’s<br />
financial situation<br />
Valuation<br />
Our valuation is based solely on a DCF approach.<br />
The HSBC DCF model is based on the principle that<br />
an enterprise cannot create value indefinitely in a<br />
competitively efficient market. Return-on-invested<br />
capital trends towards the weighted average cost of<br />
capital. The HSBC model discounts economic profit<br />
over 38 years, during which time the ROIC<br />
progressively converges with WACC. We use the<br />
cost of equity as the discount rate; the tax shields are<br />
valued separately. The cost of equity comes out at<br />
8.9%, assuming a 10-year risk-free rate of 4.4%, a<br />
market risk premium of 4.5% <strong>and</strong> a beta of 1.0<br />
(albeit conservative, given the defensive profile of<br />
the stock, this beta level factors in the risks<br />
associated to how Séché will go about increasing its<br />
stake in Saur). We also assume growth to infinity of<br />
2.5% <strong>and</strong> a long-term sustainable operating margin<br />
of 19.0%. These assumptions give a valuation of<br />
EUR1,191m, ie, EUR138 per share.<br />
Sensitivity table (EUR)<br />
_____________ Discounted over_______________<br />
Years 15 20 25 30 38<br />
Cost of capital<br />
8.0% 102.4 113.6 125.1 138.2 153.8<br />
8.5% 96.8 107.3 118.5 131.6 146.2<br />
8.9% 91.4 101.2 112.1 124.3 138.0<br />
9.5% 89.8 97.4 106.8 119.4 132.4<br />
10.0% 83.4 91.9 101.2 135.8 139.1<br />
Source: HSBC estimates<br />
We have not retained the peer comparison<br />
approach in our valuation, since major rivals Suez<br />
<strong>and</strong> Veolia are significantly larger <strong>and</strong> more<br />
diversified than Séché. It is, however, interesting<br />
to note that on our estimates, Séché is trading at<br />
an average discount of around 15% to Véolia,<br />
which is excessive, in our view, given that Séché<br />
is a purer player than Veolia (also present in<br />
transport <strong>and</strong> energy services).<br />
61
Mid cap<br />
<strong>European</strong> <strong>small</strong> <strong>and</strong> <strong>mid</strong> <strong>caps</strong><br />
17 October <strong>2007</strong><br />
abc<br />
Investment risks<br />
We have identified the following major potential<br />
downside risks to our rating:<br />
Uncertainty about how Séché will go about<br />
increasing its stake in Saur’s capital<br />
(timing, price)<br />
Risks attached to the change to IFRS<br />
accounting <strong>and</strong> the significant impact of asset<br />
depreciation<br />
Execution risk of Saur integration if Séché<br />
were to gain control<br />
62
Mid cap<br />
<strong>European</strong> <strong>small</strong> <strong>and</strong> <strong>mid</strong> <strong>caps</strong><br />
17 October <strong>2007</strong><br />
abc<br />
Financials & valuation: Seche Environnement<br />
Overweight<br />
Financial statements<br />
Year to 12/2006a 12/<strong>2007</strong>e 12/<strong>2008</strong>e 12/2009e<br />
Profit & loss summary (EURm)<br />
Revenue 379.3 391.4 414.5 443.5<br />
EBITDA 101.8 107.4 118.7 132.4<br />
Depreciation & amortisation -39.8 -40.5 -45.1 -52.2<br />
Operating profit/EBIT 61.9 66.9 73.7 80.2<br />
Net interest -7.5 -4.0 -4.0 -2.5<br />
PBT 54.2 59.2 79.3 88.2<br />
HSBC PBT 54.2 59.2 79.3 88.2<br />
Taxation -19.4 -21.9 -24.9 -27.8<br />
Net profit 34.3 36.8 54.3 60.4<br />
HSBC net profit 34.5 39.1 54.3 60.4<br />
Cash flow summary (EURm)<br />
Cash flow from operations 83.7 101.2 110.6 124.8<br />
Capex -30.1 -50.9 -49.7 -53.2<br />
Cash flow from investment -31.0 -314.9 -49.7 -53.2<br />
Dividends -7.1 -11.2 -11.0 -16.3<br />
Change in net debt -19.4 173.1 -25.4 -28.4<br />
FCF equity 34.2 28.4 36.0 43.7<br />
Balance sheet summary (EURm)<br />
Intangible fixed assets 214.8 215.3 215.8 216.3<br />
Tangible fixed assets 152.4 161.8 165.5 164.9<br />
Current assets 173.8 179.4 195.7 219.4<br />
Cash & others 11.8 11.8 11.8 11.8<br />
Total assets 545.5 824.9 845.4 869.0<br />
Operating liabilities 121.4 125.3 132.7 142.0<br />
Gross debt 118.7 291.8 266.4 238.0<br />
Net debt 106.9 280.0 254.6 226.1<br />
Shareholders funds 274.3 375.6 413.6 455.9<br />
Invested capital 617.1 628.6 641.7 656.1<br />
Valuation data<br />
Year to 12/2006a 12/<strong>2007</strong>e 12/<strong>2008</strong>e 12/2009e<br />
EV/sales 3.1 2.8 2.6 2.4<br />
EV/EBITDA 11.7 10.2 9.0 7.9<br />
EV/IC 1.9 1.7 1.7 1.6<br />
PE* 29.1 27.5 19.8 17.8<br />
P/NAV 0.0 0.0 0.0 0.0<br />
FCF yield (%) 3.2 3.5 4.4 5.4<br />
Dividend yield (%) 1.1 1.0 1.5 1.7<br />
Note: * = Based on HSBC EPS (fully diluted)<br />
Issuer information<br />
Share price (EUR) 124.77 Target price (EUR) 138.00 Potent'l tot rtn (%) 10.6<br />
Reuters (Equity) CCHE.PA Bloomberg (Equity) SCHP FP<br />
Market cap (USDm) 1526.8 Market cap (EURm) 1077.4<br />
Free float (%) 32 Enterprise value (EURm) 1096.0<br />
Country France Sector Commercial Services<br />
Analyst Murielle Andre-Pinard Contact 33 1 56 52 43 16<br />
Price relative<br />
149<br />
139<br />
129<br />
119<br />
109<br />
99<br />
99<br />
Oct-06 Apr-07 Oct-07<br />
Seche Environnement Rel to SBF-120<br />
149<br />
139<br />
129<br />
119<br />
109<br />
Ratio, growth <strong>and</strong> per share analysis<br />
Year to 12/2006a 12/<strong>2007</strong>e 12/<strong>2008</strong>e 12/2009e<br />
Y-o-y % change<br />
Revenue 12.2 3.2 5.9 7.0<br />
EBITDA 16.9 5.5 10.6 11.5<br />
Operating profit 26.7 8.0 10.1 8.9<br />
PBT 18.5 9.2 33.9 11.3<br />
HSBC EPS 5.2 5.7 38.8 11.3<br />
Ratios (%)<br />
Revenue/IC (x) 0.6 0.6 0.7 0.7<br />
ROIC 6.5 6.7 7.9 8.4<br />
ROE 13.6 12.0 13.8 13.9<br />
ROA 6.4 5.4 6.5 7.0<br />
EBITDA margin 26.8 27.4 28.6 29.9<br />
Operating profit margin 16.3 17.1 17.8 18.1<br />
EBITDA/net interest (x) 13.6 26.8 29.7 53.0<br />
Net debt/equity 38.2 73.2 60.5 48.8<br />
Net debt/EBITDA (x) 1.1 2.6 2.1 1.7<br />
CF from operations/net debt 78.3 36.1 43.5 55.2<br />
Per share data (EUR)<br />
EPS Rep (fully diluted) 4.27 4.26 6.29 7.00<br />
HSBC EPS (fully diluted) 4.29 4.53 6.29 7.00<br />
DPS 1.40 1.28 1.89 2.10<br />
NAV 34124562.63 43492735.46 47895994.69 52795061.95<br />
Source: HSBC<br />
Note: price at close of 12 Oct <strong>2007</strong><br />
Stated accounts as of 31 Dec 2005 are IFRS compliant<br />
63
Mid cap<br />
<strong>European</strong> <strong>small</strong> <strong>and</strong> <strong>mid</strong> <strong>caps</strong><br />
17 October <strong>2007</strong><br />
abc<br />
Spectris<br />
Market-leading niche supplier of testing <strong>and</strong> inspection equipment<br />
Robust dem<strong>and</strong> backdrop <strong>and</strong> restructuring should drive strong<br />
near-term EPS growth<br />
Rising CFROI <strong>and</strong> low cost of capital lead to 1,010p target price,<br />
reiterate Overweight rating<br />
Investment summary<br />
Spectris is a niche producer of testing <strong>and</strong><br />
inspection equipment, serving a broad range of<br />
end-markets <strong>and</strong> selling directly to a largely bluechip<br />
customer base. The group typically invests<br />
around 7% of sales in R&D <strong>and</strong> develops whollyowned<br />
intellectual property in order to<br />
differentiate itself on product excellence rather<br />
than price. Although the aftermarket represents a<br />
modest proportion of total sales (c25%), unlike<br />
many of its competitors Spectris is reluctant to<br />
sacrifice product margin in search of more stable<br />
service revenues.<br />
Market backdrop is especially robust<br />
The group is currently benefiting from a strong<br />
industrial backdrop in emerging economies,<br />
combined with buoyant market conditions in<br />
Continental Europe. Together, these areas account<br />
for nearly two-thirds of group sales. Medium-term<br />
dem<strong>and</strong> is underpinned by positive drivers for<br />
testing <strong>and</strong> inspection, supported by environmental<br />
regulation on emissions, noise, waste, <strong>and</strong> health<br />
<strong>and</strong> safety, for which trends are increasingly<br />
migrating towards developing markets.<br />
Furthermore, despite the group’s market exposure<br />
being fairly diverse, we estimate that process<br />
industries account for c50% of sales – this is an<br />
area where we forecast a 13% increase in capital<br />
investment over the next two years.<br />
Margins reaching respectable levels<br />
Historically, Spectris’ margins have been<br />
uninspiring, but management’s efforts have<br />
recently focused on enhancing profitability<br />
through recent restructuring initiatives <strong>and</strong><br />
disposals. As a result, we believe the group is now<br />
on course to meet <strong>mid</strong>-teens margin targets in FY<br />
<strong>2007</strong> (from 12.2% in FY 2006), despite<br />
substantial currency headwinds.<br />
Key facts ____________________Financial summary _____________________ ___________ Valuation summary ___________<br />
Analyst: Gary Murphy<br />
Year to Revenue EBITDA HSBC HSBC HSBC Yield HSBC EV/ EV/IC ROIC HSBC<br />
Tel: +44 20 7991 6749<br />
December (GBPm) (GBPm) net profit EPS EPS growth (%) PE EBITDA (x) (%) REP<br />
Email: gary.murphy@hsbcib.com<br />
(GBPm) (GBp) (%)<br />
(x) (x)<br />
(x)<br />
Current price (GBP) 9.08 12/2006a 642.6 66.5 54.6 0.44 22.5 1.9 20.7 11.8 3.4 18.4 1.2<br />
Target price (GBP) 10.1 12/<strong>2007</strong>e 656.1 98.8 66.8 0.55 25.1 2.2 16.6 10.3 3.2 20.1 1.6<br />
Mkt cap (GBPm) 1,088 12/<strong>2008</strong>e 687.5 101.0 71.4 0.62 12.2 2.4 14.8 9.3 3.3 21.1 1.7<br />
Bloomberg SXS LN 12/2009e 715.5 101.3 77.3 0.67 8.2 2.5 13.7 8.5 3.1 22.6 1.6<br />
Reuters<br />
SXS.L<br />
Source: company data, HSBC estimates<br />
64
Mid cap<br />
<strong>European</strong> <strong>small</strong> <strong>and</strong> <strong>mid</strong> <strong>caps</strong><br />
17 October <strong>2007</strong><br />
abc<br />
Organisational structure<br />
Spectris<br />
Process Technology Electronic Controls In-line instrumentation<br />
Products/ activities<br />
Particle measuring systems, x-ray analysis<br />
equipment, materials analysis, transducers, sound<br />
meters, vibration measurement.<br />
Load cells, transducers, strain gauges, signal<br />
conditioning, data acquisition systems, weighing<br />
systems, barcode scanning <strong>and</strong> decoding<br />
Infra-red, x-ray <strong>and</strong> microwave sensors, gas<br />
analysers, condition monitoring<br />
Businesses<br />
Bruel & Kjaer, Fusion UV, Malvern Instruments,<br />
PANalytical, PMS<br />
HBM, Microscan, Red Lion Controls<br />
BETA Lasermike, Bruel & Kjaer Vibro, BTG,<br />
NDC, Servomex<br />
Source: HSBC, Spectris<br />
Valuation – Attractive entry point<br />
In our view, Spectris shares remain inexpensive<br />
trading on 14.8x <strong>2008</strong>e EPS. This represents a 5%<br />
valuation premium to its UK sector peers, but a<br />
30% discount against its major US competitor<br />
peer group. We feel that with the imminent<br />
accomplishment of its medium-term targets, the<br />
strategy will shift from margin recovery to the<br />
balance of organic <strong>and</strong> acquisitive growth <strong>and</strong><br />
consequently we think there is scope for a further<br />
re-rating of the shares.<br />
Company profile – at a glance<br />
Spectris is involved in the development <strong>and</strong><br />
manufacture of a range of precision testing <strong>and</strong><br />
inspection instrumentation <strong>and</strong> control equipment,<br />
which assists customers in improving the<br />
efficiency, quality <strong>and</strong> cost-effectiveness of their<br />
production process.<br />
The group’s niche focus gives rise to a fairly<br />
diverse competitor base, with rival players<br />
ranging from subsidiaries of large industry<br />
conglomerates, such as GE (in condition<br />
monitoring), Rockwell (electronic controls, UW,<br />
ROR US, USD71.7) <strong>and</strong> Siemens (OW, SIE GR,<br />
EUR98) <strong>and</strong> ABB (in gas analysis, OW, ABBN<br />
VX, CHF32.9), to niche players in the high-tech<br />
end of the analytical product range such as Horiba<br />
(Japan), Dionex, Danaher <strong>and</strong> Roper Industries,<br />
Perkin Elmer (all US) <strong>and</strong> Gefran (Italy).<br />
Investment case<br />
With underlying trading strong, H1 <strong>2007</strong> organic<br />
sales growth reached nearly 8%. Given the growth<br />
in volume sales, we believe there is further scope<br />
to improve margins, as the benefits of operational<br />
gearing materialise <strong>and</strong> our model assumes a 40%<br />
rate of profit drop-through. Additionally, we<br />
remain comfortable that (EUR <strong>and</strong> USD) currency<br />
headwinds can be offset through the benefits of<br />
restructuring emerging over the next 18 months.<br />
Finally, impressive cash generation within<br />
Spectris: sales by end-market (<strong>2007</strong>e)<br />
Spectris: sales by region (H1<strong>2007</strong>)<br />
Electronics<br />
5%<br />
R&D<br />
7%<br />
Energy & utilities<br />
7%<br />
Semicons<br />
3%<br />
Print <strong>and</strong> pack.<br />
4%<br />
Manuf.<br />
6%<br />
Pulp <strong>and</strong> paper<br />
9%<br />
Other<br />
20%<br />
Transport<br />
15%<br />
Pharma/Chem.<br />
12%<br />
Metals & mining<br />
12%<br />
Rest of world UK<br />
Rest of Asia 6% 4%<br />
10%<br />
China<br />
8%<br />
Japan<br />
8%<br />
North America<br />
24%<br />
Continental Europe<br />
40%<br />
Source: HSBC estimates<br />
Source: Spectris<br />
65
Mid cap<br />
<strong>European</strong> <strong>small</strong> <strong>and</strong> <strong>mid</strong> <strong>caps</strong><br />
17 October <strong>2007</strong><br />
abc<br />
management’s target of 90-100% conversion<br />
should keep borrowing costs low in the absence of<br />
any acquisitions. As a result, we are forecasting a<br />
double-digit CAGR in EPS over <strong>2007</strong>-10e.<br />
Catalysts<br />
Forthcoming potential catalysts include:<br />
Addressing the company’s inefficient capital<br />
structure – Spectris remains relatively<br />
undergeared, with a net debt-to-EBITDA ratio<br />
of
Mid cap<br />
<strong>European</strong> <strong>small</strong> <strong>and</strong> <strong>mid</strong> <strong>caps</strong><br />
17 October <strong>2007</strong><br />
abc<br />
Financials & valuation: Spectris<br />
Overweight<br />
Financial statements<br />
Year to 12/2006a 12/<strong>2007</strong>e 12/<strong>2008</strong>e 12/2009e<br />
Profit & loss summary (GBPm)<br />
Revenue 643 656 687 716<br />
EBITDA 99 112 121 127<br />
Depreciation & amortisation -16 -16 -14 -13<br />
Operating profit/EBIT 83 100 108 115<br />
Net interest -7 -5 -4 -1<br />
PBT 86 113 102 111<br />
HSBC PBT 79 95 105 114<br />
Taxation -24 -29 -33 -36<br />
Net profit 22 49 49 50<br />
HSBC net profit 55 67 71 77<br />
Cash flow summary (GBPm)<br />
Cash flow from operations 42 68 67 61<br />
Capex -11 -18 -12 -12<br />
Cash flow from investment -11 -19 18 -12<br />
Dividends -18 -20 -23 -24<br />
Change in net debt -41 -12 -25 -48<br />
FCF equity 61 63 70 72<br />
Balance sheet summary (GBPm)<br />
Intangible fixed assets 215 217 219 221<br />
Tangible fixed assets 83 105 109 112<br />
Current assets 296 294 297 311<br />
Cash & others 51 63 78 93<br />
Total assets 632 649 656 667<br />
Operating liabilities 204 198 205 205<br />
Gross debt 113 109 112 103<br />
Net debt 78 66 41 -7<br />
Shareholders funds 294 319 320 341<br />
Invested capital 340 355 343 346<br />
Ratio, growth <strong>and</strong> per share analysis<br />
Valuation data<br />
Year to 12/2006a 12/<strong>2007</strong>e 12/<strong>2008</strong>e 12/2009e<br />
EV/sales 1.8 1.8 1.6 1.5<br />
EV/EBITDA 11.8 10.3 9.3 8.5<br />
EV/IC 3.4 3.2 3.3 3.1<br />
PE* 20.7 16.6 14.8 13.7<br />
P/NAV 3.8 3.3 3.3 3.1<br />
FCF yield (%) 5.6 5.8 6.5 6.6<br />
Dividend yield (%) 1.9 2.2 2.4 2.5<br />
Note: * = Based on HSBC EPS (fully diluted)<br />
Issuer information<br />
Share price (GBPp) 908 Target price (GBPp) 1,010 Potent'l tot rtn (%) 11.2<br />
Reuters (Equity) SXS.L Bloomberg (Equity) SXS LN<br />
Market cap (USDm) 2,215 Market cap (GBPm) 1,088<br />
Free float (%) 100 Enterprise value (GBPm) 1154<br />
Country United Kingdom Sector Electronic Equipment<br />
Analyst Gary Murphy Contact 44 20 7991 6749<br />
Price relative<br />
1006<br />
906<br />
806<br />
706<br />
606<br />
506<br />
406<br />
306<br />
Source: HSBC<br />
2005 2006 <strong>2007</strong> <strong>2008</strong><br />
Spectris Rel to FTSE ALL-SHARE<br />
1006<br />
906<br />
806<br />
706<br />
606<br />
506<br />
406<br />
306<br />
Year to 12/2006a 12/<strong>2007</strong>e 12/<strong>2008</strong>e 12/2009e<br />
Y-o-y % change<br />
Revenue -2.0 2.1 4.8 4.1<br />
EBITDA 14.9 13.7 7.8 4.5<br />
Operating profit 16.4 20.1 8.2 6.0<br />
PBT 68.2 31.6 -9.0 8.7<br />
HSBC EPS 22.4 25.1 12.2 8.2<br />
Ratios (%)<br />
Revenue/IC (x) 1.9 1.9 2.0 2.1<br />
ROIC 18.4 20.1 21.1 22.6<br />
ROE 19.9 21.8 22.3 23.4<br />
ROA 5.1 9.0 8.6 8.4<br />
EBITDA margin 15.4 17.1 17.6 17.7<br />
Operating profit margin 12.9 15.2 15.7 16.0<br />
EBITDA/net interest (x) 14.3 25.0 34.6 126.6<br />
Net debt/equity 26.4 20.5 12.8 -2.0<br />
Net debt/EBITDA (x) 0.8 0.6 0.3 -0.1<br />
CF from operations/net debt 54.1 103.8 163.2<br />
Per share data (GBPp)<br />
EPS Rep (fully diluted) 17.64 40.30 42.15 42.80<br />
HSBC EPS (fully diluted) 43.79 54.75 61.44 66.49<br />
DPS 17.50 20.00 21.80 22.80<br />
NAV 236.60 271.41 277.33 295.71<br />
Note: price at close of 12 Oct <strong>2007</strong><br />
Stated accounts as of 31 Dec 2004 are IFRS compliant<br />
67
Mid cap<br />
<strong>European</strong> <strong>small</strong> <strong>and</strong> <strong>mid</strong> <strong>caps</strong><br />
17 October <strong>2007</strong><br />
abc<br />
Teleperformance<br />
The company’s strong position worldwide, coupled with faultless<br />
management should allow its results to continue growing (2006-<br />
09e sales CAGR +10.5% pa, EPS +15.0%)<br />
Acquisitions paid in cash <strong>and</strong> the resulting financial leverage on<br />
balance sheet should be the main catalyst for the stock<br />
The recent fall in the share price leaves significant upside<br />
potential. DCF target price of EUR38 (potential 38% return).<br />
Overweight<br />
Investment summary<br />
Teleperformance is the second-ranking player<br />
globally in the outsourced call centre market. The<br />
group has increased its market share (3.2%) through<br />
average organic growth of 9.5% in each of the past<br />
six years vs +7.0% for the market (IDC). This strong<br />
organic growth is combined with an active external<br />
growth policy, aiming at improving the group’s<br />
geographical coverage. At the same time, in our<br />
view the company managed its profitability<br />
perfectly, with an average operating margin of 8.6%<br />
over the past six years (lowest level of 7.7% in<br />
2003), despite the economic slowdown during 2001-<br />
03. The company notably managed its productivity<br />
through network rationalisation, focus on high valueadded<br />
niches <strong>and</strong> the relocation of resources to lowcost<br />
regions. For the next three years, we expect<br />
organic growth of 6% per year <strong>and</strong> an operating<br />
margin above 10%.<br />
We think the present price <strong>and</strong> valuation ratios<br />
(<strong>2008</strong>e EV/sales 0.8x, EV/EBITDA 5.7x, PE<br />
14.2x) offer an opportunity to invest in the stock,<br />
taking into account: 1) the expected 2006-09e<br />
average annual growth of EPS before accretive<br />
acquisitions (+15% pa), 2) positive net cash<br />
position, excluding any refinancing or debt<br />
problems, 3) good regional distribution of client<br />
sectors, 4) a steady global performance <strong>and</strong><br />
limited variation in operating margin.<br />
Key facts ____________________Financial summary _____________________ ___________ Valuation summary ___________<br />
Analyst: Antonin Baudry<br />
Year to Revenue EBITDA HSBC HSBC HSBC Yield HSBC EV/ EV/ IC ROIC HSBC<br />
Tel: +33 (0) 1 56 52 43 25<br />
(EURm) (EURm) net profit EPS EPS growth (%) PE EBITDA (x) (%) REP<br />
Email: antonin.baudry@hsbc.fr<br />
(EURm) (EUR) (%)<br />
(x) (x)<br />
(x)<br />
Current price (EUR) 27.5 12/2006a 1,385.2 194.6 76.1 1.59 -12.2 1.5 20.1 7.1 1.5 9.9 1.3<br />
Target price (EUR) 38.0 12/<strong>2007</strong>e 1,590.0 211.7 99.0 1.80 13.0 1.6 15.3 6.5 1.0 7.9 1.1<br />
Mkt cap (EURm) 1,514.5 12/<strong>2008</strong>e 1,777.3 241.9 109.6 1.99 10.6 1.8 13.8 5.5 1.0 7.8 1.1<br />
Bloomberg RCF FP 12/2009e 1,866.2 263.3 115.8 2.10 5.7 1.9 13.1 4.7 0.9 8.6 0.9<br />
Reuters<br />
ROCH.PA<br />
Source: company data, HSBC estimates<br />
68
Mid cap<br />
<strong>European</strong> <strong>small</strong> <strong>and</strong> <strong>mid</strong> <strong>caps</strong><br />
17 October <strong>2007</strong><br />
abc<br />
Key performance indicators over the 2001-06 period compared with our expectations for <strong>2007</strong><br />
2001 2002 2003 2004 2005 2006 CAGR 2001-06 <strong>2007</strong>e<br />
Total growth 29.5% 16.4% -7.6% 10.3% 25.2% 15.9% 15.0% 11.0%<br />
Organic growth 11.0% 10.0% -1.2% 11.6% 12.6% 11.7% 9.5% 8.0%<br />
EBIT margin 8.3% 9.0% 7.7% 8.1% 9.3% 9.5% 8.6% 10.0%<br />
Change (bp) +0.7 -1.3 +0.4 +1.2 +0.2 +0.5<br />
Acquisitions carried out by the group since November 2006<br />
Date Company Country Stake Centres Stations Sales (EURm) Price (EURm)<br />
21-nov-06 SCMG (Extratel/libertycall) Switzerl<strong>and</strong> 68% 2 500 22<br />
13-march-06 Twenty4help Germany 100% 12 3000 100 85<br />
14-may-07 Phone House Services France 62% 5 1200 45<br />
02-aug-07 Alliance One United States 100% 12 2200 82 82<br />
Total 31 6900 249 212<br />
Source: Teleperformance, HSBC estimestes<br />
Our target price of EUR38 implies a potential<br />
return of 38%, leading to our Overweight rating.<br />
Company profile – at a glance<br />
A worldwide leader<br />
IDC values the outsourced call centre market<br />
(telemarketing, integrated CRM programmes,<br />
Technical assistance) at EUR42.8bn in 2006 (18%<br />
of the overall call centre market), growing by 7%.<br />
With 2006 sales of EUR1,385m, ie, 3.2% market<br />
share, Teleperformance is the second-ranking<br />
player in the world after Convergys (US). The<br />
group has increased its market share through 9.5%<br />
organic growth per annum over the past six years.<br />
Even if Teleperformance is second in terms of<br />
revenues, it is No.1 in terms of geographical<br />
coverage, with 56,482 work stations in 263 call<br />
centres located in 42 countries.<br />
The market is still highly fragmented, but it is<br />
currently undergoing consolidation to cope with<br />
expectations of clients searching for operators that<br />
are solid, covering several regions, capable of<br />
integrating technological changes rapidly <strong>and</strong><br />
offering the lowest prices, with the objective of<br />
cost optimisation.<br />
Teleperformance is clearly positioned as a<br />
predator. Its strong organic growth is combined<br />
with an active external growth policy, aimed at<br />
improving the group’s geographical coverage <strong>and</strong><br />
presence in countries targeted for strategic<br />
expansion (US, UK, France, Germany). The<br />
cumulative sales of companies acquired over the<br />
past three years account for more than 25% of the<br />
total sales we expect this year.<br />
Teleperformance: sales by activity (FY 2006) Teleperformance: sales by client sector (FY 2006)<br />
Customer<br />
acquisition<br />
22%<br />
Debt<br />
collection<br />
2%<br />
Technical<br />
assistance<br />
16%<br />
Other<br />
6%<br />
Customer<br />
value growth<br />
54%<br />
Retail<br />
2%<br />
Public sector<br />
4%<br />
Insurance<br />
8%<br />
Techno/<br />
Medias<br />
7%<br />
F inancial<br />
services<br />
11%<br />
Other<br />
12%<br />
Telecoms<br />
56%<br />
Source: Teleperformance<br />
Source: Teleperformance<br />
69
Mid cap<br />
<strong>European</strong> <strong>small</strong> <strong>and</strong> <strong>mid</strong> <strong>caps</strong><br />
17 October <strong>2007</strong><br />
abc<br />
Strong management of margins<br />
Given the sector’s high fixed-cost structure that is<br />
faced with client pricing pressure, call centre<br />
companies must strive to improve cost <strong>and</strong><br />
performance. Teleperformance has managed its<br />
profitability well in the past, with an average<br />
operating margin of 8.6% over the past six years<br />
(lowest level of 7.7% in 2003), despite the<br />
economic slowdown in 2001-03 <strong>and</strong> the negative<br />
effect of the ‘do not call’ list in the US in 2003.<br />
For <strong>2007</strong>, management guides for an operating<br />
margin of 10.0%, which represents for us its<br />
normative level. We believe the company no longer<br />
has any immediate <strong>and</strong> substantial opportunities at<br />
the operating level that could enhance profitability,<br />
although it possesses some long-term opportunities,<br />
including: 1) the integration of more profitable<br />
companies (acquisitions), 2) the growing<br />
contribution of higher-margin niche activities, such<br />
as technical support, 3) the increased reliance on<br />
offshore resources, 4) the development of new<br />
teleworking techniques.<br />
We think the gradual effect of profitability drivers<br />
should allow the company to maintain its margin<br />
above 10% over the next three years. We forecast<br />
average net profit growth of 15% pa over 2006-09.<br />
Investment case<br />
Teleperformance is a defensive stock. Over the<br />
past six years, its average organic growth reached<br />
9.5% per year (total growth, +15% per year), with<br />
an average operating margin of 8.6% (lowest level<br />
of 7.7% in 2003), despite the economic slowdown<br />
over 2001-03. Its positive net cash position,<br />
excluding any refinancing problems, <strong>and</strong> the<br />
distribution of sales are secured by it having the<br />
right distribution of client sectors, with a strong<br />
position in telecoms (51% of sales) <strong>and</strong> only 11%<br />
of revenues coming from financial services. The<br />
company’s exposure to the US dollar accounts for<br />
30% of revenues, but we don’t think this should<br />
affect margins.<br />
Catalysts<br />
After the capital increase in November 2006<br />
(EUR260m), the company’s external growth – paid<br />
in cash – <strong>and</strong> the resulting financial leverage on the<br />
balance sheet is the main value driver for the<br />
company, in our view. Intrinsically unpredictable,<br />
we believe the execution of this acquisition<br />
programme, <strong>and</strong> hence its effect on the company’s<br />
balance sheet <strong>and</strong>, therefore, on its share price,<br />
should be considered from a medium-term<br />
perspective.<br />
Ever since it carried out its cash call, the group<br />
has spent EUR210m on four acquisitions,<br />
representing sales of EUR250m, or an average<br />
ratio of 0.85x sales (see the ‘Key performance<br />
indicators’ table above).<br />
Once the last acquisition of Alliance One in the<br />
US has been paid, Teleperformance should still<br />
have net cash of EUR120m at year-end. Based on<br />
a maximum gearing of 30%, we think that the<br />
group can still invest EUR390m. On the basis of<br />
the average ratio of EV/sales already recorded, it<br />
represents the acquisition of EUR450m in sales,<br />
implying a new increase of 25% of sales <strong>and</strong> EPS<br />
(at constant margin) with no additional dilution.<br />
Valuation<br />
Our target price of EUR38 is derived from a DCF<br />
valuation (WACC of 8.9%, risk-free rate of 4.4%,<br />
<strong>and</strong> a beta of 1). It implies a potential return of 38%<br />
<strong>and</strong> leads to our Overweight rating.<br />
70
Mid cap<br />
<strong>European</strong> <strong>small</strong> <strong>and</strong> <strong>mid</strong> <strong>caps</strong><br />
17 October <strong>2007</strong><br />
abc<br />
We believe the current price <strong>and</strong> valuation ratios<br />
(<strong>2008</strong>e EV/sales 0.8x, EV/EBITDA 5.7x, PE 14.2x)<br />
represents an investment opportunity taking into<br />
account: 1) our expected 2006-09 average annual<br />
EPS growth (+15% pa) before acquisitions, 2) the<br />
net cash position, excluding any refinancing<br />
problems, 3) the good distribution of client sectors,<br />
4) a steady global performance <strong>and</strong> limited<br />
variation in operating margin.<br />
Investment risks<br />
The following risks could prompt us to change<br />
our rating: 1) the setting up of ‘do not call’ lists in<br />
new areas, 2) anti-relocation legislation in Europe<br />
<strong>and</strong> the US, a major factor behind growth in group<br />
margins, 3) currency fluctuations, mainly the<br />
EUR/USD <strong>and</strong> EUR/BRL exchange rate, 4)<br />
significant delays in the execution of the<br />
acquisition programme.<br />
71
Mid cap<br />
<strong>European</strong> <strong>small</strong> <strong>and</strong> <strong>mid</strong> <strong>caps</strong><br />
17 October <strong>2007</strong><br />
abc<br />
Financials & valuation: Teleperformance<br />
Financial statements<br />
Year to 12/2006a 12/<strong>2007</strong>e 12/<strong>2008</strong>e 12/2009e<br />
Profit & loss summary (EURm)<br />
Revenue 1385.2 1590.0 1777.3 1866.2<br />
EBITDA 194.6 211.7 241.9 263.3<br />
Depreciation & amortisation -55.3 -62.5 -69.3 -74.6<br />
Operating profit/EBIT 139.3 149.3 172.6 188.7<br />
Net interest -15.4 -1.5 1.9 2.5<br />
PBT 124.0 147.7 174.5 191.1<br />
HSBC PBT 124.0 147.7 174.5 191.1<br />
Taxation -41.9 -58.5 -66.1 -69.8<br />
Net profit 78.9 85.3 103.1 115.8<br />
HSBC net profit 76.1 99.0 109.6 115.8<br />
Cash flow summary (EURm)<br />
Cash flow from operations 169.1 139.7 182.1 254.4<br />
Capex -62.5 -66.7 -71.1 -74.6<br />
Cash flow from investment -82.3 -254.0 -71.1 -74.6<br />
Dividends -14.5 -19.6 -24.8 -27.4<br />
Change in net debt -306.6 5.8 -63.1 -85.1<br />
FCF equity 75.3 46.5 87.8 112.5<br />
Balance sheet summary (EURm)<br />
Intangible fixed assets 348.2 527.9 527.9 527.9<br />
Tangible fixed assets 133.3 155.3 157.1 157.1<br />
Current assets 833.2 825.5 875.3 899.0<br />
Cash & others 469.3 389.0 389.0 389.0<br />
Total assets 1332.4 1528.1 1579.8 1603.4<br />
Operating liabilities 245.6 273.6 304.7 319.5<br />
Gross debt 341.2 266.7 203.7 118.6<br />
Net debt -128.0 -122.3 -185.4 -270.4<br />
Shareholders funds 726.4 967.0 1045.3 1133.7<br />
Invested capital 935.6 1360.1 1380.7 1389.6<br />
Valuation data<br />
Overweight<br />
Year to 12/2006a 12/<strong>2007</strong>e 12/<strong>2008</strong>e 12/2009e<br />
EV/sales 1.0 0.9 0.7 0.7<br />
EV/EBITDA 7.1 6.5 5.5 4.7<br />
EV/IC 1.5 1.0 1.0 0.9<br />
PE* 20.1 15.3 13.8 13.1<br />
P/NAV 1.8 1.6 1.4 1.3<br />
FCF yield (%) 5.0 3.1 5.8 7.4<br />
Dividend yield (%) 1.5 1.6 1.8 1.9<br />
Note: * = Based on HSBC EPS (fully diluted)<br />
Issuer information<br />
Share price (EUR) 27.50 Target price (EUR) 38.00 Potent'l tot rtn (%) 38.2<br />
Reuters (Equity) ROCH.PA Bloomberg (Equity) RCF FP<br />
Market cap (USDm) 2146.2 Market cap (EURm) 1514.5<br />
Free float (%) 100 Enterprise value (EURm) 1386.1<br />
Country France Sector Media<br />
Analyst Antonin Baudry Contact 33 1 56 52 43 25<br />
Price relative<br />
37<br />
37<br />
35<br />
35<br />
33<br />
33<br />
31<br />
31<br />
29<br />
29<br />
27<br />
27<br />
25<br />
25<br />
23<br />
23<br />
Oct-06 Apr-07 Oct-07<br />
Teleperformance Rel to SBF-120<br />
Ratio, growth <strong>and</strong> per share analysis<br />
Year to 12/2006a 12/<strong>2007</strong>e 12/<strong>2008</strong>e 12/2009e<br />
Y-o-y % change<br />
Revenue 15.8 14.8 11.8 5.0<br />
EBITDA 22.7 8.8 14.2 8.8<br />
Operating profit 31.4 7.1 15.6 9.3<br />
PBT 29.9 19.2 18.1 9.6<br />
HSBC EPS -7.8 31.6 10.6 5.7<br />
Ratios (%)<br />
Revenue/IC (x) 1.5 1.4 1.3 1.3<br />
ROIC 9.9 7.9 7.8 8.6<br />
ROE 13.2 11.7 10.9 10.6<br />
ROA 7.7 6.3 7.0 7.6<br />
EBITDA margin 14.1 13.3 13.6 14.1<br />
Operating profit margin 10.1 9.4 9.7 10.1<br />
EBITDA/net interest (x) 12.6 137.9<br />
Net debt/equity -17.3 -12.5 -17.4 -23.4<br />
Net debt/EBITDA (x) -0.7 -0.6 -0.8 -1.0<br />
CF from operations/net debt<br />
Per share data (EUR)<br />
EPS Rep (fully diluted) 1.42 1.55 1.87 2.10<br />
HSBC EPS (fully diluted) 1.37 1.80 1.99 2.10<br />
DPS 0.41 0.45 0.50 0.53<br />
NAV 15.17 17.55 18.97 20.57<br />
Source: HSBC<br />
Note: price at close of 12 Oct <strong>2007</strong><br />
Stated accounts as of 31 Dec 2004 are IFRS compliant<br />
72
Mid cap<br />
<strong>European</strong> <strong>small</strong> <strong>and</strong> <strong>mid</strong> <strong>caps</strong><br />
17 October <strong>2007</strong><br />
abc<br />
HSBC <strong>European</strong> <strong>small</strong> <strong>and</strong><br />
<strong>mid</strong>-cap coverage universe<br />
HSBC <strong>European</strong> <strong>small</strong> <strong>and</strong> <strong>mid</strong>-cap coverage universe<br />
Name Reuters Bloomberg Country Analyst Phone Rating Target price Last close*<br />
A.S. Creation Tapeten ACWG.DE ACW GR GERMANY Burkhard Weiss 49 211 910 3722 Overweight EUR 53.00 EUR 46.99<br />
A-B Vassilopoulos ABVr.AT BASIK GA GREECE Spiros Tsangalakis 30 210 6965 212 Overweight EUR 35.50 EUR 29.94<br />
Aberdeen Asset Mgmt ADN.L ADN LN UNITED KINGDOM Martin Cross +44 20 7991 6748 Overweight GBP 2.20 GBP 1.93<br />
adidas-Salomon ADSG.DE ADS GR GERMANY Erwan Rambourg 44 20 7991 6793 Neutral EUR 48.00 EUR 43.80<br />
Aixtron AIXG.DE AIX GR GERMANY Thorsten Zimmermann 49 211 9102852 Underweight EUR 3.80 EUR 7.97<br />
Aker Kvaerner AKVER.OL AKVER NO NORWAY David Phillips 44 207 991 2344 Overweight NOK 200.00 NOK 189.50<br />
Alleanza ALZI.MI AL IM ITALY Kailesh Mistry 44 20 7991 6756 Underweight EUR 9.10 EUR 9.28<br />
Alliance & Leicester ALLL.L AL/ LN UNITED KINGDOM Robin Down 44 20 7991 6926 Underweight GBP 8.85 GBP 7.54<br />
Altamir ALMP.PA LTA FP FRANCE Pierre Bosset +33 1 5652 4310 Overweight EUR 14.30 EUR 11.04<br />
Alten LTEN.PA ATE FP FRANCE Antonin Baudry 33 1 56 52 43 25 Underweight EUR 27.00 EUR 26.22<br />
Altran Technologies ALTT.PA ALT FP FRANCE Antonin Baudry 33 1 56 52 43 25 Neutral EUR 6.70 EUR 5.23<br />
Arques Industries AQUG.DE AQU GR GERMANY Thomas Teetz 49 211 9102353 Overweight EUR 36.50 EUR 31.67<br />
Arriva ARI.L ARI LN UNITED KINGDOM Tommy Bryson 44 20 7991 6799 Overweight GBP 9.90 GBP 8.15<br />
Assa Abloy ASSAb.ST ASSAB SS SWEDEN Colin Gibson 44 20 7991 6592 Underweight SEK 150.00 SEK 140.25<br />
Assystem ASY.PA ASY FP FRANCE Antonin Baudry 33 1 56 52 43 25 Underweight EUR 13.50 EUR 12.26<br />
Atos-Origin ATOS.PA ATO FP FRANCE Antonin Baudry 33 1 56 52 43 25 Neutral EUR 49.50 EUR 43.65<br />
Aubay AUBT.PA AUB FP FRANCE Antonin Baudry 33 1 56 52 43 25 Overweight EUR 10.00 EUR 7.96<br />
Autoroutes Paris-Rhin-Rho APRR.PA ARR FP FRANCE Eric Lemarie 44 20 7991 6706 Neutral EUR 75.00 EUR 73.34<br />
AWD Holding AWDG.DE AWD GR GERMANY Jesko Mayer-Wegelin +49 211 910 3719 Overweight EUR 40.00 EUR 22.84<br />
Baader Wertpapierh<strong>and</strong>elsb BLMG.DE BWB GR GERMANY Thomas Teetz 49 211 9102353 Neutral EUR 4.65 EUR 4.91<br />
Banca CR Firenze SpA CFI.MI CFI IM ITALY Carlo Digr<strong>and</strong>i 44 20 7991 6843 Underweight EUR 3.83 EUR 6.62<br />
Banca Generali Spa BGN.MI BGN IM ITALY Kailesh Mistry 44 20 7991 6756 Overweight EUR 11.22 EUR 8.91<br />
Banca Pop.Verona Novara BPVN.MI BPVN IM ITALY Carlo Digr<strong>and</strong>i 44 20 7991 6843 Overweight EUR 28.30 EUR 21.34<br />
Banca Popolare di Milano PMII.MI BPM IM ITALY Carlo Digr<strong>and</strong>i 44 20 7991 6843 Neutral EUR 12.10 EUR 10.47<br />
Banco de Sabadell SA SABE.MC SAB SM SPAIN Carlo Digr<strong>and</strong>i 44 20 7991 6843 Neutral EUR 7.20 EUR 7.00<br />
Basler BSLG.DE BSL GR GERMANY Richard Schramm +49 211 910 2837 Neutral EUR 13.30 EUR 13.50<br />
Bastide Le Confort Medica BATD.PA BLC FP FRANCE Murielle Andre-Pinard 33 1 56 52 43 16 Neutral EUR 74.00 EUR 70.50<br />
Biffa BIFF.L BIFF LN UNITED KINGDOM Verity Mitchell 44 20 7991 6840 Overweight GBP 2.80 GBP 2.48<br />
Biomerieux BIOX.PA BIM FP FRANCE Murielle Andre-Pinard 33 1 56 52 43 16 Overweight EUR 77.00 EUR 73.16<br />
Boliden BOL.ST BOL SS SWEDEN Paul McTaggart 44 20 7991 6798 Underweight SEK 144.00 SEK 129.50<br />
Bradford&Bingley BB.L BB/ LN UNITED KINGDOM Robin Down 44 20 7991 6926 Overweight GBP 5.15 GBP 2.63<br />
Brisa BRIS.IN BRISA PL PORTUGAL Eric Lemarie 44 20 7991 6706 Neutral EUR 10.10 EUR 9.53<br />
British L<strong>and</strong> Co BLND.L BLND LN UNITED KINGDOM John Fraser-Andrews 44 20 7991 6732 Overweight GBP 15.25 GBP 10.77<br />
Brixton Plc BXTN.L BXTN LN UNITED KINGDOM John Fraser-Andrews 44 20 7991 6732 Overweight GBP 4.25 GBP 3.76<br />
buch.de BUEG.DE BUE GR GERMANY Burkhard Weiss 49 211 910 3722 Neutral EUR 4.00 EUR 4.01<br />
Bulgari BULG.MI BUL IM ITALY Antoine Belge +331 5652 4347 Overweight EUR 12.75 EUR 11.30<br />
Bull BUL.PA BULL FP FRANCE Antonin Baudry 33 1 56 52 43 25 Neutral EUR 5.50 EUR 5.20<br />
Burberry Group BRBY.L BRBY LN UNITED KINGDOM Erwan Rambourg 44 20 7991 6793 Neutral GBP 6.50 GBP 6.66<br />
Cable & Wireless CW.L CW/ LN UNITED KINGDOM Steve Scruton 44 20 7991 6819 Underweight GBP 1.36 GBP 1.84<br />
Capgemini CAPP.PA CAP FP FRANCE Antonin Baudry 33 1 56 52 43 25 Overweight EUR 70.00 EUR 46.95<br />
Carl Zeiss Meditec AFXG.DE AFX GR GERMANY Christian Packebusch +49 0 211 9102446 Overweight EUR 19.00 EUR 15.18<br />
cash.life SGSG.DE SGS GR GERMANY Jesko Mayer-Wegelin +49 211 910 3719 Neutral EUR 16.40 EUR 11.55<br />
Central African Mining & CFM.L CFM LN UNITED KINGDOM Paul McTaggart 44 20 7991 6798 Overweight GBP 0.35 GBP 0.24<br />
Centrosolar C3OG.DE C30 GR GERMANY Burkhard Weiss 49 211 910 3722 Underweight EUR 10.20 EUR 9.25<br />
Centrotec CEVG.DE CEV NM GERMANY Burkhard Weiss 49 211 910 3722 Overweight EUR 21.00 EUR 13.88<br />
CGGVeritas GEPH.PA GA FP FRANCE David Phillips 44 207 991 2344 Neutral EUR 200.00 EUR 230.26<br />
Clarins CLRP.PA CLR FP FRANCE S<strong>and</strong>y Beebee +1 212 525 5152 Underweight EUR 54.00 EUR 57.47<br />
Clipper Windpower CWPR.L CWP LN UNITED KINGDOM Robert Clover 44 20 7991 6741 Overweight GBP 9.00 GBP 6.46<br />
73
Mid cap<br />
<strong>European</strong> <strong>small</strong> <strong>and</strong> <strong>mid</strong> <strong>caps</strong><br />
17 October <strong>2007</strong><br />
abc<br />
HSBC <strong>European</strong> <strong>small</strong> <strong>and</strong> <strong>mid</strong>-cap coverage universe<br />
Name Reuters Bloomberg Country Analyst Phone Rating Target price Last close*<br />
Club Mediterranee CMIP.PA CU FP FRANCE Emmanuelle Vigneron 33 1 56 52 43 19 Underweight EUR 39.00 EUR 46.81<br />
COLT COLT.L COLT LN UNITED KINGDOM Steve Scruton 44 20 7991 6819 Underweight [GBP 1.09 EUR 1.74<br />
Conergy CGYG.DE CGY GR GERMANY Burkhard Weiss 49 211 910 3722 Underweight EUR 52.00 EUR 52.00<br />
Cosmote COSr.AT COSMO GA GREECE Vangelis Karanikas 30 210 6965 211 Overweight EUR 26.00 EUR 24.40<br />
Couach YACHT.PA GUY FP FRANCE Emmanuelle Vigneron 33 1 56 52 43 19 Overweight EUR 17.40 EUR 15.56<br />
Credito Emiliano EMBI.MI CE IM ITALY Carlo Digr<strong>and</strong>i 44 20 7991 6843 Neutral EUR 11.70 EUR 9.38<br />
Cumerio CUMR.BR CMR BB BELGIUM Thorsten Zimmermann 49 211 9102852 Underweight EUR 23.00 EUR 29.39<br />
Delhaize DELB.BR DELB BB BELGIUM Mark Husson 1 212 525 3134 Overweight EUR 78.00 EUR 67.87<br />
Deutsche Beteiligungs AG DBAG.DE DBA GR GERMANY Thomas Teetz 49 211 9102353 Overweight EUR 28.50 EUR 24.73<br />
Deutz DEZG.DE DEZ GR GERMANY Juergen Siebrecht +49 211 910 3350 Overweight EUR 11.00 EUR 9.25<br />
Devoteam DVTM.PA DVT FP FRANCE Antonin Baudry 33 1 56 52 43 25 Overweight EUR 42.00 EUR 30.80<br />
Dragerwerk DRWG_p.DE DRW3 GR GERMANY Christian Packebusch +49 0 211 9102446 Overweight EUR 75.00 EUR 68.50<br />
Drillisch DRIG.DE DRI GR GERMANY Dominik Klarmann 49 211 910 3720 Neutral EUR 6.60 EUR 7.55<br />
DSV A/S DSV.CO DSV DC DENMARK Robin Byde 44 20 7991 6816 Overweight DKK 130.00 DKK 132.25<br />
Durr DUEG.F DUE GR GERMANY Juergen Siebrecht +49 211 910 3350 Overweight EUR 35.00 EUR 34.70<br />
Eiffage FOUG.PA FGR FP FRANCE Pierre Bosset +33 1 5652 4310 Neutral EUR 80.00 EUR 76.73<br />
Elexis EEXG.DE EEX GR GERMANY Sebastian Satz +49 211 910 2373 Overweight EUR 30.00 EUR 23.10<br />
Elisa Corporation ELI1V.HE ELI1V FH FINLAND Stephen Howard 44 20 7991 6820 Overweight EUR 24.00 EUR 22.42<br />
Elmos ELGG.DE ELG GR GERMANY Thorsten Zimmermann 49 211 9102852 Overweight EUR 10.20 EUR 8.00<br />
ELRINGKLINGER ZILGn.DE ZIL2 GR GERMANY Thorsten Zimmermann 49 211 9102852 Neutral EUR 70.10 EUR 77.00<br />
Emporiki Bank CBGr.AT TEMP GA GREECE Sophia Skourti 30 210 6965214 Neutral EUR 22.40 EUR 20.26<br />
Eurazeo EURA.PA RF FP FRANCE Pierre Bosset +33 1 5652 4310 Overweight EUR 130.00 EUR 105.50<br />
F&C Asset Management FCAM.L FIS LN UNITED KINGDOM Martin Cross +44 20 7991 6748 Underweight GBP 1.50 GBP 2.04<br />
Fastweb FWB.MI FWB IM ITALY Luigi Minerva 44 20 7991 6928 Overweight EUR 47.00 EUR 42.06<br />
FFP FFPP.PA FFP FP FRANCE Pierre Bosset +33 1 5652 4310 Neutral EUR 140.00 EUR 110.50<br />
Finmeccanica SIFI.MI FNC IM ITALY Edward Stacey 44 20 7991 6837 Neutral EUR 23.00 EUR 20.75<br />
FirstGroup FGP.L FGP LN UNITED KINGDOM Tommy Bryson 44 20 7991 6799 Overweight GBP 8.10 GBP 7.28<br />
Folli-Follie FOLr.AT FOLLI GA GREECE Paris Mantzavras 30 210 6965 210 Underweight EUR 29.50 EUR 30.40<br />
Forthnet Sa FORr.AT FORTH GA GREECE Vangelis Karanikas 30 210 6965 211 Overweight EUR 14.00 EUR 10.78<br />
<strong>Fourlis</strong> FRLr.AT FOYRK GA GREECE Spiros Tsangalakis 30 210 6965 212 Overweight EUR 31.30 EUR 26.52<br />
Freenet FNTG.DE FNT GR GERMANY Dominik Klarmann 49 211 910 3720 Neutral EUR 21.00 EUR 19.02<br />
Friends Provident FP.L FP/ LN UNITED KINGDOM Shane Gallagher 44 20 7991 6723 Neutral GBP 1.88 GBP 1.75<br />
Frigoglass FRIr.AT FRIGO GA GREECE Paris Mantzavras 30 210 6965 210 Neutral EUR 22.00 EUR 24.20<br />
Frontline Ltd FRO.N FRO US NORWAY Robin Byde 44 20 7991 6816 Underweight USD 35.69 USD 43.59<br />
Fuchs Petrolub FPEG.DE FPE GR GERMANY Sebastian Satz +49 211 910 2373 Overweight EUR 80.00 EUR 67.31<br />
Fugro FUGRc.AS FUR NA NETHERLANDS David Phillips 44 207 991 2344 Neutral EUR 50.00 EUR 58.77<br />
Gamesa Corp Tecnologica S GAM.MC GAM SM SPAIN Robert Clover 44 20 7991 6741 Overweight EUR 37.50 EUR 31.41<br />
GEA Group G1AG.DE G1A GR GERMANY Juergen Siebrecht +49 211 910 3350 Underweight EUR 21.00 EUR 26.40<br />
GEK Holding & Real Estate HRMr.AT GEK GA GREECE Vangelis Karanikas 30 210 6965 211 Overweight EUR 14.40 EUR 13.56<br />
Generale de Sante GDSF.PA GDS FP FRANCE Murielle Andre-Pinard 33 1 56 52 43 16 Underweight EUR 28.00 EUR 28.90<br />
Gerry Weber International GWIG.DE GWI1 GR GERMANY Burkhard Weiss 49 211 910 3722 Overweight EUR 27.00 EUR 21.67<br />
Gesco GSDG.DE GSC GR GERMANY Thomas Teetz 49 211 9102353 Overweight EUR 60.00 EUR 53.73<br />
GFI Informatique GFIP.PA GFI FP FRANCE Antonin Baudry 33 1 56 52 43 25 Neutral EUR 8.00 EUR 7.33<br />
Gildemeister GILG.F GIL GR GERMANY Juergen Siebrecht +49 211 910 3350 Neutral EUR 17.00 EUR 22.10<br />
Go-Ahead Group GOG.L GOG LN UNITED KINGDOM Tommy Bryson 44 20 7991 6799 Underweight GBP 23.95 GBP 25.22<br />
Goldenport Holdings Inc GPRT.L GPRT LN UNITED KINGDOM Robin Byde 44 20 7991 6816 Overweight GBP 4.80 GBP 4.88<br />
Greek Postal Savings Bank GPSr.AT TT GA GREECE Joanna Telioudi 30 210 6965209 Neutral EUR 17.00 EUR 15.54<br />
Grenkeleasing GKLG.DE GLJ GR GERMANY Jesko Mayer-Wegelin +49 211 910 3719 Overweight EUR 36.00 EUR 29.15<br />
Groupe Beneteau CHBE.PA BEN FP FRANCE Emmanuelle Vigneron 33 1 56 52 43 19 Underweight EUR 18.00 EUR 20.11<br />
H&R Wasag WASG.DE WAS GR GERMANY Sebastian Satz +49 211 910 2373 Overweight EUR 28.00 EUR 22.90<br />
Hammerson HMSO.L HMSO LN UNITED KINGDOM John Fraser-Andrews 44 20 7991 6732 Underweight GBP 13.95 GBP 11.37<br />
Hannover Re HNRGn.DE HNR1 GR GERMANY John Russell +852 2822 4321 Neutral EUR 37.00 EUR 35.54<br />
Heidelberger Druck HDDG.DE HDD GR GERMANY Richard Schramm +49 211 910 2837 Overweight EUR 40.00 EUR 30.09<br />
Hellenic Duty Free Shops HDFr.AT HDF GA GREECE Spiros Tsangalakis 30 210 6965 212 Overweight EUR 14.10 EUR 13.30<br />
Hellenic Exchanges SA EXCr.AT EXAE GA GREECE Spiros Tsangalakis 30 210 6965 212 Overweight EUR 20.46 EUR 22.96<br />
Hellenic Petroleum Group HEPr.AT ELPE GA GREECE Vangelis Karanikas 30 210 6965 211 Neutral EUR 12.00 EUR 11.58<br />
Hellenic Technodomiki HELr.AT ELTEX GA GREECE Vangelis Karanikas 30 210 6965 211 Overweight EUR 11.00 EUR 10.34<br />
Henderson Group HGI.L HGI LN UNITED KINGDOM Martin Cross +44 20 7991 6748 Neutral GBP 1.55 GBP 1.76<br />
Hermes HRMS.PA RMS FP FRANCE Antoine Belge +331 5652 4347 Underweight EUR 74.00 EUR 90.29<br />
HMV Group HMV.L HMV LN UNITED KINGDOM Paul S<strong>mid</strong>dy 44 20 7991 6757 Underweight GBP 1.14 GBP 1.20<br />
Hochschild Mining HOCM.L HOC LN UNITED KINGDOM Paul McTaggart 44 20 7991 6798 Neutral USD 3.65 USD 4.25<br />
Hochtief HOTG.DE HOT GR GERMANY Thomas Teetz 49 211 9102353 Overweight EUR 108.00 EUR 92.10<br />
Home Retail Group HOME.L HOME LN UNITED KINGDOM Paul S<strong>mid</strong>dy 44 20 7991 6757 Underweight GBP 3.30 GBP 3.84<br />
IFI IFPI_p.MI IFP IM ITALY Pierre Bosset +33 1 5652 4310 Overweight EUR 35.50 EUR 28.50<br />
IFIL Investments IFLI.MI IFL IM ITALY Pierre Bosset +33 1 5652 4310 Neutral EUR 8.50 EUR 7.99<br />
Iliad ILD.PA ILD FP FRANCE Nicolas Cote-Colisson 44 20 7991 6826 Overweight EUR 80.00 EUR 72.59<br />
74
Mid cap<br />
<strong>European</strong> <strong>small</strong> <strong>and</strong> <strong>mid</strong> <strong>caps</strong><br />
17 October <strong>2007</strong><br />
abc<br />
HSBC <strong>European</strong> <strong>small</strong> <strong>and</strong> <strong>mid</strong>-cap coverage universe<br />
Name Reuters Bloomberg Country Analyst Phone Rating Target price Last close*<br />
IMS ITMT.PA IMS FP FRANCE Pierre Bosset +33 1 5652 4310 Neutral EUR 34.00 EUR 31.70<br />
Inchcape INCH.L INCH LN UNITED KINGDOM Paul S<strong>mid</strong>dy 44 20 7991 6757 Overweight GBP 5.30 GBP 4.60<br />
Ingenico INGC.PA ING FP FRANCE Christophe Quarante +33 1 56 52 43 12 Overweight EUR 26.00 EUR 21.65<br />
Inter Parfums IPAR.PA ITP FP FRANCE Emmanuelle Vigneron 33 1 56 52 43 19 Overweight EUR 39.00 EUR 35.55<br />
InterContinental Hotels IHG.L IHG LN UNITED KINGDOM Mark Julio 44 20 7991 6753 Overweight GBP 14.55 GBP 10.38<br />
Interhyp IYPGn.DE IYP GR GERMANY Jesko Mayer-Wegelin +49 211 910 3719 Overweight EUR 90.00 EUR 58.00<br />
Interseroh INSG.DE ITS GR GERMANY Burkhard Weiss 49 211 910 3722 Neutral EUR 52.00 EUR 48.02<br />
Intertek Group ITRK.L ITRK LN UNITED KINGDOM Pierre Bosset +33 1 5652 4310 Overweight GBP 10.50 GBP 10.00<br />
Intralot INLr.AT INLOT GA GREECE Paris Mantzavras 30 210 6965 210 Neutral EUR 27.50 EUR 29.90<br />
Invensys ISYS.L ISYS LN UNITED KINGDOM Gary Murphy 44 20 7991 6749 Overweight GBP 3.90 GBP 3.18<br />
Invesco Plc IVZ.L IVZ LN UNITED KINGDOM Martin Cross +44 20 7991 6748 Neutral USD 6.10 USD 7.08<br />
ITV ITV.L ITV LN UNITED KINGDOM Steve Scruton 44 20 7991 6819 Underweight GBP 0.85 GBP 1.02<br />
J&P Avax AVAr.AT AVAX GA GREECE Vangelis Karanikas 30 210 6965 211 Overweight EUR 9.30 EUR 7.80<br />
Jenoptik JENG.DE JEN GR GERMANY Thorsten Zimmermann 49 211 9102852 Neutral EUR 8.40 EUR 6.80<br />
Jumbo BABr.AT BABY GA GREECE Spiros Tsangalakis 30 210 6965 212 Overweight EUR 26.00 EUR 23.10<br />
Jungheinrich JUNG_p.DE JUN3 GR GERMANY Richard Schramm +49 211 910 2837 Neutral EUR 34.50 EUR 34.00<br />
K+S SDFG.DE SDF GR GERMANY Richard Schramm +49 211 910 2837 Underweight EUR 118.00 EUR 132.01<br />
Kelda Group KEL.L KEL LN UNITED KINGDOM Verity Mitchell 44 20 7991 6840 Neutral GBP 9.88 GBP 9.23<br />
Kingfisher KGF.L KGF LN UNITED KINGDOM Paul S<strong>mid</strong>dy 44 20 7991 6757 Overweight GBP 2.35 GBP 1.82<br />
Kloeckner & Co KCOGn.DE KCO GR GERMANY Juergen Siebrecht +49 211 910 3350 Overweight EUR 68.00 EUR 37.32<br />
Kloeckner-Werke KLKG.DE KLK GR GERMANY Richard Schramm +49 211 910 2837 Underweight EUR 14.40 EUR 15.38<br />
Koenig & Bauer SKBG.DE SKB GR GERMANY Richard Schramm +49 211 910 2837 Neutral EUR 27.50 EUR 24.50<br />
Korian KORI.PA KORI FP FRANCE Murielle Andre-Pinard 33 1 56 52 43 16 Underweight EUR 29.50 EUR 33.82<br />
KRONES KRNG.F KRN GR GERMANY Richard Schramm +49 211 910 2837 Neutral EUR 60.00 EUR 59.92<br />
Kuehne & Nagel KNIN.S KNIN SW SWITZERLAND Robin Byde 44 20 7991 6816 Neutral CHF 125.00 CHF 124.50<br />
KUKA IWKG.DE IWK GR GERMANY Richard Schramm +49 211 910 2837 Neutral EUR 29.00 EUR 29.38<br />
Ladbrokes Plc LAD.L LAD LN UNITED KINGDOM Mark Julio 44 20 7991 6753 Overweight GBP 5.00 GBP 4.12<br />
Lafuma LAFU.PA LAF FP FRANCE Emmanuelle Vigneron 33 1 56 52 43 19 Overweight EUR 70.00 EUR 52.10<br />
Lanxess LXSG.DE LXS GR GERMANY Sebastian Satz +49 211 910 2373 Overweight EUR 47.00 EUR 34.91<br />
Le Noble Age LNA.PA LNA FP FRANCE Murielle Andre-Pinard 33 1 56 52 43 16 Overweight EUR 22.40 EUR 21.50<br />
Legr<strong>and</strong> LEGD.PA LR FP FRANCE Colin Gibson 44 20 7991 6592 Neutral EUR 26.50 EUR 24.25<br />
LEONI LEOGn.DE LEO GR GERMANY Thorsten Zimmermann 49 211 9102852 Neutral EUR 39.60 EUR 45.38<br />
Les Nouveaux Constructeur NVC.PA LNC FP FRANCE Eric Lemarie 44 20 7991 6706 Overweight EUR 25.00 EUR 16.50<br />
Liberty International LII.L LII LN UNITED KINGDOM John Fraser-Andrews 44 20 7991 6732 Underweight GBP 10.65 GBP 11.22<br />
Lonmin LMI.L LMI LN UNITED KINGDOM Paul McTaggart 44 20 7991 6798 Neutral USD 36.50 USD 36.25<br />
Lupus Capital PLC LUP.L LUP LN UNITED KINGDOM Gary Murphy 44 20 7991 6749 Overweight GBP 0.25 GBP 0.14<br />
LVL Medical Groupe LVLM.PA LVL FP FRANCE Murielle Andre-Pinard 33 1 56 52 43 16 Overweight EUR 26.50 EUR 22.49<br />
Marfin Popular Bank MRBr.AT MARFB GA GREECE Sophia Skourti 30 210 6965214 Neutral EUR 10.10 EUR 10.34<br />
Masterflex MZXG.F MZX GR GERMANY Burkhard Weiss 49 211 910 3722 Overweight EUR 26.00 EUR 21.74<br />
Mediaset MS.MI MS IM ITALY Luigi Minerva 44 20 7991 6928 Underweight EUR 7.40 EUR 7.26<br />
Mediolanum MED.MI MED IM ITALY Kailesh Mistry 44 20 7991 6756 Neutral EUR 5.57 EUR 5.24<br />
Metka MTKr.AT METTK GA GREECE Vangelis Karanikas 30 210 6965 211 Overweight EUR 20.50 EUR 18.50<br />
Metso MEO1V.HE MEO1V FH FINLAND Colin Gibson 44 20 7991 6592 Neutral EUR 47.00 EUR 48.24<br />
Millennium & Copthorne MLC.L MLC LN UNITED KINGDOM Mark Julio 44 20 7991 6753 Neutral GBP 6.35 GBP 5.25<br />
MLP MLPG.DE MLP GR GERMANY Jesko Mayer-Wegelin +49 211 910 3719 Overweight EUR 17.00 EUR 10.42<br />
Mobistar MSTAR.BR MOBB BB BELGIUM Nicolas Cote-Colisson 44 20 7991 6826 Neutral EUR 68.00 EUR 61.93<br />
Motor Oil Hellas MORr.AT MOH GA GREECE Vangelis Karanikas 30 210 6965 211 Overweight EUR 20.50 EUR 18.68<br />
MPC Capital MPCG.DE MPC GR GERMANY Jesko Mayer-Wegelin +49 211 910 3719 Neutral EUR 64.00 EUR 60.30<br />
MTU Aero Engines MTXGn.DE MTX GR GERMANY Richard Schramm +49 211 910 2837 Neutral EUR 47.00 EUR 44.44<br />
Mytilineos Group MYTr.AT MYTIL GA GREECE Vangelis Karanikas 30 210 6965 211 Overweight EUR 42.70 EUR 43.00<br />
National Express Group NEX.L NEX LN UNITED KINGDOM Tommy Bryson 44 20 7991 6799 Overweight GBP 13.55 GBP 12.80<br />
Neuf Cegetel NEUF.PA NEUF FP FRANCE Nicolas Cote-Colisson 44 20 7991 6826 Overweight EUR 36.00 EUR 32.80<br />
New Star Asset Mgt NSAM.L NSAM LN UNITED KINGDOM Martin Cross +44 20 7991 6748 Neutral GBP 4.10 GBP 3.65<br />
Nexity NEXI.PA NXI FP FRANCE Eric Lemarie 44 20 7991 6706 Overweight EUR 73.00 EUR 46.50<br />
Next NXT.L NXT LN UNITED KINGDOM Paul S<strong>mid</strong>dy 44 20 7991 6757 Underweight GBP 18.60 GBP 20.85<br />
Nikanor PLC NKR.L NKR LN UNITED KINGDOM Paul McTaggart 44 20 7991 6798 Neutral GBP 6.40 GBP 6.14<br />
Norddeutsche Affinerie NAFG.DE NDA GR GERMANY Thorsten Zimmermann 49 211 9102852 Underweight EUR 20.00 EUR 31.48<br />
Nordex NDXGk.DE NDX1 GR GERMANY Burkhard Weiss 49 211 910 3722 Neutral EUR 34.50 EUR 37.22<br />
Northern Rock NRK.L NRK LN UNITED KINGDOM Robin Down 44 20 7991 6926 Neutral GBP 3.24 GBP 2.16<br />
OHB Technology OHBG.DE OHB GR GERMANY Richard Schramm +49 211 910 2837 Overweight EUR 16.30 EUR 13.20<br />
OnVista Group ONVG.DE ONV GR GERMANY Dominik Klarmann 49 211 910 3720 Overweight EUR 14.70 EUR 20.70<br />
OPAP OPAr.AT OPAP GA GREECE Paris Mantzavras 30 210 6965 210 Overweight EUR 31.00 EUR 28.16<br />
Oriflame Cosmetics SA ORIsdb.ST ORI SS SWEDEN S<strong>and</strong>y Beebee +1 212 525 5152 Neutral SEK 353.00 SEK 398.50<br />
Orpea ORP.PA ORP FP FRANCE Murielle Andre-Pinard 33 1 56 52 43 16 Underweight EUR 39.50 EUR 43.75<br />
Osiatis OSA.PA OSA FP FRANCE Antonin Baudry 33 1 56 52 43 25 Overweight EUR 8.20 EUR 6.33<br />
OVB Holding O4BG.DE 04B GR GERMANY Jesko Mayer-Wegelin +49 211 910 3719 Overweight EUR 32.00 EUR 21.30<br />
75
Mid cap<br />
<strong>European</strong> <strong>small</strong> <strong>and</strong> <strong>mid</strong> <strong>caps</strong><br />
17 October <strong>2007</strong><br />
abc<br />
HSBC <strong>European</strong> <strong>small</strong> <strong>and</strong> <strong>mid</strong>-cap coverage universe<br />
Name Reuters Bloomberg Country Analyst Phone Rating Target price Last close*<br />
Paddy Power PAP.I PWL ID IRELAND Mark Julio 44 20 7991 6753 Underweight EUR 24.75 EUR 25.30<br />
Panalpina Welt Transport PWTN.S PWTN SW SWITZERLAND Robin Byde 44 20 7991 6816 Neutral CHF 215.00 CHF 194.70<br />
Parsytec PAQGk.DE PAQ3 GR GERMANY Richard Schramm +49 211 910 2837 Neutral EUR 5.60 EUR 5.67<br />
Pennon Group PNN.L PNN LN UNITED KINGDOM Verity Mitchell 44 20 7991 6840 Neutral GBP 6.50 GBP 6.33<br />
Peter Hambro Mining plc POG.L POG LN UNITED KINGDOM Victor Flores +1 212 525 3053 Neutral GBP 13.00 GBP 13.76<br />
Petro-Geo Services (USD) PGS.OL PGS NO NORWAY David Phillips 44 207 991 2344 Neutral NLK 150.00 NLK 163.50<br />
Pfeiffer Vacuum PV.DE PFV GR GERMANY Thorsten Zimmermann 49 211 9102852 Neutral EUR 80.00 EUR 67.08<br />
Pfleiderer PFDGn.F PFD4 GR GERMANY Juergen Siebrecht +49 211 910 3350 Overweight EUR 25.00 EUR 18.08<br />
Phoenix SonnenStrom PS4G.DE PS4 GR GERMANY Burkhard Weiss 49 211 910 3722 Neutral EUR 20.00 EUR 23.75<br />
Pierre et Vacances PVAC.PA VAC FP FRANCE Emmanuelle Vigneron 33 1 56 52 43 19 Overweight EUR 128.00 EUR 100.00<br />
Piraeus Bank SA BOPr.AT TPEIR GA GREECE Sophia Skourti 30 210 6965214 Overweight EUR 31.50 EUR 26.40<br />
Public Power Corporation DEHr.AT PPC GA GREECE Paris Mantzavras 30 210 6965 210 Underweight EUR 16.00 EUR 28.28<br />
Puma PUMG.DE PUM GR GERMANY Erwan Rambourg 44 20 7991 6793 Neutral EUR 360.00 EUR 301.76<br />
PWO PWOG.DE PWO GR GERMANY Thorsten Zimmermann 49 211 9102852 Overweight EUR 42.40 EUR 37.30<br />
QSC QSCG.DE QSC GR GERMANY Dominik Klarmann 49 211 910 3720 Overweight EUR 5.20 EUR 3.55<br />
R. Stahl RSLG.DE RSL1 GR GERMANY Sebastian Satz +49 211 910 2373 Overweight EUR 37.50 EUR 38.66<br />
RAB Capital Plc RAB.L RAB LN UNITED KINGDOM Matthew Czepliewicz 44 20 7991 6709 Overweight GBP 1.46 GBP 1.06<br />
R<strong>and</strong>gold Resources GOLD.O GOLD US UNITED KINGDOM Victor Flores +1 212 525 3053 Neutral USD 32.00 USD 35.26<br />
Rank RNK.L RNK LN UNITED KINGDOM Mark Julio 44 20 7991 6753 Overweight GBP 2.40 GBP 1.10<br />
Rational RAAG.DE RAA GR GERMANY Richard Schramm +49 211 910 2837 Overweight EUR 169.00 EUR 156.00<br />
Rautaruukki RTRKS.HE RTRKS FH FINLAND Alan Coats 44 20 7991 6764 Underweight EUR 30.00 EUR 41.06<br />
Repower System RPWGn.DE RPW GR GERMANY Burkhard Weiss 49 211 910 3722 Overweight EUR 140.00 EUR 126.98<br />
Rexel RXL.PA RXL FP FRANCE Pierre Bosset +33 1 5652 4310 Overweight EUR 17.00 EUR 13.52<br />
Rezidor Hotel Group AB REZT.ST REZT SS SWEDEN Mark Julio 44 20 7991 6753 Overweight EUR 76.50 EUR 51.00<br />
Rheinmetall RHMG.DE RHM GR GERMANY Richard Schramm +49 211 910 2837 Overweight EUR 69.00 EUR 61.27<br />
Rodriguez Group RDGP.PA ROD FP FRANCE Emmanuelle Vigneron 33 1 56 52 43 19 Underweight EUR 35.00 EUR 33.58<br />
Rotork ROR.L ROR LN UNITED KINGDOM Gary Murphy 44 20 7991 6749 Neutral GBP 8.50 GBP 10.94<br />
SAF HOLLAND SFQN.DE SFQ GR GERMANY Thorsten Zimmermann 49 211 9102852 Overweight EUR 18.60 EUR 14.50<br />
Safilo SPA SFLG.MI SFL IM ITALY Antoine Belge +331 5652 4347 Overweight EUR 4.60 EUR 3.52<br />
Safran SAF.PA SAG FP FRANCE Edward Stacey 44 20 7991 6837 Overweight EUR 19.80 EUR 17.44<br />
Saft Groupe SA S1A.PA SAFT FP FRANCE Pierre Bosset +33 1 5652 4310 Overweight EUR 35.00 EUR 32.86<br />
Salzgitter SZGG.DE SZG GR GERMANY Juergen Siebrecht +49 211 910 3350 Neutral EUR 140.00 EUR 147.46<br />
Sarantis Cosmetics SRSr.AT SAR GA GREECE Joanna Telioudi 30 210 6965209 Overweight EUR 12.90 EUR 12.50<br />
SBM Offshore SBMO.AS SBMO NA NETHERLANDS David Phillips 44 207 991 2344 Overweight EUR 35.00 EUR 28.34<br />
Schroders SDR.L SDR LN UNITED KINGDOM Martin Cross +44 20 7991 6748 Overweight GBP 15.50 GBP 14.73<br />
Scor SCOR.PA SCR FP FRANCE John Russell +852 2822 4321 Neutral EUR 19.50 EUR 18.76<br />
Seadrill Ltd SDRL.OL SDRL NO NORWAY David Phillips 44 207 991 2344 Overweight NLK 160.00 NLK 131.75<br />
SEB SA SEBF.PA SK FP FRANCE Emmanuelle Vigneron 33 1 56 52 43 19 Overweight EUR 162.00 EUR 131.00<br />
Seche Environnement CCHE.PA SCHP FP FRANCE Murielle Andre-Pinard 33 1 56 52 43 16 Overweight EUR 138.00 EUR 123.99<br />
Segro SGRO.L SGRO LN UNITED KINGDOM John Fraser-Andrews 44 20 7991 6732 Overweight GBP 5.80 GBP 5.00<br />
Severn Trent SVT.L SVT LN UNITED KINGDOM Verity Mitchell 44 20 7991 6840 Neutral GBP 14.50 GBP 14.35<br />
SGL Carbon SGCG.DE SGL GR GERMANY Juergen Siebrecht +49 211 910 3350 Overweight EUR 41.00 EUR 44.30<br />
SGS SA SGSN.VX SGSN VX SWITZERLAND Pierre Bosset +33 1 5652 4310 Overweight CHF 1710.00 CHF 1524.00<br />
Singulus SNGG.DE SNG GR GERMANY Thorsten Zimmermann 49 211 9102852 Neutral EUR 12.30 EUR 8.65<br />
SKF SKFb.ST SKFB SS SWEDEN Colin Gibson 44 20 7991 6592 Neutral SEK 155.00 SEK 141.00<br />
Smith (WH) Group SMWH.L SMWH LN UNITED KINGDOM Paul S<strong>mid</strong>dy 44 20 7991 6757 Neutral GBP 4.00 GBP 3.91<br />
Smiths Group SMIN.L SMIN LN UNITED KINGDOM Edward Stacey 44 20 7991 6837 Neutral GBP 11.00 GBP 11.00<br />
Solarworld AG SWVG.DE SWV GR GERMANY Burkhard Weiss 49 211 910 3722 Overweight EUR 44.00 EUR 43.47<br />
Sopra SOPR.PA SOP FP FRANCE Antonin Baudry 33 1 56 52 43 25 Neutral EUR 75.00 EUR 64.65<br />
Spectris SXS.L SXS LN UNITED KINGDOM Gary Murphy 44 20 7991 6749 Overweight GBP 10.10 GBP 9.03<br />
Spirax-Sarco SPX.L SPX LN UNITED KINGDOM Gary Murphy 44 20 7991 6749 Neutral GBP 10.50 GBP 10.37<br />
SSAB SSABa.ST SSABA SS SWEDEN Alan Coats 44 20 7991 6764 Neutral SEK 274.51 SEK 248.50<br />
STADA Arzneimittel STAGN.DE SAZ GR GERMANY Christian Packebusch +49 0 211 9102446 Overweight EUR 58.00 EUR 43.21<br />
Stagecoach Group SGC.L SGC.LN UNITED KINGDOM Tommy Bryson 44 20 7991 6799 Underweight GBP 2.10 GBP 2.41<br />
Steria TERI.PA RIA FP FRANCE Antonin Baudry 33 1 56 52 43 25 Overweight EUR 51.00 EUR 37.08<br />
Surteco SURG.DE SUR GR GERMANY Juergen Siebrecht +49 211 910 3350 Overweight EUR 40.00 EUR 36.90<br />
Süss MicroTec SMHG.DE SMH GR GERMANY Thorsten Zimmermann 49 211 9102852 Overweight EUR 10.90 EUR 7.10<br />
Symrise SY1G.DE SY1 GR GERMANY Sebastian Satz +49 211 910 2373 Overweight EUR 23.00 EUR 21.08<br />
TA Triumph-Adler TWNG.DE TWN GR GERMANY Burkhard Weiss 49 211 910 3722 Overweight EUR 2.50 EUR 1.68<br />
Techem TNHG.DE TNH GR GERMANY Burkhard Weiss 49 211 910 3722 Neutral EUR 48.00 EUR 48.90<br />
Technip TECF.PA TEC FP FRANCE David Phillips 44 207 991 2344 Overweight EUR 77.00 EUR 67.62<br />
technotrans TTRG.DE TTR GR GERMANY Richard Schramm +49 211 910 2837 Overweight EUR 25.50 EUR 19.64<br />
Tele2 TEL2b.ST TEL2B SS SWEDEN Stephen Howard 44 20 7991 6820 Overweight SEK 145.00 SEK 142.00<br />
Telecinco TL5.MC TL5 SQ SPAIN Luigi Minerva 44 20 7991 6928 Neutral EUR 22.00 EUR 18.10<br />
Telekom Austria TELA.VI TKA AV AUSTRIA Nicolas Cote-Colisson 44 20 7991 6826 Neutral EUR 21.00 EUR 18.85<br />
Telenet TNET.BR TNET BB BELGIUM Nicolas Cote-Colisson 44 20 7991 6826 Neutral EUR 25.30 EUR 25.62<br />
76
Mid cap<br />
<strong>European</strong> <strong>small</strong> <strong>and</strong> <strong>mid</strong> <strong>caps</strong><br />
17 October <strong>2007</strong><br />
abc<br />
HSBC <strong>European</strong> <strong>small</strong> <strong>and</strong> <strong>mid</strong>-cap coverage universe<br />
Name Reuters Bloomberg Country Analyst Phone Rating Target price Last close*<br />
Teleperformance ROCH.PA RCF FP FRANCE Antonin Baudry 33 1 56 52 43 25 Overweight EUR 38.00 EUR 27.96<br />
Terna SA TERr.AT TERR GA GREECE Vangelis Karanikas 30 210 6965 211 Overweight EUR 15.50 EUR 15.42<br />
TGS Nopec Geophysical TGS.OL TGS NO NORWAY David Phillips 44 207 991 2344 Overweight NLK 145.00 NLK 90.40<br />
Thales TCFP.PA HO FP FRANCE Edward Stacey 44 20 7991 6837 Overweight EUR 47.00 EUR 43.67<br />
Thus Group THUS.L THUS LN UNITED KINGDOM Steve Scruton 44 20 7991 6819 Overweight GBP 2.00 GBP 1.46<br />
Titan Cement TTNr.AT TITK GA GREECE Joanna Telioudi 30 210 6965209 Neutral EUR 40.00 EUR 35.30<br />
TOD'S TOD.MI TOD IM ITALY Erwan Rambourg 44 20 7991 6793 Overweight EUR 73.00 EUR 63.95<br />
Travis Perkins TPK.L TPK LN UNITED KINGDOM Paul S<strong>mid</strong>dy 44 20 7991 6757 Overweight GBP 17.60 GBP 15.12<br />
Trigano TRIA.PA TRI FP FRANCE Emmanuelle Vigneron 33 1 56 52 43 19 Underweight EUR 31.00 EUR 33.85<br />
United Internet UTDI.DE UTDI GR GERMANY Dominik Klarmann +49 211 910 3720 Neutral EUR 16.50 EUR14.80<br />
Vedanta VED.L VED LN UNITED KINGDOM Paul McTaggart 44 20 7991 6798 Overweight GBP 27.00 GBP 22.07<br />
Vivartia SA VIVr.AT VIVART GA GREECE Paris Mantzavras 30 210 6965 210 Underweight EUR 25.00 EUR 26.10<br />
Vossloh VOSG.DE VOS GR GERMANY Juergen Siebrecht +49 211 910 3350 Overweight EUR 91.00 EUR 78.47<br />
Wacker Chemie WCHG.DE WCH GR GERMANY Sebastian Satz +49 211 910 2373 Neutral EUR 139.54 EUR 156.84<br />
WashTec WSUG.DE WSU GR GERMANY Burkhard Weiss 49 211 910 3722 Overweight EUR 18.00 EUR 13.90<br />
Weir Group WEIR.L WEIR LN UNITED KINGDOM Gary Murphy 44 20 7991 6749 Neutral GBP 8.60 GBP 8.29<br />
William Hill WMH.L WMH LN UNITED KINGDOM Mark Julio 44 20 7991 6753 Neutral GBP 6.80 GBP 6.24<br />
Wincor Nixdorf WING.DE WIN GY GERMANY Richard Schramm +49 211 910 2837 Underweight EUR 57.00 EUR 64.76<br />
X5 NV PJPq.L FIVE LI NETHERLANDS Paul S<strong>mid</strong>dy 44 20 7991 6757 Underweight USD 25.00 USD 35.05<br />
*prices as at 15 October <strong>2007</strong><br />
Source: HSBC estimates<br />
77
Mid cap<br />
<strong>European</strong> <strong>small</strong> <strong>and</strong> <strong>mid</strong> <strong>caps</strong><br />
17 October <strong>2007</strong><br />
abc<br />
Notes<br />
78
Mid cap<br />
<strong>European</strong> <strong>small</strong> <strong>and</strong> <strong>mid</strong> <strong>caps</strong><br />
17 October <strong>2007</strong><br />
abc<br />
Notes<br />
79
Mid cap<br />
<strong>European</strong> <strong>small</strong> <strong>and</strong> <strong>mid</strong> <strong>caps</strong><br />
17 October <strong>2007</strong><br />
abc<br />
Disclosure appendix<br />
Analyst certification<br />
The following analyst(s), who is(are) primarily responsible for this report, certifies(y) that the opinion(s) on the subject<br />
security(ies) or issuer(s) <strong>and</strong> any other views or forecasts expressed herein accurately reflect their personal view(s) <strong>and</strong> that no<br />
part of their compensation was, is or will be directly or indirectly related to the specific recommendation(s) or views contained<br />
in this research report: Burkhard Weiss, Thomas Teetz, Christian Packebusch, Sebastian Satz, Juergen Siebrecht, Gary<br />
Murphy, Pierre Bosset, Joanna Telioudi, Murielle Andre-Pinard, Christophe Quarante, Antonin Baudry, Vangelis Karanikas,<br />
Spiros Tsangalakis, Tommy Bryson, Kevin Gardiner <strong>and</strong> Mathilde Lemoine<br />
Important disclosures<br />
<strong>Stock</strong> ratings <strong>and</strong> basis for financial analysis<br />
HSBC believes that investors utilise various disciplines <strong>and</strong> investment horizons when making investment decisions, which<br />
depend largely on individual circumstances such as the investor's existing holdings, risk tolerance <strong>and</strong> other considerations.<br />
Given these differences, HSBC has two principal aims in its equity research: 1) to identify long-term investment opportunities<br />
based on particular themes or ideas that may affect the future earnings or cash flows of companies on a 12 month time horizon;<br />
<strong>and</strong> 2) from time to time to identify short-term investment opportunities that are derived from fundamental, quantitative,<br />
technical or event-driven techniques on a 0-3 month time horizon <strong>and</strong> which may differ from our long-term investment rating.<br />
HSBC has assigned ratings for its long-term investment opportunities as described below.<br />
This report addresses only the long-term investment opportunities of the companies referred to in the report. As <strong>and</strong> when<br />
HSBC publishes a short-term trading idea the stocks to which these relate are identified on the website at<br />
www.hsbcnet.com/research. Details of these short-term investment opportunities can be found under the Reports section of this<br />
website.<br />
HSBC believes an investor's decision to buy or sell a stock should depend on individual circumstances such as the investor's<br />
existing holdings <strong>and</strong> other considerations. Different securities firms use a variety of ratings terms as well as different rating<br />
systems to describe their recommendations. Investors should carefully read the definitions of the ratings used in each research<br />
report. In addition, because research reports contain more complete information concerning the analysts' views, investors<br />
should carefully read the entire research report <strong>and</strong> should not infer its contents from the rating. In any case, ratings should not<br />
be used or relied on in isolation as investment advice.<br />
Rating definitions for long-term investment opportunities<br />
<strong>Stock</strong> ratings<br />
HSBC assigns ratings to its stocks in this sector on the following basis:<br />
For each stock we set a required rate of return calculated from the risk free rate for that stock's domestic, or as appropriate,<br />
regional market <strong>and</strong> the relevant equity risk premium established by our strategy team. The price target for a stock represents<br />
the value the analyst expects the stock to reach over our performance horizon. The performance horizon is 12 months. For a<br />
stock to be classified as Overweight, the implied return must exceed the required return by at least 5 percentage points over the<br />
next 12 months (or 10 percentage points for a stock classified as Volatile*). For a stock to be classified as Underweight, the<br />
stock must be expected to underperform its required return by at least 5 percentage points over the next 12 months (or 10<br />
percentage points for a stock classified as Volatile*). <strong>Stock</strong>s between these b<strong>and</strong>s are classified as Neutral.<br />
Our ratings are re-calibrated against these b<strong>and</strong>s at the time of any 'material change' (initiation of coverage, change of volatility<br />
status or change in price target). Notwithst<strong>and</strong>ing this, <strong>and</strong> although ratings are subject to ongoing management review,<br />
expected returns will be permitted to move outside the b<strong>and</strong>s as a result of normal share price fluctuations without necessarily<br />
triggering a rating change.<br />
80
Mid cap<br />
<strong>European</strong> <strong>small</strong> <strong>and</strong> <strong>mid</strong> <strong>caps</strong><br />
17 October <strong>2007</strong><br />
abc<br />
*A stock will be classified as volatile if its historical volatility has exceeded 40%, if the stock has been listed for less than 12<br />
months (unless it is in an industry or sector where volatility is low) or if the analyst expects significant volatility. However,<br />
stocks which we do not consider volatile may in fact also behave in such a way. Historical volatility is defined as the past<br />
month's average of the daily 365-day moving average volatilities. In order to avoid misleadingly frequent changes in rating,<br />
however, volatility has to move 2.5 percentage points past the 40% benchmark in either direction for a stock's status to change.<br />
Prior to this, from 7 June 2005 HSBC applied a ratings structure which ranked the stocks according to their notional target<br />
price vs current market price <strong>and</strong> then categorised (approximately) the top 40% as Overweight, the next 40% as Neutral <strong>and</strong><br />
the last 20% as Underweight. The performance horizon is 2 years. The notional target price was defined as the <strong>mid</strong>-point of the<br />
analysts' valuation for a stock.<br />
From 15 November 2004 to 7 June 2005, HSBC carried no ratings <strong>and</strong> concentrated on long-term thematic reports which<br />
identified themes <strong>and</strong> trends in industries, but did not make a conclusion as to the investment action that potential investors<br />
should take.<br />
Prior to 15 November 2004, HSBC's ratings system was based upon a two-stage recommendation structure: a combination of<br />
the analysts' view on the stock relative to its sector <strong>and</strong> the sector call relative to the market, together giving a view on the<br />
stock relative to the market. The sector call was the responsibility of the strategy team, set in co-operation with the analysts.<br />
For other companies, HSBC showed a recommendation relative to the market. The performance horizon was 6-12 months. The<br />
target price was the level the stock should have traded at if the market accepted the analysts' view of the stock.<br />
Rating distribution for long-term investment opportunities<br />
As of 16 October <strong>2007</strong>, the distribution of all ratings published is as follows:<br />
Overweight (Buy) 50% (25% of these provided with Investment Banking Services)<br />
Neutral (Hold) 31% (23% of these provided with Investment Banking Services)<br />
Underweight (Sell) 19% (14% of these provided with Investment Banking Services)<br />
81
Mid cap<br />
<strong>European</strong> <strong>small</strong> <strong>and</strong> <strong>mid</strong> <strong>caps</strong><br />
17 October <strong>2007</strong><br />
abc<br />
HSBC & Analyst disclosures<br />
Disclosure checklist<br />
Company Ticker Recent price Price Date Disclosure<br />
DEUTZ DEZG.F 9.25 15-Oct-<strong>2007</strong> 1, 3, 4, 5, 6<br />
FIRSTGROUP FGP.L 7.30 16-Oct-<strong>2007</strong> 2, 3, 5, 6, 7<br />
HOCHTIEF AG HOTG.DE 92.10 15-Oct-<strong>2007</strong> 2, 3, 4, 5, 6, 7<br />
LANXESS LXSG.F 34.91 15-Oct-<strong>2007</strong> 3, 4<br />
METKA MTKr.AT 18.50 15-Oct-<strong>2007</strong> 5<br />
SPECTRIS SXS.L 8.90 16-Oct-<strong>2007</strong> 4<br />
SR TELEPERFORMANCE ROCH.PA 27.96 15-Oct-<strong>2007</strong> 1, 6<br />
Source: HSBC<br />
1 HSBC* has managed or co-managed a public offering of securities for this company within the past 12 months.<br />
2 HSBC expects to receive or intends to seek compensation for investment banking services from this company in the next<br />
3 months.<br />
3 At the time of publication of this report, HSBC is a market maker in securities issued by this company.<br />
4 As of 30 September <strong>2007</strong> HSBC beneficially owned 1% or more of a class of common equity securities of this company.<br />
5 As of 31 August <strong>2007</strong>, this company was a client of HSBC or had during the preceding 12 month period been a client of<br />
<strong>and</strong>/or paid compensation to HSBC in respect of investment banking services.<br />
6 As of 31 August <strong>2007</strong>, this company was a client of HSBC or had during the preceding 12 month period been a client of<br />
<strong>and</strong>/or paid compensation to HSBC in respect of non-investment banking-securities related services.<br />
7 As of 31 August <strong>2007</strong>, this company was a client of HSBC or had during the preceding 12 month period been a client of<br />
<strong>and</strong>/or paid compensation to HSBC in respect of non-securities services.<br />
8 A covering analyst/s has received compensation from this company in the past 12 months.<br />
9 A covering analyst/s or a member of his/her household has a financial interest in the securities of this company, as<br />
detailed below.<br />
10 A covering analyst/s or a member of his/her household is an officer, director or supervisory board member of this<br />
company, as detailed below.<br />
Analysts are paid in part by reference to the profitability of HSBC which includes investment banking revenues.<br />
For disclosures in respect of any company, please see the most recently published report on that company available at<br />
www.hsbcnet.com/research.<br />
* HSBC Legal Entities are listed in the Disclaimer below.<br />
Additional disclosures<br />
1 This report is dated as at 17 October <strong>2007</strong>.<br />
2 All market data included in this report are dated as at close 12 October <strong>2007</strong>, unless otherwise indicated in the report.<br />
3 HSBC has procedures in place to identify <strong>and</strong> manage any potential conflicts of interest that arise in connection with its<br />
Research business. HSBC's analysts <strong>and</strong> its other staff who are involved in the preparation <strong>and</strong> dissemination of Research<br />
operate <strong>and</strong> have a management reporting line independent of HSBC's Investment Banking business. Chinese Wall<br />
procedures are in place between the Investment Banking <strong>and</strong> Research businesses to ensure that any confidential <strong>and</strong>/or<br />
price sensitive information is h<strong>and</strong>led in an appropriate manner.<br />
4 As of 30 September <strong>2007</strong>, HSBC beneficially owned 2% or more of a class of common equity securities of the following<br />
company(ies) : LANXESS , HOCHTIEF AG , DEUTZ<br />
5 HSBC Trinkaus & Burkhardt acts as a designated sponsor to the following companies, <strong>and</strong> as such has an agreement with<br />
such companies to engage in market making activities <strong>and</strong>/or to publish research in connection with the securities of the<br />
following company(ies) : HOCHTIEF AG , DEUTZ<br />
82
Mid cap<br />
<strong>European</strong> <strong>small</strong> <strong>and</strong> <strong>mid</strong> <strong>caps</strong><br />
17 October <strong>2007</strong><br />
abc<br />
Disclaimer<br />
* Legal entities as at 22 August <strong>2007</strong><br />
'UAE' HSBC Bank Middle East Limited, Dubai; 'HK' The Hongkong <strong>and</strong> Shanghai Banking<br />
Corporation Limited, Hong Kong; 'TW' HSBC Securities (Taiwan) Corporation Limited; 'CA'<br />
HSBC Securities (Canada) Inc, Toronto; HSBC Bank, Paris branch; HSBC France; 'DE' HSBC<br />
Trinkaus & Burkhardt AG, Dusseldorf; 000 HSBC Bank (RR), Moscow; 'IN' HSBC Securities<br />
<strong>and</strong> Capital Markets (India) Private Limited, Mumbai; 'JP' HSBC Securities (Japan) Limited,<br />
Tokyo; 'EG' HSBC Securities Egypt S.A.E., Cairo; 'CN' HSBC Investment Bank Asia Limited,<br />
Beijing Representative Office; The Hongkong <strong>and</strong> Shanghai Banking Corporation Limited,<br />
Singapore branch; The Hongkong <strong>and</strong> Shanghai Banking Corporation Limited, Seoul Securities<br />
Branch; HSBC Securities (South Africa) (Pty) Ltd, Johannesburg; 'GR' HSBC Pantelakis<br />
Securities S.A., Athens; HSBC Bank plc, London, Madrid, Milan, <strong>Stock</strong>holm, Tel Aviv, 'US'<br />
HSBC Securities (USA) Inc, New York; HSBC Yatirim Menkul Degerler A.S., Istanbul; HSBC<br />
México, S.A., Institución de Banca Múltiple, Grupo Financiero HSBC, HSBC Bank Brasil S.A. -<br />
Banco Múltiplo.<br />
Issuer of report<br />
HSBC Trinkaus & Burkhardt AG<br />
Königsallee 21/23<br />
D-40212 Düsseldorf<br />
Germany<br />
Telephone: +49 211 910-0<br />
Fax: +49 211 910 33 20<br />
Website: www.hsbcnet.com/research<br />
This document has been issued by HSBC Trinkaus & Burkhardt AG (“HSBC”) for the information of its customers only. If it is received by a<br />
customer of an affiliate of HSBC, its provision to the recipient is subject to the terms of business in place between the recipient <strong>and</strong> such<br />
affiliate. This document is not <strong>and</strong> should not be construed as an offer to sell or the solicitation of an offer to purchase or subscribe for any<br />
investment. HSBC has based this document on information obtained from sources it believes to be reliable but which it has not independently<br />
verified; HSBC makes no guarantee, representation or warranty <strong>and</strong> accepts no responsibility or liability as to its accuracy or completeness.<br />
Expressions of opinion are those of the Research Division of HSBC only <strong>and</strong> are subject to change without notice. The information <strong>and</strong><br />
opinions contained within the research reports are based upon publicly available information at the time of publication which are subject to<br />
change from time to time. Past performance is not necessarily a guide to future performance. The value of any investment or income may go<br />
down as well as up <strong>and</strong> you may not get back the full amount invested. Where an investment is denominated in a currency other than the local<br />
currency of the recipient of the research report, changes in the exchange rates may have an adverse effect on the value, price or income of that<br />
investment. In case of investments for which there is no recognised market it may be difficult for investors to sell their investments or to<br />
obtain reliable information about its value or the extent of the risk to which it is exposed.<br />
HSBC Securities (USA) Inc. accepts responsibility for the content of this research report prepared by its non-US foreign affiliate. All U.S.<br />
persons receiving <strong>and</strong>/or accessing this report <strong>and</strong> wishing to effect transactions in any security discussed herein should do so with HSBC<br />
Securities (USA) Inc. in the United States <strong>and</strong> not with its non-US foreign affiliate, the issuer of this report.<br />
In the UK this report may only be distributed to persons of a kind described in Article 19(5) of the Financial Services <strong>and</strong> Markets Act 2000<br />
(Financial Promotion) Order 2001. The protections afforded by the UK regulatory regime are available only to those dealing with a<br />
representative of HSBC Bank plc in the UK. In Singapore, this publication is distributed by The Hongkong <strong>and</strong> Shanghai Banking<br />
Corporation Limited, Singapore Branch for the general information of institutional investors or other persons specified in Sections 274 <strong>and</strong><br />
304 of the Securities <strong>and</strong> Futures Act (Chapter 289) (“SFA”) <strong>and</strong> accredited investors <strong>and</strong> other persons in accordance with the conditions<br />
specified in Sections 275 <strong>and</strong> 305 of the SFA. This publication is not a prospectus as defined in the SFA. It may not be further distributed in<br />
whole or in part for any purpose. The Hongkong <strong>and</strong> Shanghai Banking Corporation Limited Singapore Branch is regulated by the Monetary<br />
Authority of Singapore. In Australia, this publication has been distributed by HSBC <strong>Stock</strong>broking (Australia) Pty Limited (ABN 60 007 114<br />
605) for the general information of its “wholesale” customers (as defined in the Corporations Act 2001). It makes no representations that the<br />
products or services mentioned in this document are available to persons in Australia or are necessarily suitable for any particular person or<br />
appropriate in accordance with local law. No consideration has been given to the particular investment objectives, financial situation or<br />
particular needs of any recipient. In Japan, this publication has been distributed by HSBC Securities (Japan) Limited. In Hong Kong, this<br />
document has been distributed by The Hongkong <strong>and</strong> Shanghai Banking Corporation Limited in the conduct of its Hong Kong regulated<br />
business for the information of its institutional <strong>and</strong> professional customers; it is not intended for <strong>and</strong> should not be distributed to retail<br />
customers in Hong Kong. The Hongkong <strong>and</strong> Shanghai Banking Corporation Limited makes no representations that the products or services<br />
mentioned in this document are available to persons in Hong Kong or are necessarily suitable for any particular person or appropriate in<br />
accordance with local law. All inquiries by such recipients must be directed to The Hongkong <strong>and</strong> Shanghai Banking Corporation Limited. It<br />
may not be further distributed in whole or in part for any purpose. HSBC Trinkaus & Burkhardt AG is regulated by the Federal Financial<br />
Supervisory Authority ("BaFin").<br />
© Copyright. HSBC Trinkaus & Burkhardt AG <strong>2007</strong>, ALL RIGHTS RESERVED. No part of this publication may be reproduced, stored in a<br />
retrieval system, or transmitted, on any form or by any means, electronic, mechanical, photocopying, recording, or otherwise, without the<br />
prior written permission of HSBC Trinkaus & Burkhardt AG. MICA (P) 316/06/<strong>2007</strong><br />
83
abc<br />
<strong>European</strong> <strong>small</strong> & <strong>mid</strong>-cap team<br />
Small <strong>and</strong> <strong>mid</strong>-cap research<br />
David May<br />
Head of Equity Research, EMEA<br />
+44 207 991 6781 david.may@hsbcib.com<br />
Product Coordinator Small <strong>and</strong> Mid Caps<br />
Burkhard Weiss<br />
Analyst, Product Coordinator S/M Cap Research<br />
+49 211 910 3722 burkhard.weiss@hsbc.de<br />
France<br />
Pierre Bosset<br />
Analyst, Head of Equity Research<br />
+33 1 5652 4310 pierre.bosset@hsbc.com<br />
Murielle Andre-Pinard<br />
Analyst<br />
+33 1 5652 4316 murielle.<strong>and</strong>re.pinard@hsbc.com<br />
Antonin Baudry<br />
Analyst<br />
+33 1 5652 4325 antonin.baudry@hsbc.fr<br />
Christophe Quarante<br />
Analyst<br />
+33 1 5652 4312 christophe.quarante@hsbc.com<br />
Emmanuelle Vigneron<br />
Analyst<br />
+33 1 5652 4319 emmanuelle.vigneron@hsbc.com<br />
Germany<br />
Thomas Teetz<br />
Analyst, Head of Equity Research<br />
+49 211 910 2353 thomas.teetz@hsbc.de<br />
Dominik Klarmann<br />
Analyst<br />
+49 211 910 3720 dominik.klarmann@hsbc.de<br />
Jesko Mayer-Wegelin<br />
Analyst<br />
+49 211 910 3719 jesko.meyer-wegelin@hsbc.de<br />
Christian Packebusch<br />
Analyst<br />
+49 211 910 2446 christian.packebusch@hsbc.de<br />
Sebastian Satz<br />
Analyst<br />
+49 211 910 2373 sebastian.satz@hsbc.de<br />
Richard Schramm<br />
Analyst<br />
+49 211 910 2837 richard.schramm@hsbc.de<br />
Juergen Siebrecht<br />
Analyst<br />
+49 211 910 3350 juergen.siebrecht@hsbc.de<br />
Burkhard Weiss<br />
Analyst<br />
+49 211 910 3722 burkhard.weiss@hsbc.de<br />
Thorsten Zimmermann<br />
Analyst<br />
+49 211 910 2852 thorsten.zimmermann@hsbc.de<br />
Greece<br />
Joanna Telioudi<br />
Analyst, Head of Equity Research<br />
+30 21 0696 5209 joanna.telioudi@hsbc.gr<br />
Vangelis Karanikas<br />
Analyst<br />
+30 21 0696 5211 vangelis.karanikas@hsbc.gr<br />
Paris Mantzavras<br />
Analyst<br />
+30 21 0696 5210 paris.mantzavras@hsbc.gr<br />
Yiannis Sinapis<br />
Analyst<br />
+30 21 0696 5215 yiannis.sinapis@hsbc.gr<br />
Spiros Tsangalakis<br />
Analyst<br />
+30 21 0696 5212 spiros.tsangalakis@hpss.hsbc.gr<br />
UK<br />
S<strong>and</strong>y Beebee<br />
Analyst<br />
+1 212 525 5152 s<strong>and</strong>y.beebee@us.hsbc.com<br />
Tommy Bryson<br />
Analyst<br />
+44 20 7991 6779 tommy.bryson@hsbcib.com<br />
Robin Byde<br />
Analyst<br />
+44 20 7991 6816 robin.byde@hsbcib.com<br />
Robert Clover<br />
Analyst<br />
+44 20 7991 6741 robert.clover@hsbcib.com<br />
Matthew Czepliewicz<br />
Analyst<br />
+44 20 7991 6709 matthew.czepliewicz@hsbcib.com<br />
John Fraser-Andrews<br />
Analyst<br />
+44 20 7991 6732 john.fraser-<strong>and</strong>rews@hsbcib.com<br />
Mark Julio<br />
Analyst<br />
+44 20 7991 6753 mark.julio@hsbcib.com<br />
Paul McTaggart<br />
Analyst<br />
+44 20 7991 6798 paul.mctaggart@hsbcib.com<br />
Verity Mitchell<br />
Analyst<br />
+44 20 7991 6840 verity.mitchell@hsbcib.com<br />
Gary Murphy<br />
Analyst<br />
+44 20 7991 6749 gary.murphy@hsbcib.com<br />
Erwan Rambourg<br />
Analyst<br />
+44 20 7991 6793 erwan.rambourg@hsbcib.com<br />
Paul Rossington<br />
Analyst<br />
+44 20 7991 6734 paul.rossington@hsbcib.com<br />
Steve Scruton<br />
Analyst<br />
+44 20 7991 6891 steve.scruton@hsbcib.com<br />
Paul S<strong>mid</strong>dy<br />
Analyst<br />
+44 20 7991 6757 paul.s<strong>mid</strong>dy@hsbcib.com<br />
Small <strong>and</strong> Mid-Cap Sales<br />
Head of Sales<br />
Justin Shinebourne<br />
+44 20 7991 5354 justin.shinebourne@hsbcib.com<br />
Paris Sales Team<br />
Laurent Kieffer<br />
+33 1 56 52 40 03 laurent.kieffer@hsbc.com<br />
David Rideau<br />
+33 1 56 52 40 25 david.rideau@hsbc.com<br />
Athens Sales Team<br />
Luca Focardi<br />
+30 210 6965 128 luca.focardi@hsbc.gr<br />
Sakis Michalarakos<br />
+30 210 6965 129 sakis.michalarakos@hsbc.gr<br />
London Sales Team<br />
Mark van Lonkhuyzen<br />
+44 20 7991 1329 mark.van.lonkhuyzen@hsbcib.com<br />
Binoy Malde<br />
+ 44 20 7991 5517 binoy.malde@hsbcib.com<br />
Katen Patel<br />
+44 20 7991 5082 katen.patel@hsbcib.com<br />
Giles Wadman<br />
+44 20 7991 5393 giles.wadman@hsbcib.com<br />
Duesseldorf Sales Team<br />
Michael Busch<br />
+49 211 910 4806 michael.busch@hsbctrinkaus.de<br />
Tim Juskowiak<br />
+49 211 910 4452 tim.juskowiak@hsbctrinkaus.de<br />
Sonja Kimmeskamp<br />
+49 211 910 4854 sonja.kimmeskamp@hsbctrinkaus.de<br />
Samir Kops<br />
+49 211 910 4483 samir.kops@hsbctrinkaus.de<br />
Ines Struck<br />
+49 211 910 4807 ines.struck@hsbctrinkaus.de