European small and mid caps-Stock picks Q4 2007-Q1 2008 - Fourlis
European small and mid caps-Stock picks Q4 2007-Q1 2008 - Fourlis
European small and mid caps-Stock picks Q4 2007-Q1 2008 - Fourlis

You also want an ePaper? Increase the reach of your titles
YUMPU automatically turns print PDFs into web optimized ePapers that Google loves.
Mid cap<br />
<strong>European</strong> <strong>small</strong> <strong>and</strong> <strong>mid</strong> <strong>caps</strong><br />
17 October <strong>2007</strong><br />
abc<br />
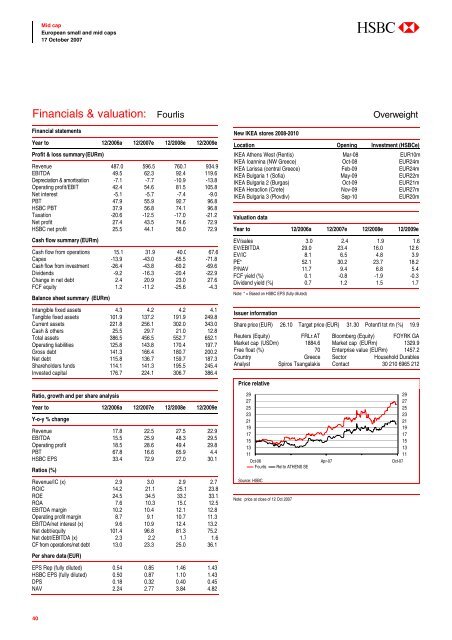
Financials & valuation: <strong>Fourlis</strong><br />
Financial statements<br />
Year to 12/2006a 12/<strong>2007</strong>e 12/<strong>2008</strong>e 12/2009e<br />
Profit & loss summary (EURm)<br />
Revenue 487.0 596.5 760.7 934.9<br />
EBITDA 49.5 62.3 92.4 119.6<br />
Depreciation & amortisation -7.1 -7.7 -10.9 -13.8<br />
Operating profit/EBIT 42.4 54.6 81.5 105.8<br />
Net interest -5.1 -5.7 -7.4 -9.0<br />
PBT 47.9 55.9 92.7 96.8<br />
HSBC PBT 37.9 56.8 74.1 96.8<br />
Taxation -20.6 -12.5 -17.0 -21.2<br />
Net profit 27.4 43.5 74.6 72.9<br />
HSBC net profit 25.5 44.1 56.0 72.9<br />
Cash flow summary (EURm)<br />
Cash flow from operations 15.1 31.9 40.0 67.6<br />
Capex -13.9 -43.0 -65.5 -71.8<br />
Cash flow from investment -26.4 -43.8 -60.2 -69.6<br />
Dividends -9.2 -16.3 -20.4 -22.9<br />
Change in net debt 2.4 20.9 23.0 27.6<br />
FCF equity 1.2 -11.2 -25.6 -4.3<br />
Balance sheet summary (EURm)<br />
Intangible fixed assets 4.3 4.2 4.2 4.1<br />
Tangible fixed assets 101.9 137.2 191.9 249.8<br />
Current assets 221.8 256.1 302.0 343.0<br />
Cash & others 25.5 29.7 21.0 12.8<br />
Total assets 386.5 456.5 552.7 652.1<br />
Operating liabilities 125.8 143.8 170.4 197.7<br />
Gross debt 141.3 166.4 180.7 200.2<br />
Net debt 115.8 136.7 159.7 187.3<br />
Shareholders funds 114.1 141.3 195.5 245.4<br />
Invested capital 176.7 224.1 306.7 386.4<br />
Ratio, growth <strong>and</strong> per share analysis<br />
Year to 12/2006a 12/<strong>2007</strong>e 12/<strong>2008</strong>e 12/2009e<br />
Y-o-y % change<br />
Revenue 17.8 22.5 27.5 22.9<br />
EBITDA 15.5 25.9 48.3 29.5<br />
Operating profit 18.5 28.6 49.4 29.8<br />
PBT 67.8 16.6 65.9 4.4<br />
HSBC EPS 33.4 72.9 27.0 30.1<br />
Ratios (%)<br />
Revenue/IC (x) 2.9 3.0 2.9 2.7<br />
ROIC 14.2 21.1 25.1 23.8<br />
ROE 24.5 34.5 33.3 33.1<br />
ROA 7.6 10.3 15.0 12.5<br />
EBITDA margin 10.2 10.4 12.1 12.8<br />
Operating profit margin 8.7 9.1 10.7 11.3<br />
EBITDA/net interest (x) 9.6 10.9 12.4 13.2<br />
Net debt/equity 101.4 96.8 81.3 75.2<br />
Net debt/EBITDA (x) 2.3 2.2 1.7 1.6<br />
CF from operations/net debt 13.0 23.3 25.0 36.1<br />
Per share data (EUR)<br />
EPS Rep (fully diluted) 0.54 0.85 1.46 1.43<br />
HSBC EPS (fully diluted) 0.50 0.87 1.10 1.43<br />
DPS 0.18 0.32 0.40 0.45<br />
NAV 2.24 2.77 3.84 4.82<br />
New IKEA stores <strong>2008</strong>-2010<br />
Overweight<br />
Location Opening Investment (HSBCe)<br />
IKEA Athens West (Rentis) Mar-08 EUR10m<br />
IKEA Ioannina (NW Greece) Oct-08 EUR24m<br />
IKEA Larissa (central Greece) Feb-09 EUR24m<br />
IKEA Bulgaria 1 (Sofia) May-09 EUR22m<br />
IKEA Bulgaria 2 (Burgas) Oct-09 EUR21m<br />
IKEA Heraclion (Crete) Nov-09 EUR27m<br />
IKEA Bulgaria 3 (Plovdiv) Sep-10 EUR20m<br />
Valuation data<br />
Year to 12/2006a 12/<strong>2007</strong>e 12/<strong>2008</strong>e 12/2009e<br />
EV/sales 3.0 2.4 1.9 1.6<br />
EV/EBITDA 29.0 23.4 16.0 12.6<br />
EV/IC 8.1 6.5 4.8 3.9<br />
PE* 52.1 30.2 23.7 18.2<br />
P/NAV 11.7 9.4 6.8 5.4<br />
FCF yield (%) 0.1 -0.8 -1.9 -0.3<br />
Dividend yield (%) 0.7 1.2 1.5 1.7<br />
Note: * = Based on HSBC EPS (fully diluted)<br />
Issuer information<br />
Share price (EUR) 26.10 Target price (EUR) 31.30 Potent'l tot rtn (%) 19.9<br />
Reuters (Equity) FRLr.AT Bloomberg (Equity) FOYRK GA<br />
Market cap (USDm) 1884.6 Market cap (EURm) 1329.9<br />
Free float (%) 70 Enterprise value (EURm) 1457.2<br />
Country Greece Sector Household Durables<br />
Analyst Spiros Tsangalakis Contact 30 210 6965 212<br />
Price relative<br />
29<br />
27<br />
25<br />
23<br />
21<br />
19<br />
17<br />
15<br />
13<br />
11<br />
Oct-06 Apr-07 Oct-07<br />
<strong>Fourlis</strong> Rel to ATHENS SE<br />
Source: HSBC<br />
Note: price at close of 12 Oct <strong>2007</strong><br />
29<br />
27<br />
25<br />
23<br />
21<br />
19<br />
17<br />
15<br />
13<br />
11<br />
40