European small and mid caps-Stock picks Q4 2007-Q1 2008 - Fourlis
European small and mid caps-Stock picks Q4 2007-Q1 2008 - Fourlis
European small and mid caps-Stock picks Q4 2007-Q1 2008 - Fourlis

You also want an ePaper? Increase the reach of your titles
YUMPU automatically turns print PDFs into web optimized ePapers that Google loves.
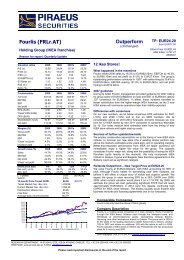
Mid cap<br />
<strong>European</strong> <strong>small</strong> <strong>and</strong> <strong>mid</strong> <strong>caps</strong><br />
17 October <strong>2007</strong><br />
abc<br />
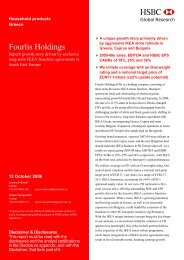
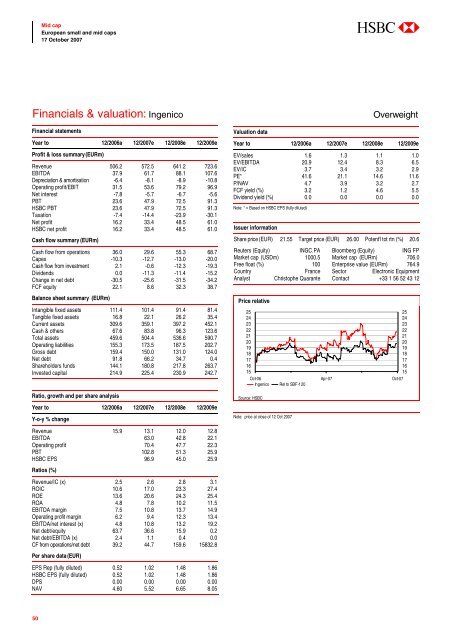
Financials & valuation: Ingenico<br />
Financial statements<br />
Year to 12/2006a 12/<strong>2007</strong>e 12/<strong>2008</strong>e 12/2009e<br />
Profit & loss summary (EURm)<br />
Revenue 506.2 572.5 641.2 723.6<br />
EBITDA 37.9 61.7 88.1 107.6<br />
Depreciation & amortisation -6.4 -8.1 -8.9 -10.8<br />
Operating profit/EBIT 31.5 53.6 79.2 96.9<br />
Net interest -7.8 -5.7 -6.7 -5.6<br />
PBT 23.6 47.9 72.5 91.3<br />
HSBC PBT 23.6 47.9 72.5 91.3<br />
Taxation -7.4 -14.4 -23.9 -30.1<br />
Net profit 16.2 33.4 48.5 61.0<br />
HSBC net profit 16.2 33.4 48.5 61.0<br />
Cash flow summary (EURm)<br />
Cash flow from operations 36.0 29.6 55.3 68.7<br />
Capex -10.3 -12.7 -13.0 -20.0<br />
Cash flow from investment 2.1 -0.6 -12.3 -19.3<br />
Dividends 0.0 -11.3 -11.4 -15.2<br />
Change in net debt -30.5 -25.6 -31.5 -34.2<br />
FCF equity 22.1 8.6 32.3 38.7<br />
Balance sheet summary (EURm)<br />
Intangible fixed assets 111.4 101.4 91.4 81.4<br />
Tangible fixed assets 16.8 22.1 26.2 35.4<br />
Current assets 309.6 359.1 397.2 452.1<br />
Cash & others 67.6 83.8 96.3 123.6<br />
Total assets 459.6 504.4 536.6 590.7<br />
Operating liabilities 155.3 173.5 187.5 202.7<br />
Gross debt 159.4 150.0 131.0 124.0<br />
Net debt 91.8 66.2 34.7 0.4<br />
Shareholders funds 144.1 180.8 217.8 263.7<br />
Invested capital 214.9 225.4 230.9 242.7<br />
Ratio, growth <strong>and</strong> per share analysis<br />
Year to 12/2006a 12/<strong>2007</strong>e 12/<strong>2008</strong>e 12/2009e<br />
Y-o-y % change<br />
Revenue 15.9 13.1 12.0 12.8<br />
EBITDA 63.0 42.8 22.1<br />
Operating profit 70.4 47.7 22.3<br />
PBT 102.8 51.3 25.9<br />
HSBC EPS 96.9 45.0 25.9<br />
Ratios (%)<br />
Revenue/IC (x) 2.5 2.6 2.8 3.1<br />
ROIC 10.6 17.0 23.3 27.4<br />
ROE 13.6 20.6 24.3 25.4<br />
ROA 4.8 7.8 10.2 11.5<br />
EBITDA margin 7.5 10.8 13.7 14.9<br />
Operating profit margin 6.2 9.4 12.3 13.4<br />
EBITDA/net interest (x) 4.8 10.8 13.2 19.2<br />
Net debt/equity 63.7 36.6 15.9 0.2<br />
Net debt/EBITDA (x) 2.4 1.1 0.4 0.0<br />
CF from operations/net debt 39.2 44.7 159.6 15832.8<br />
Per share data (EUR)<br />
EPS Rep (fully diluted) 0.52 1.02 1.48 1.86<br />
HSBC EPS (fully diluted) 0.52 1.02 1.48 1.86<br />
DPS 0.00 0.00 0.00 0.00<br />
NAV 4.60 5.52 6.65 8.05<br />
Valuation data<br />
Overweight<br />
Year to 12/2006a 12/<strong>2007</strong>e 12/<strong>2008</strong>e 12/2009e<br />
EV/sales 1.6 1.3 1.1 1.0<br />
EV/EBITDA 20.9 12.4 8.3 6.5<br />
EV/IC 3.7 3.4 3.2 2.9<br />
PE* 41.6 21.1 14.6 11.6<br />
P/NAV 4.7 3.9 3.2 2.7<br />
FCF yield (%) 3.2 1.2 4.6 5.5<br />
Dividend yield (%) 0.0 0.0 0.0 0.0<br />
Note: * = Based on HSBC EPS (fully diluted)<br />
Issuer information<br />
Share price (EUR) 21.55 Target price (EUR) 26.00 Potent'l tot rtn (%) 20.6<br />
Reuters (Equity) INGC.PA Bloomberg (Equity) ING FP<br />
Market cap (USDm) 1000.5 Market cap (EURm) 706.0<br />
Free float (%) 100 Enterprise value (EURm) 764.9<br />
Country France Sector Electronic Equipment<br />
Analyst Christophe Quarante Contact +33 1 56 52 43 12<br />
Price relative<br />
25<br />
24<br />
23<br />
22<br />
21<br />
20<br />
19<br />
18<br />
17<br />
16<br />
15<br />
Oct-06 Apr-07 Oct-07<br />
Ingenico Rel to SBF-120<br />
Source: HSBC<br />
Note: price at close of 12 Oct <strong>2007</strong><br />
25<br />
24<br />
23<br />
22<br />
21<br />
20<br />
19<br />
18<br />
17<br />
16<br />
15<br />
50