European small and mid caps-Stock picks Q4 2007-Q1 2008 - Fourlis
European small and mid caps-Stock picks Q4 2007-Q1 2008 - Fourlis
European small and mid caps-Stock picks Q4 2007-Q1 2008 - Fourlis

You also want an ePaper? Increase the reach of your titles
YUMPU automatically turns print PDFs into web optimized ePapers that Google loves.
Mid cap<br />
<strong>European</strong> <strong>small</strong> <strong>and</strong> <strong>mid</strong> <strong>caps</strong><br />
17 October <strong>2007</strong><br />
abc<br />
Financials & valuation: Deutz<br />
Financial statements<br />
Year to 12/2006a 12/<strong>2007</strong>e 12/<strong>2008</strong>e 12/2009e<br />
Profit & loss summary (EURm)<br />
Revenue 1490.0 1550.0 1749.0 1840.6<br />
EBITDA 154.1 161.7 191.2 202.4<br />
Depreciation & amortisation -65.3 -62.4 -66.9 -69.3<br />
Operating profit/EBIT 88.8 99.3 124.3 133.1<br />
Net interest -22.1 -16.0 -12.2 -11.2<br />
PBT 71.4 272.0 111.8 127.5<br />
HSBC PBT 71.4 82.0 111.8 127.5<br />
Taxation -9.9 -16.5 -22.0 -27.4<br />
Net profit 62.1 252.5 89.8 100.1<br />
HSBC net profit 60.9 68.5 89.8 100.1<br />
Cash flow summary (EURm)<br />
Cash flow from operations 104.6 66.3 123.8 157.3<br />
Capex -85.8 -100.0 -80.0 -80.0<br />
Cash flow from investment -85.2 -3.0 -103.0 -103.0<br />
Dividends 0.0 -15.9 -15.6 -22.4<br />
Change in net debt -68.3 -327.9 0.6 -26.2<br />
FCF equity 39.2 48.5 49.2 71.0<br />
Balance sheet summary (EURm)<br />
Intangible fixed assets 100.3 103.6 106.7 109.6<br />
Tangible fixed assets 377.0 254.3 287.3 315.3<br />
Current assets 605.2 898.9 969.4 1001.9<br />
Cash & others 49.4 349.4 349.4 349.4<br />
Total assets 1162.9 1397.2 1503.8 1567.2<br />
Operating liabilities 322.0 331.6 363.5 378.2<br />
Gross debt 378.7 350.8 351.4 325.3<br />
Net debt 329.3 1.4 2.0 -24.1<br />
Shareholders funds 358.5 611.0 685.2 760.1<br />
Invested capital 711.1 575.7 650.5 699.3<br />
Ratio, growth <strong>and</strong> per share analysis<br />
Year to 12/2006a 12/<strong>2007</strong>e 12/<strong>2008</strong>e 12/2009e<br />
Y-o-y % change<br />
Revenue 12.6 4.0 12.8 5.2<br />
EBITDA -12.2 4.9 18.2 5.8<br />
Operating profit -19.4 11.8 25.2 7.1<br />
PBT -17.2 281.0 -58.9 14.1<br />
HSBC EPS 220.5 12.5 31.0 11.5<br />
Ratios (%)<br />
Revenue/IC (x) 2.1 2.4 2.9 2.7<br />
ROIC 11.3 12.9 16.7 15.7<br />
ROE 20.1 14.1 13.9 13.9<br />
ROA 7.4 21.6 7.4 7.6<br />
EBITDA margin 10.3 10.4 10.9 11.0<br />
Operating profit margin 6.0 6.4 7.1 7.2<br />
EBITDA/net interest (x) 7.0 10.1 15.7 18.0<br />
Net debt/equity 91.9 0.2 0.3 -3.2<br />
Net debt/EBITDA (x) 2.1 0.0 0.0 -0.1<br />
CF from operations/net debt 31.8 4662.2 6070.5<br />
Per share data (EUR)<br />
EPS Rep (fully diluted) 0.52 2.13 0.76 0.85<br />
HSBC EPS (fully diluted) 0.51 0.58 0.76 0.85<br />
DPS 0.00 0.13 0.19 0.20<br />
NAV 3.02 5.16 5.78 6.41<br />
Valuation data<br />
Overweight<br />
Year to 12/2006a 12/<strong>2007</strong>e 12/<strong>2008</strong>e 12/2009e<br />
EV/sales 0.9 0.7 0.6 0.5<br />
EV/EBITDA 9.2 6.3 5.3 4.9<br />
EV/IC 2.0 1.8 1.6 1.4<br />
PE* 18.3 16.3 12.4 11.1<br />
P/NAV 3.1 1.8 1.6 1.5<br />
FCF yield (%) 3.6 4.7 4.8 7.0<br />
Dividend yield (%) 0.0 1.4 2.0 2.1<br />
Note: * = Based on HSBC EPS (fully diluted)<br />
Issuer information<br />
Share price (EUR) 9.42 Target price (EUR) 11.00 Potent'l tot rtn (%) 16.8<br />
Reuters (Equity) DEZG.DE Bloomberg (Equity) DEZ GR<br />
Market cap (USDm) 1565.9 Market cap (EURm) 1105.0<br />
Free float (%) 60 Enterprise value (EURm) 1022.2<br />
Country Germany Sector Machinery<br />
Analyst Juergen Siebrecht Contact +49 211 910 3350<br />
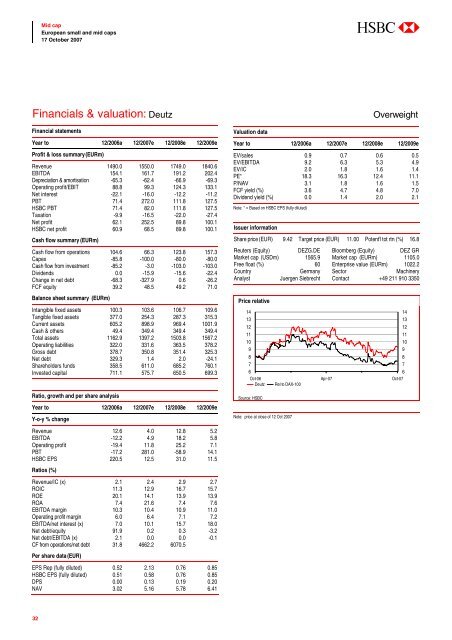
Price relative<br />
14<br />
13<br />
12<br />
11<br />
10<br />
9<br />
8<br />
7<br />
6<br />
Oct-06 Apr-07 Oct-07<br />
Deutz Rel to DAX-100<br />
Source: HSBC<br />
Note: price at close of 12 Oct <strong>2007</strong><br />
14<br />
13<br />
12<br />
11<br />
10<br />
9<br />
8<br />
7<br />
6<br />
32