European small and mid caps-Stock picks Q4 2007-Q1 2008 - Fourlis
European small and mid caps-Stock picks Q4 2007-Q1 2008 - Fourlis
European small and mid caps-Stock picks Q4 2007-Q1 2008 - Fourlis
You also want an ePaper? Increase the reach of your titles
YUMPU automatically turns print PDFs into web optimized ePapers that Google loves.
Mid cap<br />
<strong>European</strong> <strong>small</strong> <strong>and</strong> <strong>mid</strong> <strong>caps</strong><br />
17 October <strong>2007</strong><br />
abc<br />
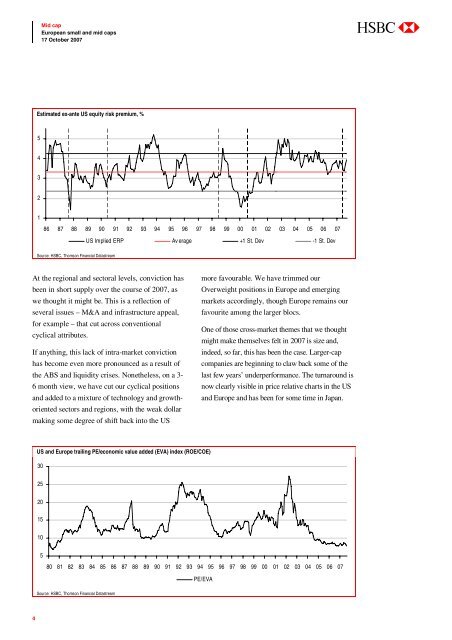
Estimated ex-ante US equity risk premium, %<br />
5<br />
4<br />
3<br />
2<br />
1<br />
86 87 88 89 90 91 92 93 94 95 96 97 98 99 00 01 02 03 04 05 06 07<br />
US Implied ERP Av erage +1 St. Dev -1 St. Dev<br />
Source: HSBC, Thomson Financial Datastream<br />
At the regional <strong>and</strong> sectoral levels, conviction has<br />
been in short supply over the course of <strong>2007</strong>, as<br />
we thought it might be. This is a reflection of<br />
several issues – M&A <strong>and</strong> infrastructure appeal,<br />
for example – that cut across conventional<br />
cyclical attributes.<br />
If anything, this lack of intra-market conviction<br />
has become even more pronounced as a result of<br />
the ABS <strong>and</strong> liquidity crises. Nonetheless, on a 3-<br />
6 month view, we have cut our cyclical positions<br />
<strong>and</strong> added to a mixture of technology <strong>and</strong> growthoriented<br />
sectors <strong>and</strong> regions, with the weak dollar<br />
making some degree of shift back into the US<br />
more favourable. We have trimmed our<br />
Overweight positions in Europe <strong>and</strong> emerging<br />
markets accordingly, though Europe remains our<br />
favourite among the larger blocs.<br />
One of those cross-market themes that we thought<br />
might make themselves felt in <strong>2007</strong> is size <strong>and</strong>,<br />
indeed, so far, this has been the case. Larger-cap<br />
companies are beginning to claw back some of the<br />
last few years’ underperformance. The turnaround is<br />
now clearly visible in price relative charts in the US<br />
<strong>and</strong> Europe <strong>and</strong> has been for some time in Japan.<br />
US <strong>and</strong> Europe trailing PE/economic value added (EVA) index (ROE/COE)<br />
30<br />
25<br />
20<br />
15<br />
10<br />
5<br />
80 81 82 83 84 85 86 87 88 89 90 91 92 93 94 95 96 97 98 99 00 01 02 03 04 05 06 07<br />
PE/EVA<br />
Source: HSBC, Thomson Financial Datastream<br />
4


