European small and mid caps-Stock picks Q4 2007-Q1 2008 - Fourlis
European small and mid caps-Stock picks Q4 2007-Q1 2008 - Fourlis
European small and mid caps-Stock picks Q4 2007-Q1 2008 - Fourlis

Create successful ePaper yourself
Turn your PDF publications into a flip-book with our unique Google optimized e-Paper software.
Mid cap<br />
<strong>European</strong> <strong>small</strong> <strong>and</strong> <strong>mid</strong> <strong>caps</strong><br />
17 October <strong>2007</strong><br />
abc<br />
Financials & valuation: Lanxess<br />
Financial statements<br />
Year to 12/2006a 12/<strong>2007</strong>e 12/<strong>2008</strong>e 12/2009e<br />
Profit & loss summary (EURm)<br />
Revenue 6944.0 6545.9 6132.4 6349.9<br />
EBITDA 675.0 713.5 767.1 807.2<br />
Depreciation & amortisation -254.0 -246.1 -240.8 -248.3<br />
Operating profit/EBIT 421.0 467.4 526.4 558.9<br />
Net interest -39.0 -18.0 -9.0 3.5<br />
PBT 287.0 191.4 407.8 481.2<br />
HSBC PBT 332.0 397.9 464.3 507.7<br />
Taxation -85.0 -57.4 -130.5 -154.0<br />
Net profit 197.0 128.8 271.8 321.5<br />
HSBC net profit 229.1 260.4 305.5 335.1<br />
Cash flow summary (EURm)<br />
Cash flow from operations 537.0 511.6 513.0 600.6<br />
Capex -267.0 -298.6 -282.2 -292.7<br />
Cash flow from investment -228.0 -298.6 -282.2 -292.7<br />
Dividends -21.2 -21.2 -19.3 -40.8<br />
Change in net debt -146.0 -127.9 -196.4 -252.1<br />
FCF equity 354.0 489.5 307.3 319.4<br />
Balance sheet summary (EURm)<br />
Intangible fixed assets 41.0 41.0 41.0 41.0<br />
Tangible fixed assets 1559.0 1611.5 1652.9 1697.4<br />
Current assets 2362.0 2097.0 2181.7 2247.0<br />
Cash & others 171.0 122.0 122.0 122.0<br />
Total assets 4205.0 3992.5 4118.7 4228.3<br />
Operating liabilities 2038.0 1909.3 1997.8 2083.0<br />
Gross debt 1202.0 1025.1 828.7 576.6<br />
Net debt 1031.0 903.1 706.7 454.6<br />
Shareholders funds 1403.0 1463.4 1694.5 1967.7<br />
Invested capital 1753.0 1718.2 1755.9 1780.3<br />
Ratio, growth <strong>and</strong> per share analysis<br />
Year to 12/2006a 12/<strong>2007</strong>e 12/<strong>2008</strong>e 12/2009e<br />
Y-o-y % change<br />
Revenue -2.9 -5.7 -6.3 3.5<br />
EBITDA 16.2 5.7 7.5 5.2<br />
Operating profit 26.8 11.0 12.6 6.2<br />
PBT -33.3 113.0 18.0<br />
HSBC EPS 102.8 15.6 17.3 9.7<br />
Ratios (%)<br />
Revenue/IC (x) 3.9 3.8 3.5 3.6<br />
ROIC 16.7 18.9 20.6 21.5<br />
ROE 17.3 18.2 19.4 18.3<br />
ROA 5.1 3.6 7.0 7.8<br />
EBITDA margin 9.7 10.9 12.5 12.7<br />
Operating profit margin 6.1 7.1 8.6 8.8<br />
EBITDA/net interest (x) 17.3 39.6 85.2<br />
Net debt/equity 72.2 60.5 40.8 22.6<br />
Net debt/EBITDA (x) 1.5 1.3 0.9 0.6<br />
CF from operations/net debt 52.1 56.6 72.6 132.1<br />
Per share data (EUR)<br />
EPS Rep (fully diluted) 2.33 1.55 3.27 3.86<br />
HSBC EPS (fully diluted) 2.71 3.13 3.67 4.03<br />
DPS 0.25 0.23 0.49 0.58<br />
NAV 16.58 17.59 20.37 23.65<br />
Valuation data<br />
Overweight<br />
Year to 12/2006a 12/<strong>2007</strong>e 12/<strong>2008</strong>e 12/2009e<br />
EV/sales 0.6 0.6 0.6 0.5<br />
EV/EBITDA 5.7 5.2 4.6 4.1<br />
EV/IC 2.2 2.2 2.0 1.8<br />
PE* 13.1 11.4 9.7 8.8<br />
P/NAV 2.1 2.0 1.7 1.5<br />
FCF yield (%) 12.5 17.3 10.8 11.3<br />
Dividend yield (%) 0.7 0.7 1.4 1.6<br />
Note: * = Based on HSBC EPS (fully diluted)<br />
Issuer information<br />
Share price (EUR) 35.53 Target price (EUR) 47.00 Potent'l tot rtn (%) 32.3<br />
Reuters (Equity) LXSG.DE Bloomberg (Equity) LXS GR<br />
Market cap (USDm) 4189.4 Market cap (EURm) 2956.2<br />
Free float (%) 100 Enterprise value (EURm) 3730.6<br />
Country Germany Sector Chemicals<br />
Analyst Sebastian Satz Contact +49 211 910 2373<br />
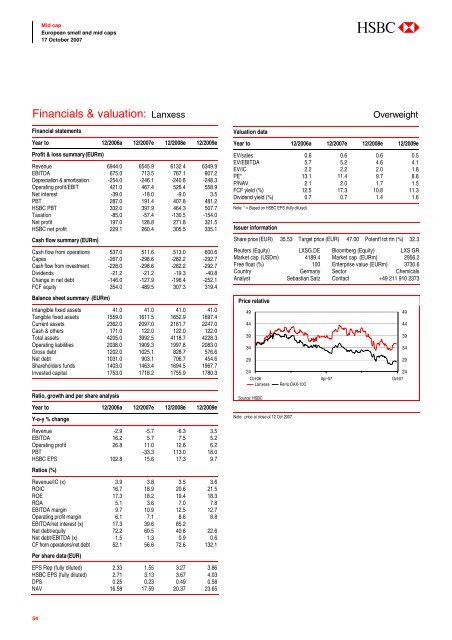
Price relative<br />
49<br />
44<br />
39<br />
34<br />
29<br />
24<br />
24<br />
Oct-06 Apr-07 Oct-07<br />
Lanxess Rel to DAX-100<br />
Source: HSBC<br />
Note: price at close of 12 Oct <strong>2007</strong><br />
49<br />
44<br />
39<br />
34<br />
29<br />
54