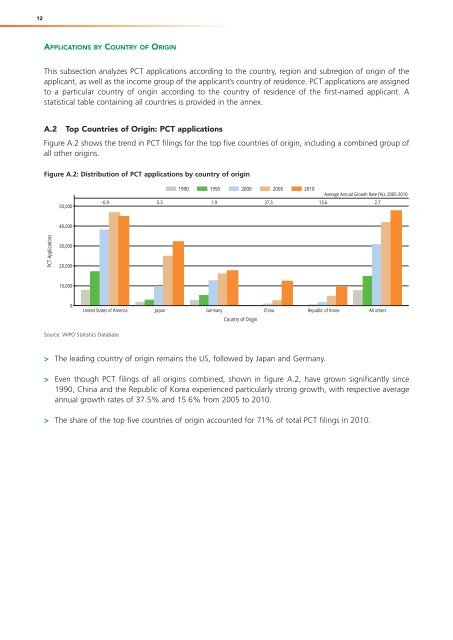
12 APPLICATIONS BY COUNTRY OF ORIGIN This subsection analyzes <strong>PCT</strong> applications according to the country, region and subregion of origin of the applicant, as well as the income group of the applicant’s country of residence. <strong>PCT</strong> applications are assigned to a particular country of origin according to the country of residence of the first-named applicant. A statistical table containing all countries is provided in the annex. A.2 Top Countries of Origin: <strong>PCT</strong> applications Figure A.2 shows the trend in <strong>PCT</strong> filings for the top five countries of origin, including a combined group of all other origins. Figure A.2: Distribution of <strong>PCT</strong> applications by country of origin 50,000 1990 1995 2000 2005 2010 Average Annual Growth Rate (%): 2005-2010 -0.9 5.3 1.9 37.5 15.6 2.7 40,000 <strong>PCT</strong> Applications 30,000 20,000 10,000 0 United States of America Japan Germany China Republic of Korea All others Country of Origin Source: <strong>WIPO</strong> Statistics Database > The leading country of origin remains the US, followed by Japan and Germany. > Even though <strong>PCT</strong> filings of all origins combined, shown in figure A.2, have grown significantly since 1990, China and the Republic of Korea experienced particularly strong growth, with respective average annual growth rates of 37.5% and 15.6% from 2005 to 2010. > The share of the top five countries of origin accounted for 71% of total <strong>PCT</strong> filings in 2010.
13 Table A.2 presents the number of <strong>PCT</strong> applications filed by the top 20 countries of origin over the last five years. Table A.2: <strong>PCT</strong> applications by country of origin Change Country of Origin Year of Filing 2010 compared Share to 2009 2006 2007 2008 2009 2010 (%) (%) United States of America 51,280 54,043 51,638 45,617 44,890 27.3 -1.6 Japan 27,025 27,743 28,760 29,802 32,180 19.6 8.0 Germany 16,736 17,821 18,855 16,797 17,558 10.7 4.5 China 3,942 5,455 6,120 7,900 12,295 7.5 55.6 Republic of Korea 5,945 7,064 7,899 8,035 9,668 5.9 20.3 France 6,256 6,560 7,072 7,237 7,288 4.4 0.7 United Kingdom 5,097 5,542 5,466 5,044 4,908 3.0 -2.7 Netherlands 4,553 4,433 4,363 4,462 4,078 2.5 -8.6 Switzerland 3,621 3,833 3,799 3,671 3,728 2.3 1.6 Sweden 3,336 3,655 4,137 3,567 3,314 2.0 -7.1 Canada 2,575 2,879 2,976 2,527 2,721 1.7 7.7 Italy 2,698 2,946 2,883 2,652 2,658 1.6 0.2 Finland 1,846 2,009 2,214 2,123 2,145 1.3 1.0 Australia 1,996 2,052 1,938 1,740 1,776 1.1 2.1 Spain 1,204 1,297 1,390 1,564 1,752 1.1 12.0 Israel 1,593 1,737 1,899 1,555 1,488 0.9 -4.3 India 833 902 1,072 961 1,313 0.8 36.6 Denmark 1,158 1,151 1,357 1,344 1,173 0.7 -12.7 Austria 911 1,009 953 1,024 1,140 0.7 11.3 Belgium 1,030 1,124 1,135 1,008 1,057 0.6 4.9 All others 6,006 6,672 7,308 6,768 7,170 4.4 5.9 Total 149,641 159,927 163,234 155,398 164,300 100.0 5.7 Source: <strong>WIPO</strong> Statistics Database > For the third consecutive year, applicants from the US reduced their overall number of <strong>PCT</strong> filings. Following a sharp drop of 11.7% in 2009, their filings only slightly decreased by 1.6% in 2010. > The number of <strong>PCT</strong> applications filed by applicants from China (+55.6%), India (+36.6%) and the Republic of Korea (+20.3%) sharply increased in 2010. The number of <strong>PCT</strong> applications filed by applicants from Spain, Austria and Japan also showed positive annual growth with 12%, 11.3% and 8% increases, respectively, compared to 2009. > Only a few of the countries shown in table A.2 filed fewer <strong>PCT</strong> applications in 2010 than in 2009. Among the 6 countries in which filings declined, Denmark (-12.7%), the Netherlands (-8.6%) and Sweden (-7.1%) had the sharpest decreases. > With a total of 54,000 <strong>PCT</strong> applications filed, European Patent Convention (EPC) member states, as a block, saw an increase of 0.8% in these applications from 2009 to 2010.