PDF, PCT Yearly Review - WIPO
PDF, PCT Yearly Review - WIPO
PDF, PCT Yearly Review - WIPO

Create successful ePaper yourself
Turn your PDF publications into a flip-book with our unique Google optimized e-Paper software.
16<br />
A.5 <strong>PCT</strong> Applications by Income Group<br />
Table A.5 presents <strong>PCT</strong> applications filed from 2006 to 2010 according to the income group of the<br />
applicant’s country of origin.<br />
Table A.5: <strong>PCT</strong> applications filed by income group<br />
Income Groups<br />
Year of Filing<br />
2006 2007 2008 2009 2010<br />
High Income 142,153 150,540 152,839 143,457 147,345<br />
Middle Income 7,243 9,095 10,209 11,890 16,910<br />
Low Income 13 8 18 12 22<br />
Source: <strong>WIPO</strong> Statistics Database<br />
> The high income group filed an increasing number of <strong>PCT</strong> applications from year to year until the onset<br />
of the economic crisis in 2008. In 2010, the number of <strong>PCT</strong> applications by this group increased compared<br />
to 2009 but did not reach its pre-crisis level.<br />
> The middle income group, dominated by China, was not as affected by the crisis as was the high income<br />
group. Its filing trend remained positive during the period shown in table A.5, with a substantial increase<br />
in 2010.<br />
> Use of the <strong>PCT</strong> system by low income countries is limited. Over the last five years, the main countries of<br />
origin in terms of <strong>PCT</strong> filings were the Democratic People's Republic of Korea (17 <strong>PCT</strong> applications),<br />
Kenya (17) and the Lao People's Democratic Republic (7).<br />
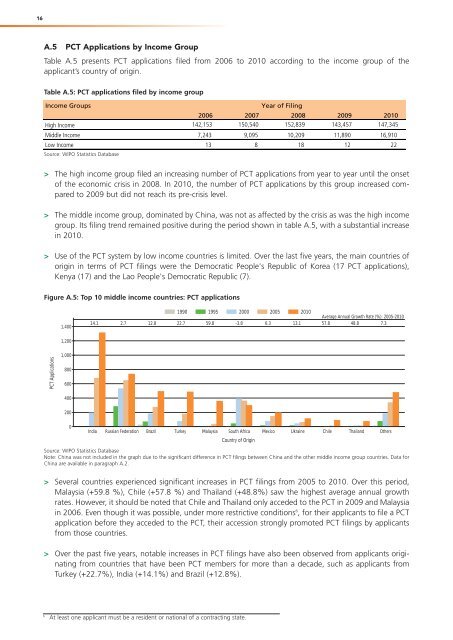
Figure A.5: Top 10 middle income countries: <strong>PCT</strong> applications<br />
1,400<br />
1990 1995 2000 2005 2010<br />
Average Annual Growth Rate (%): 2005-2010<br />
14.1 2.7 12.8 22.7 59.8 -3.8 6.3 13.1 57.8 48.8 7.3<br />
1,200<br />
<strong>PCT</strong> Applications<br />
1,000<br />
800<br />
600<br />
400<br />
200<br />
0<br />
India Russian Federation Brazil Turkey Malaysia South Africa Mexico Ukraine Chile Thailand Others<br />
Country of Origin<br />
Source: <strong>WIPO</strong> Statistics Database<br />
Note: China was not included in the graph due to the significant difference in <strong>PCT</strong> filings between China and the other middle income group countries. Data for<br />
China are available in paragraph A.2.<br />
> Several countries experienced significant increases in <strong>PCT</strong> filings from 2005 to 2010. Over this period,<br />
Malaysia (+59.8 %), Chile (+57.8 %) and Thailand (+48.8%) saw the highest average annual growth<br />
rates. However, it should be noted that Chile and Thailand only acceded to the <strong>PCT</strong> in 2009 and Malaysia<br />
in 2006. Even though it was possible, under more restrictive conditions 6 , for their applicants to file a <strong>PCT</strong><br />
application before they acceded to the <strong>PCT</strong>, their accession strongly promoted <strong>PCT</strong> filings by applicants<br />
from those countries.<br />
> Over the past five years, notable increases in <strong>PCT</strong> filings have also been observed from applicants originating<br />
from countries that have been <strong>PCT</strong> members for more than a decade, such as applicants from<br />
Turkey (+22.7%), India (+14.1%) and Brazil (+12.8%).<br />
6<br />
At least one applicant must be a resident or national of a contracting state.