Lab 4: Network Packet Capture and Analysis using Wireshark 4.1 ...
Lab 4: Network Packet Capture and Analysis using Wireshark 4.1 ...
Lab 4: Network Packet Capture and Analysis using Wireshark 4.1 ...

You also want an ePaper? Increase the reach of your titles
YUMPU automatically turns print PDFs into web optimized ePapers that Google loves.
<strong>Lab</strong> 4: <strong>Network</strong> <strong>Packet</strong> <strong>Capture</strong> <strong>and</strong> <strong>Analysis</strong><br />
<strong>using</strong> <strong>Wireshark</strong><br />
<strong>4.1</strong> Details<br />
Aim:<br />
To provide a foundation in network packet capture <strong>and</strong> analysis.<br />
You may be faced with network traffic analysis, from traffic captured yourself or<br />
monitoring data given to you by on-site IT staff. A popular tool for capture <strong>and</strong> analysis of<br />
network traffic is <strong>Wireshark</strong> (formerly known as Ethereal).<br />
4.2 <strong>Wireshark</strong><br />
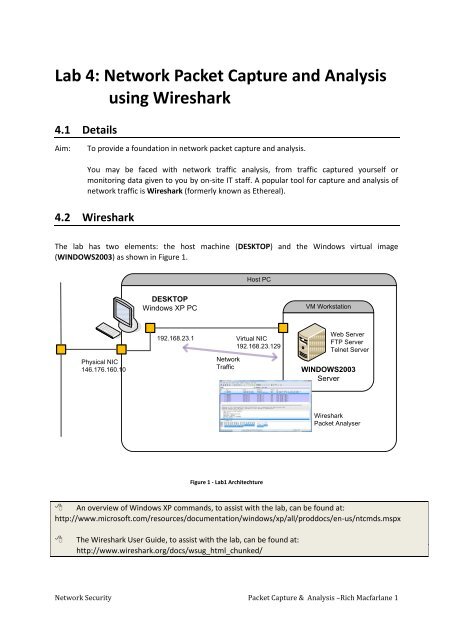
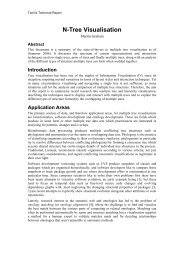
The lab has two elements: the host machine (DESKTOP) <strong>and</strong> the Windows virtual image<br />
(WINDOWS2003) as shown in Figure 1.<br />
Host PC<br />
DESKTOP<br />
Windows XP PC<br />
VM Workstation<br />
Physical NIC<br />
146.176.160.10<br />
192.168.23.1<br />
<strong>Network</strong><br />
Traffic<br />
Virtual NIC<br />
192.168.23.129<br />
Web Server<br />
FTP Server<br />
Telnet Server<br />
WINDOWS2003<br />
Server<br />
<strong>Wireshark</strong><br />
<strong>Packet</strong> Analyser<br />
Figure 1 - <strong>Lab</strong>1 Architechture<br />
An overview of Windows XP comm<strong>and</strong>s, to assist with the lab, can be found at:<br />
http://www.microsoft.com/resources/documentation/windows/xp/all/proddocs/en-us/ntcmds.mspx<br />
<br />
The <strong>Wireshark</strong> User Guide, to assist with the lab, can be found at:<br />
http://www.wireshark.org/docs/wsug_html_chunked/<br />
<strong>Network</strong> Security <strong>Packet</strong> <strong>Capture</strong> & <strong>Analysis</strong> –Rich Macfarlane 1
4.2.1 Run the Windows Server 2003 virtual image (run the .vmx file, <strong>and</strong> power the virtual machine)<br />
Log in to the server <strong>using</strong>: Username: Administrator, Password: napier).<br />
Within the virtual image, open a comm<strong>and</strong> line window <strong>and</strong> determine the virtual servers IP<br />
address <strong>using</strong> the Windows comm<strong>and</strong> ipconfig. Similarly, from DESKTOP open a comm<strong>and</strong> line<br />
window <strong>and</strong> determine the IP Address of the host PC <strong>using</strong> the Windows ipconfig comm<strong>and</strong>.<br />
<br />
Complete the IP Addressing diagram in Figure 2, by filling in the IP addresses of the host PC,<br />
the virtual server <strong>and</strong> the network address which will be used to connect to the virtual image.<br />
Host PC<br />
DESKTOP<br />
Windows XP PC<br />
VM Workstation<br />
192.168.<br />
Virtual NIC<br />
Physical NIC<br />
146.176.<br />
192.168.<br />
WINDOWS2003<br />
Server<br />
Figure 2 - <strong>Lab</strong>1 IP Addressing<br />
L1.2 To check connectivity, from DESKTOP, ping WINDOWS2003, <strong>and</strong> vice-versa.<br />
Were the pings successful YES/NO<br />
4.2.3 From WINDOW2003, run the <strong>Wireshark</strong> application. When <strong>Wireshark</strong> is first run, a default, or<br />
blank window is shown. To list the available network interfaces, select the <strong>Capture</strong>-<br />
>Interfaces menu option as shown in Figure 3 .<br />
Figure 3 - <strong>Wireshark</strong> Interfaces<br />
<strong>Network</strong> Security <strong>Packet</strong> <strong>Capture</strong> & <strong>Analysis</strong> –Rich Macfarlane 2
<strong>Wireshark</strong> should display a popup window such as the one shown in Figure 4. To capture<br />
network traffic click the Start button for the network interface you want to capture traffic on.<br />
Note: The <strong>Packet</strong>s column, to the left of the start button shows the total number of incoming<br />
packets for each interface.<br />
Figure 4 - <strong>Wireshark</strong> Interfaces Window<br />
4.2.4 Generate some network traffic with a Web Browser from within WINDOWS2003. Your<br />
<strong>Wireshark</strong> window should show the traffic, <strong>and</strong> now look something like Figure 5. Note: The<br />
web browser produced traffic to <strong>and</strong> from port 80, which <strong>Wireshark</strong> interprets as HTTP in the<br />
Protocol column.<br />
<strong>Packet</strong><br />
List Panel<br />
<strong>Packet</strong><br />
Details<br />
Panel<br />
<strong>Packet</strong><br />
Bytes<br />
Panel<br />
Figure 5 - <strong>Wireshark</strong> Capturing Traffic<br />
To stop the capture, select the <strong>Capture</strong>->Stop menu option, Ctrl+E, or the Stop toolbar<br />
button. What you have created is a <strong>Packet</strong> <strong>Capture</strong> or ‘pcap’, which you can now view <strong>and</strong><br />
analyse <strong>using</strong> the <strong>Wireshark</strong> interface.<br />
The capture is split into 3 parts:<br />
1. <strong>Packet</strong> List Panel – this is a list of packets in the current capture. It colours the packets<br />
based on the protocol type. When a packet is selected, the details are shown in the two<br />
panels below.<br />
<strong>Network</strong> Security <strong>Packet</strong> <strong>Capture</strong> & <strong>Analysis</strong> –Rich Macfarlane 3
2. <strong>Packet</strong> Details Panel – this shows the details of the selected packet. It shows the<br />
different protocols making up the layers of data for this packet. Layers include Frame,<br />
Ethernet, IP, TCP/UDP/ICMP, <strong>and</strong> application protocols such as HTTP.<br />
3. <strong>Packet</strong> Bytes Panel – shows the packet bytes in Hex <strong>and</strong> ASCII encodings.<br />
Search through your capture, <strong>and</strong> find an HTTP packet containing a GET comm<strong>and</strong>. Click on the<br />
packet in the <strong>Packet</strong> List Panel. Then exp<strong>and</strong> the HTTP layer in the <strong>Packet</strong> Details Panel, from the<br />
packet.<br />
From the <strong>Packet</strong> Details Panel, within the GET comm<strong>and</strong>, what is the value of the Host<br />
parameter<br />
Can you see the Hex <strong>and</strong> ASCII showing the raw bytes in the <strong>Packet</strong> Bytes Panel<br />
4.2.5 A <strong>Packet</strong> <strong>Capture</strong> or ‘pcap’ can be saved to disc, for later analysis. To save a capture, select<br />
File->Save As, <strong>and</strong> use the dialog box. This creates a ‘.pcap’ file. This basic ‘Save As’ saves all<br />
the captured packets to the file.<br />
Note: A .pcap file is a common format which many tools can read <strong>and</strong> write. For example a<br />
tcpdump or windump output file is in this format, <strong>and</strong> can be read into <strong>Wireshark</strong> for analysis.<br />
Other useful network forensic tools, which can operate on .pcap files, include <strong>Network</strong>Miner<br />
– another capture <strong>and</strong> analysis tool, tcpstat - for generating capture statistics, <strong>and</strong> Snort – for<br />
generating intrusion alerts from capture files.<br />
<strong>Network</strong> Security <strong>Packet</strong> <strong>Capture</strong> & <strong>Analysis</strong> –Rich Macfarlane 4
<strong>Wireshark</strong> <strong>Analysis</strong> - Display Filters<br />
4.2.6 Right click on the Source Port field in the <strong>Packet</strong> Details Panel. Select Apply as Filter-<br />
>Selected<br />
<strong>Wireshark</strong> automatically generates a Display Filter, <strong>and</strong> applies it to the capture. The filter is<br />
shown in the Filter Bar, below the button toolbar. Only packets captured with a Source Port of<br />
the value selected should be displayed. The window should be similar to that shown in Figure<br />
6. This same process can be performed on most fields within <strong>Wireshark</strong>, <strong>and</strong> can be used to<br />
include or exclude traffic.<br />
Display<br />
Filter Bar<br />
Figure 6 - Filter Bar<br />
<strong>Network</strong> Security <strong>Packet</strong> <strong>Capture</strong> & <strong>Analysis</strong> –Rich Macfarlane 5
<strong>Wireshark</strong> <strong>Analysis</strong> - TCP Conversations<br />
4.2.7 Start a capture, <strong>and</strong> generate some Web traffic from the WINDOWS2003 virtual server, by<br />
going to www.schneier.com, <strong>and</strong> then stop the capture. Scroll back to the top of the capture<br />
trace. Find the first SYN packet, sent to the Web Server. This signifies the start of a TCP 3-<br />
way h<strong>and</strong>shake.<br />
If your having trouble finding the first SYN packet, select the Edit->Find <strong>Packet</strong> menu option.<br />
Select the Display Filter radio button <strong>and</strong> enter a filter of tcp.flags. (at this point you should<br />
get a list of the flags to choose from). Choose the correct flag, tcp.flags.syn <strong>and</strong> add == 1.<br />
Hit the Find button, <strong>and</strong> the first SYN packet in the trace should be highlighted.<br />
Note: The Find <strong>Packet</strong> function can also be used to search for a Hex signature – such as an<br />
attack signature, or to search for a string – such as a protocol comm<strong>and</strong> - in a <strong>Packet</strong> <strong>Capture</strong><br />
(pcap).<br />
<br />
Can you identify the rest of the TCP 3-way h<strong>and</strong>shake easily (if not read on)<br />
YES/NO<br />
4.2.8 A quick way to create a <strong>Wireshark</strong> Display Filter to isolate a TCP stream is to right click on a<br />
packet in the <strong>Packet</strong> List Panel <strong>and</strong> select Follow TCP Stream. This creates an automatic<br />
Display Filter which displays packets from that TCP session only. It also pops up a session<br />
display window, containing an ASCII representation of the reassembled TCP session (client<br />
packets in red, server packets in blue). The window should look something like Figure 7Error!<br />
Reference source not found..<br />
<strong>Network</strong> Security <strong>Packet</strong> <strong>Capture</strong> & <strong>Analysis</strong> –Rich Macfarlane 6
Figure 7 - Follow TCP Stream<br />
This is very useful for viewing human readable protocol payloads of conversations, such as<br />
with the HTTP, SMTP, <strong>and</strong> FTP protocols. For example you can reconstruct web pages seen<br />
by a user, or view unencrypted email/IM conversations.<br />
If you close the popup window. <strong>Wireshark</strong> now only shows the packets from the selected<br />
TCP Stream. You should be able to identify the 3-way h<strong>and</strong>shake as the first three packets.<br />
<br />
<br />
From your <strong>Wireshark</strong> <strong>Capture</strong>, fill in the diagram below with the IP Addresses <strong>and</strong> Port<br />
Numbers for the Client <strong>and</strong> the Server<br />
For each packet in the TCP 3-way h<strong>and</strong>shake, fill in the Sequence <strong>and</strong> Acknowledgement<br />
numbers, on the diagram below.<br />
Client<br />
Flags: SYN, Seq: ______<br />
Server<br />
IP Address:<br />
_____________<br />
Port Number:<br />
_____________<br />
Flags: SYN, ACK Seq: ______, Ack: ______<br />
Flags: ACK, Seq: ______, Ack: ______<br />
IP Address:<br />
_____________<br />
Port Number:<br />
_____________<br />
<strong>Network</strong> Security <strong>Packet</strong> <strong>Capture</strong> & <strong>Analysis</strong> –Rich Macfarlane 7
4.2.9 Often captures should be saved to disc, for later analysis. To save a capture, select File-<br />
>Save As, <strong>and</strong> use the dialog box as normal. This creates a pcap file, which many tools read<br />
<strong>and</strong> write. For example a tcpdump output file is in this format <strong>and</strong> can be read into<br />
<strong>Wireshark</strong> for analysis. This saves all the captured packets to the file.<br />
<br />
<br />
Did you successfully save your capture to disc<br />
Copy the Display Filter into the clipboard, <strong>and</strong> close <strong>and</strong> start <strong>Wireshark</strong> again, then reload<br />
the file. Was the whole capture saved or just the displayed packets<br />
Paste the display filter back into the Filter Bar, <strong>and</strong> Apply it.<br />
To save only the displayed packets, select File->Save As again, but this time select the<br />
Displayed radio button rather than the default <strong>Capture</strong>d. This creates a pcap file, with only the<br />
packets filtered by the current display filter. This can be useful when analysing large captures,<br />
as interesting packets can be saved<br />
<br />
Close <strong>and</strong> start <strong>Wireshark</strong> again, then reload the file. Was the whole capture saved or just the<br />
displayed packets<br />
4.2.10 Start another capture, <strong>and</strong> generate some Web traffic from the DESKTOP host, by going to<br />
www.schneier.com again, <strong>and</strong> then stop the capture. Scroll back to the top of the capture<br />
trace.<br />
Note: Some useful display filters can be found at: http://wiki.wireshark.org/DisplayFilters<br />
<br />
Create a display filter to show only web traffic involving the the DESKTOP host. What is the<br />
display filter<br />
<strong>Network</strong> Security <strong>Packet</strong> <strong>Capture</strong> & <strong>Analysis</strong> –Rich Macfarlane 8
<strong>Wireshark</strong> <strong>Analysis</strong> - Statistics<br />
4.2.10 <strong>Wireshark</strong> provides a Statistics menu, which provides tools to help narrow the focus of a<br />
network forensic investigation, including overall statistics, conversations, <strong>and</strong> information on<br />
systems involved in the conversations.<br />
Start the capture, <strong>and</strong> generate some Web traffic by going to www.schneier.com, then stop<br />
the capture, <strong>and</strong> select the Statistics->Protocol Hierarchy menu option. A window similar to<br />
that shown in Figure 8 should be shown, displaying statictics about the pcap. Note that all<br />
the packets are L2 Ethernet (Local Area <strong>Network</strong>) packets, but at the network layer most of<br />
the packets are TCP, but some are UDP<br />
Figure 8 - Protocol Statistics<br />
<br />
What percentage of packets in your capture are TCP, <strong>and</strong> give an example of the higher level<br />
protocol which uses TCP<br />
<br />
What percentage of packets in your capture are UDP, <strong>and</strong> give an example of the higher level<br />
protocol which uses UDP (use Figure 9)<br />
<strong>Network</strong> Security <strong>Packet</strong> <strong>Capture</strong> & <strong>Analysis</strong> –Rich Macfarlane 9
OSI Model<br />
TCP/IP Model<br />
Application<br />
Presentation<br />
Session<br />
Transport<br />
<strong>Network</strong><br />
Data Link<br />
Physical<br />
HTTP, FTP , SMTP<br />
TCP, UDP<br />
IP, ICMP<br />
Ethernet, ATM<br />
Application<br />
Transport<br />
Internet<br />
<strong>Network</strong><br />
Figure 9 - <strong>Network</strong> Model with Protocols<br />
4.2.11 Select the Statistics->Flow Graph menu option. Choose General Flow <strong>and</strong> <strong>Network</strong> Source<br />
options, <strong>and</strong> click the OK button. A window similar to that shown in Figure 10 should be<br />
displayed, visualising the flow of traffic. Other useful options in the Statistics menu include<br />
the Statistics->IP Addresses option which categorises all IP Addresses traffic, in the current<br />
pcap capture.<br />
Figure 10 - Traffic Flow Graph<br />
<strong>Network</strong> Security <strong>Packet</strong> <strong>Capture</strong> & <strong>Analysis</strong> –Rich Macfarlane 10


![Unit 5. Switches and VLANs [PDF]](https://img.yumpu.com/34422504/1/184x260/unit-5-switches-and-vlans-pdf.jpg?quality=85)