Lab 4: Network Packet Capture and Analysis using Wireshark 4.1 ...
Lab 4: Network Packet Capture and Analysis using Wireshark 4.1 ...
Lab 4: Network Packet Capture and Analysis using Wireshark 4.1 ...

Create successful ePaper yourself
Turn your PDF publications into a flip-book with our unique Google optimized e-Paper software.
<strong>Lab</strong> 4: <strong>Network</strong> <strong>Packet</strong> <strong>Capture</strong> <strong>and</strong> <strong>Analysis</strong><br />
<strong>using</strong> <strong>Wireshark</strong><br />
<strong>4.1</strong> Details<br />
Aim:<br />
To provide a foundation in network packet capture <strong>and</strong> analysis.<br />
You may be faced with network traffic analysis, from traffic captured yourself or<br />
monitoring data given to you by on-site IT staff. A popular tool for capture <strong>and</strong> analysis of<br />
network traffic is <strong>Wireshark</strong> (formerly known as Ethereal).<br />
4.2 <strong>Wireshark</strong><br />
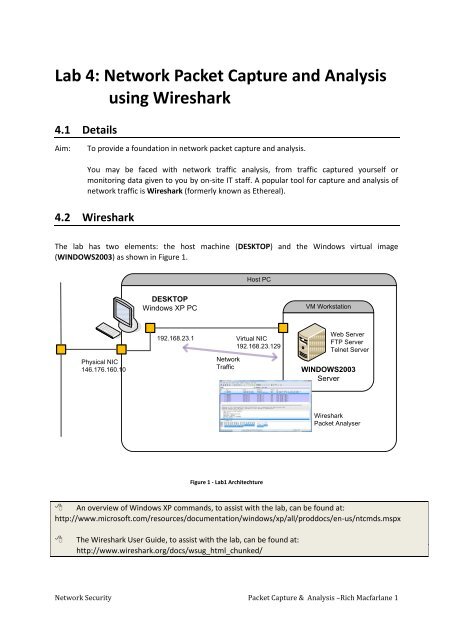
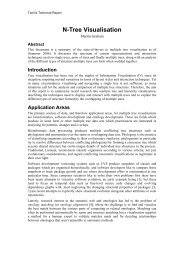
The lab has two elements: the host machine (DESKTOP) <strong>and</strong> the Windows virtual image<br />
(WINDOWS2003) as shown in Figure 1.<br />
Host PC<br />
DESKTOP<br />
Windows XP PC<br />
VM Workstation<br />
Physical NIC<br />
146.176.160.10<br />
192.168.23.1<br />
<strong>Network</strong><br />
Traffic<br />
Virtual NIC<br />
192.168.23.129<br />
Web Server<br />
FTP Server<br />
Telnet Server<br />
WINDOWS2003<br />
Server<br />
<strong>Wireshark</strong><br />
<strong>Packet</strong> Analyser<br />
Figure 1 - <strong>Lab</strong>1 Architechture<br />
An overview of Windows XP comm<strong>and</strong>s, to assist with the lab, can be found at:<br />
http://www.microsoft.com/resources/documentation/windows/xp/all/proddocs/en-us/ntcmds.mspx<br />
<br />
The <strong>Wireshark</strong> User Guide, to assist with the lab, can be found at:<br />
http://www.wireshark.org/docs/wsug_html_chunked/<br />
<strong>Network</strong> Security <strong>Packet</strong> <strong>Capture</strong> & <strong>Analysis</strong> –Rich Macfarlane 1
4.2.1 Run the Windows Server 2003 virtual image (run the .vmx file, <strong>and</strong> power the virtual machine)<br />
Log in to the server <strong>using</strong>: Username: Administrator, Password: napier).<br />
Within the virtual image, open a comm<strong>and</strong> line window <strong>and</strong> determine the virtual servers IP<br />
address <strong>using</strong> the Windows comm<strong>and</strong> ipconfig. Similarly, from DESKTOP open a comm<strong>and</strong> line<br />
window <strong>and</strong> determine the IP Address of the host PC <strong>using</strong> the Windows ipconfig comm<strong>and</strong>.<br />
<br />
Complete the IP Addressing diagram in Figure 2, by filling in the IP addresses of the host PC,<br />
the virtual server <strong>and</strong> the network address which will be used to connect to the virtual image.<br />
Host PC<br />
DESKTOP<br />
Windows XP PC<br />
VM Workstation<br />
192.168.<br />
Virtual NIC<br />
Physical NIC<br />
146.176.<br />
192.168.<br />
WINDOWS2003<br />
Server<br />
Figure 2 - <strong>Lab</strong>1 IP Addressing<br />
L1.2 To check connectivity, from DESKTOP, ping WINDOWS2003, <strong>and</strong> vice-versa.<br />
Were the pings successful YES/NO<br />
4.2.3 From WINDOW2003, run the <strong>Wireshark</strong> application. When <strong>Wireshark</strong> is first run, a default, or<br />
blank window is shown. To list the available network interfaces, select the <strong>Capture</strong>-<br />
>Interfaces menu option as shown in Figure 3 .<br />
Figure 3 - <strong>Wireshark</strong> Interfaces<br />
<strong>Network</strong> Security <strong>Packet</strong> <strong>Capture</strong> & <strong>Analysis</strong> –Rich Macfarlane 2
<strong>Wireshark</strong> should display a popup window such as the one shown in Figure 4. To capture<br />
network traffic click the Start button for the network interface you want to capture traffic on.<br />
Note: The <strong>Packet</strong>s column, to the left of the start button shows the total number of incoming<br />
packets for each interface.<br />
Figure 4 - <strong>Wireshark</strong> Interfaces Window<br />
4.2.4 Generate some network traffic with a Web Browser from within WINDOWS2003. Your<br />
<strong>Wireshark</strong> window should show the traffic, <strong>and</strong> now look something like Figure 5. Note: The<br />
web browser produced traffic to <strong>and</strong> from port 80, which <strong>Wireshark</strong> interprets as HTTP in the<br />
Protocol column.<br />
<strong>Packet</strong><br />
List Panel<br />
<strong>Packet</strong><br />
Details<br />
Panel<br />
<strong>Packet</strong><br />
Bytes<br />
Panel<br />
Figure 5 - <strong>Wireshark</strong> Capturing Traffic<br />
To stop the capture, select the <strong>Capture</strong>->Stop menu option, Ctrl+E, or the Stop toolbar<br />
button. What you have created is a <strong>Packet</strong> <strong>Capture</strong> or ‘pcap’, which you can now view <strong>and</strong><br />
analyse <strong>using</strong> the <strong>Wireshark</strong> interface.<br />
The capture is split into 3 parts:<br />
1. <strong>Packet</strong> List Panel – this is a list of packets in the current capture. It colours the packets<br />
based on the protocol type. When a packet is selected, the details are shown in the two<br />
panels below.<br />
<strong>Network</strong> Security <strong>Packet</strong> <strong>Capture</strong> & <strong>Analysis</strong> –Rich Macfarlane 3
2. <strong>Packet</strong> Details Panel – this shows the details of the selected packet. It shows the<br />
different protocols making up the layers of data for this packet. Layers include Frame,<br />
Ethernet, IP, TCP/UDP/ICMP, <strong>and</strong> application protocols such as HTTP.<br />
3. <strong>Packet</strong> Bytes Panel – shows the packet bytes in Hex <strong>and</strong> ASCII encodings.<br />
Search through your capture, <strong>and</strong> find an HTTP packet containing a GET comm<strong>and</strong>. Click on the<br />
packet in the <strong>Packet</strong> List Panel. Then exp<strong>and</strong> the HTTP layer in the <strong>Packet</strong> Details Panel, from the<br />
packet.<br />
From the <strong>Packet</strong> Details Panel, within the GET comm<strong>and</strong>, what is the value of the Host<br />
parameter<br />
Can you see the Hex <strong>and</strong> ASCII showing the raw bytes in the <strong>Packet</strong> Bytes Panel<br />
4.2.5 A <strong>Packet</strong> <strong>Capture</strong> or ‘pcap’ can be saved to disc, for later analysis. To save a capture, select<br />
File->Save As, <strong>and</strong> use the dialog box. This creates a ‘.pcap’ file. This basic ‘Save As’ saves all<br />
the captured packets to the file.<br />
Note: A .pcap file is a common format which many tools can read <strong>and</strong> write. For example a<br />
tcpdump or windump output file is in this format, <strong>and</strong> can be read into <strong>Wireshark</strong> for analysis.<br />
Other useful network forensic tools, which can operate on .pcap files, include <strong>Network</strong>Miner<br />
– another capture <strong>and</strong> analysis tool, tcpstat - for generating capture statistics, <strong>and</strong> Snort – for<br />
generating intrusion alerts from capture files.<br />
<strong>Network</strong> Security <strong>Packet</strong> <strong>Capture</strong> & <strong>Analysis</strong> –Rich Macfarlane 4
<strong>Wireshark</strong> <strong>Analysis</strong> - Display Filters<br />
4.2.6 Right click on the Source Port field in the <strong>Packet</strong> Details Panel. Select Apply as Filter-<br />
>Selected<br />
<strong>Wireshark</strong> automatically generates a Display Filter, <strong>and</strong> applies it to the capture. The filter is<br />
shown in the Filter Bar, below the button toolbar. Only packets captured with a Source Port of<br />
the value selected should be displayed. The window should be similar to that shown in Figure<br />
6. This same process can be performed on most fields within <strong>Wireshark</strong>, <strong>and</strong> can be used to<br />
include or exclude traffic.<br />
Display<br />
Filter Bar<br />
Figure 6 - Filter Bar<br />
<strong>Network</strong> Security <strong>Packet</strong> <strong>Capture</strong> & <strong>Analysis</strong> –Rich Macfarlane 5
<strong>Wireshark</strong> <strong>Analysis</strong> - TCP Conversations<br />
4.2.7 Start a capture, <strong>and</strong> generate some Web traffic from the WINDOWS2003 virtual server, by<br />
going to www.schneier.com, <strong>and</strong> then stop the capture. Scroll back to the top of the capture<br />
trace. Find the first SYN packet, sent to the Web Server. This signifies the start of a TCP 3-<br />
way h<strong>and</strong>shake.<br />
If your having trouble finding the first SYN packet, select the Edit->Find <strong>Packet</strong> menu option.<br />
Select the Display Filter radio button <strong>and</strong> enter a filter of tcp.flags. (at this point you should<br />
get a list of the flags to choose from). Choose the correct flag, tcp.flags.syn <strong>and</strong> add == 1.<br />
Hit the Find button, <strong>and</strong> the first SYN packet in the trace should be highlighted.<br />
Note: The Find <strong>Packet</strong> function can also be used to search for a Hex signature – such as an<br />
attack signature, or to search for a string – such as a protocol comm<strong>and</strong> - in a <strong>Packet</strong> <strong>Capture</strong><br />
(pcap).<br />
<br />
Can you identify the rest of the TCP 3-way h<strong>and</strong>shake easily (if not read on)<br />
YES/NO<br />
4.2.8 A quick way to create a <strong>Wireshark</strong> Display Filter to isolate a TCP stream is to right click on a<br />
packet in the <strong>Packet</strong> List Panel <strong>and</strong> select Follow TCP Stream. This creates an automatic<br />
Display Filter which displays packets from that TCP session only. It also pops up a session<br />
display window, containing an ASCII representation of the reassembled TCP session (client<br />
packets in red, server packets in blue). The window should look something like Figure 7Error!<br />
Reference source not found..<br />
<strong>Network</strong> Security <strong>Packet</strong> <strong>Capture</strong> & <strong>Analysis</strong> –Rich Macfarlane 6
Figure 7 - Follow TCP Stream<br />
This is very useful for viewing human readable protocol payloads of conversations, such as<br />
with the HTTP, SMTP, <strong>and</strong> FTP protocols. For example you can reconstruct web pages seen<br />
by a user, or view unencrypted email/IM conversations.<br />
If you close the popup window. <strong>Wireshark</strong> now only shows the packets from the selected<br />
TCP Stream. You should be able to identify the 3-way h<strong>and</strong>shake as the first three packets.<br />
<br />
<br />
From your <strong>Wireshark</strong> <strong>Capture</strong>, fill in the diagram below with the IP Addresses <strong>and</strong> Port<br />
Numbers for the Client <strong>and</strong> the Server<br />
For each packet in the TCP 3-way h<strong>and</strong>shake, fill in the Sequence <strong>and</strong> Acknowledgement<br />
numbers, on the diagram below.<br />
Client<br />
Flags: SYN, Seq: ______<br />
Server<br />
IP Address:<br />
_____________<br />
Port Number:<br />
_____________<br />
Flags: SYN, ACK Seq: ______, Ack: ______<br />
Flags: ACK, Seq: ______, Ack: ______<br />
IP Address:<br />
_____________<br />
Port Number:<br />
_____________<br />
<strong>Network</strong> Security <strong>Packet</strong> <strong>Capture</strong> & <strong>Analysis</strong> –Rich Macfarlane 7
4.2.9 Often captures should be saved to disc, for later analysis. To save a capture, select File-<br />
>Save As, <strong>and</strong> use the dialog box as normal. This creates a pcap file, which many tools read<br />
<strong>and</strong> write. For example a tcpdump output file is in this format <strong>and</strong> can be read into<br />
<strong>Wireshark</strong> for analysis. This saves all the captured packets to the file.<br />
<br />
<br />
Did you successfully save your capture to disc<br />
Copy the Display Filter into the clipboard, <strong>and</strong> close <strong>and</strong> start <strong>Wireshark</strong> again, then reload<br />
the file. Was the whole capture saved or just the displayed packets<br />
Paste the display filter back into the Filter Bar, <strong>and</strong> Apply it.<br />
To save only the displayed packets, select File->Save As again, but this time select the<br />
Displayed radio button rather than the default <strong>Capture</strong>d. This creates a pcap file, with only the<br />
packets filtered by the current display filter. This can be useful when analysing large captures,<br />
as interesting packets can be saved<br />
<br />
Close <strong>and</strong> start <strong>Wireshark</strong> again, then reload the file. Was the whole capture saved or just the<br />
displayed packets<br />
4.2.10 Start another capture, <strong>and</strong> generate some Web traffic from the DESKTOP host, by going to<br />
www.schneier.com again, <strong>and</strong> then stop the capture. Scroll back to the top of the capture<br />
trace.<br />
Note: Some useful display filters can be found at: http://wiki.wireshark.org/DisplayFilters<br />
<br />
Create a display filter to show only web traffic involving the the DESKTOP host. What is the<br />
display filter<br />
<strong>Network</strong> Security <strong>Packet</strong> <strong>Capture</strong> & <strong>Analysis</strong> –Rich Macfarlane 8
<strong>Wireshark</strong> <strong>Analysis</strong> - Statistics<br />
4.2.10 <strong>Wireshark</strong> provides a Statistics menu, which provides tools to help narrow the focus of a<br />
network forensic investigation, including overall statistics, conversations, <strong>and</strong> information on<br />
systems involved in the conversations.<br />
Start the capture, <strong>and</strong> generate some Web traffic by going to www.schneier.com, then stop<br />
the capture, <strong>and</strong> select the Statistics->Protocol Hierarchy menu option. A window similar to<br />
that shown in Figure 8 should be shown, displaying statictics about the pcap. Note that all<br />
the packets are L2 Ethernet (Local Area <strong>Network</strong>) packets, but at the network layer most of<br />
the packets are TCP, but some are UDP<br />
Figure 8 - Protocol Statistics<br />
<br />
What percentage of packets in your capture are TCP, <strong>and</strong> give an example of the higher level<br />
protocol which uses TCP<br />
<br />
What percentage of packets in your capture are UDP, <strong>and</strong> give an example of the higher level<br />
protocol which uses UDP (use Figure 9)<br />
<strong>Network</strong> Security <strong>Packet</strong> <strong>Capture</strong> & <strong>Analysis</strong> –Rich Macfarlane 9
OSI Model<br />
TCP/IP Model<br />
Application<br />
Presentation<br />
Session<br />
Transport<br />
<strong>Network</strong><br />
Data Link<br />
Physical<br />
HTTP, FTP , SMTP<br />
TCP, UDP<br />
IP, ICMP<br />
Ethernet, ATM<br />
Application<br />
Transport<br />
Internet<br />
<strong>Network</strong><br />
Figure 9 - <strong>Network</strong> Model with Protocols<br />
4.2.11 Select the Statistics->Flow Graph menu option. Choose General Flow <strong>and</strong> <strong>Network</strong> Source<br />
options, <strong>and</strong> click the OK button. A window similar to that shown in Figure 10 should be<br />
displayed, visualising the flow of traffic. Other useful options in the Statistics menu include<br />
the Statistics->IP Addresses option which categorises all IP Addresses traffic, in the current<br />
pcap capture.<br />
Figure 10 - Traffic Flow Graph<br />
<strong>Network</strong> Security <strong>Packet</strong> <strong>Capture</strong> & <strong>Analysis</strong> –Rich Macfarlane 10


![Unit 5. Switches and VLANs [PDF]](https://img.yumpu.com/34422504/1/184x260/unit-5-switches-and-vlans-pdf.jpg?quality=85)