Transgender EuroStudy â Legal Survey and Focus ... - ILGA Europe
Transgender EuroStudy â Legal Survey and Focus ... - ILGA Europe
Transgender EuroStudy â Legal Survey and Focus ... - ILGA Europe

You also want an ePaper? Increase the reach of your titles
YUMPU automatically turns print PDFs into web optimized ePapers that Google loves.
43 April 2008<br />
almost certainly arose out of conservative clinical settings which would have refused treatment for<br />
trans people who were getting paid for sex <strong>and</strong> is clearly evidenced by the failure of trans support<br />
groups to obtain funding for HIV work.<br />
The analysis for this paper focuses on 615 (female to male) trans men, <strong>and</strong> 1349 (male to<br />
female) trans women, who were the survey respondents as of 1 December 2007 after incomplete or<br />
duplicate responses were removed. Only around 50% of these provided adequate information for the<br />
health care survey analysis.<br />
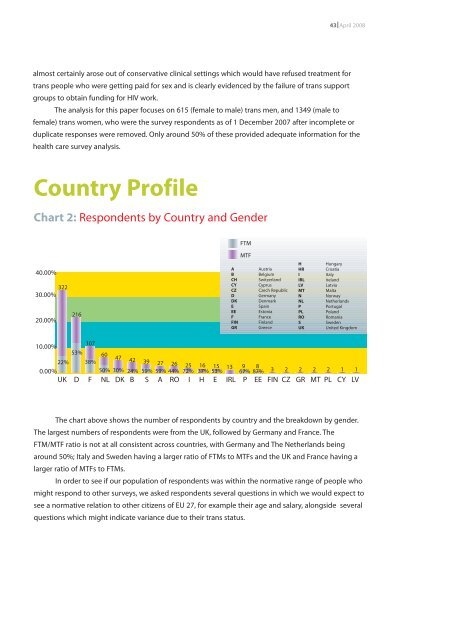
Country Profile<br />
Chart 2: Respondents by Country <strong>and</strong> Gender<br />
FTM<br />
MTF<br />
40.00%<br />
322<br />
30.00%<br />
20.00%<br />
216<br />
A<br />
B<br />
CH<br />
CY<br />
CZ<br />
D<br />
DK<br />
E<br />
EE<br />
F<br />
FIN<br />
GR<br />
Austria<br />
Belgium<br />
Switzerl<strong>and</strong><br />
Cyprus<br />
Czech Republic<br />
Germany<br />
Denmark<br />
Spain<br />
Estonia<br />
France<br />
Finl<strong>and</strong><br />
Greece<br />
H<br />
HR<br />
I<br />
IRL<br />
LV<br />
MT<br />
N<br />
NL<br />
P<br />
PL<br />
RO<br />
S<br />
UK<br />
Hungary<br />
Croatia<br />
Italy<br />
Irel<strong>and</strong><br />
Latvia<br />
Malta<br />
Norway<br />
Netherl<strong>and</strong>s<br />
Portugal<br />
Pol<strong>and</strong><br />
Romania<br />
Sweden<br />
United Kingdom<br />
107<br />
10.00%<br />
53%<br />
22% 38%<br />
60<br />
47 42 39 27 26 25 16 15 13 9 8<br />
50% 30% 24% 59% 59% 44% 72% 37% 53% 67% 87%<br />
3 2 2 2 2 1 1<br />
0.00%<br />
UK D F NL DK B S A RO I H E IRL P EE FIN CZ GR MT PL CY LV<br />
The chart above shows the number of respondents by country <strong>and</strong> the breakdown by gender.<br />
The largest numbers of respondents were from the UK, followed by Germany <strong>and</strong> France. The<br />
FTM/MTF ratio is not at all consistent across countries, with Germany <strong>and</strong> The Netherl<strong>and</strong>s being<br />
around 50%; Italy <strong>and</strong> Sweden having a larger ratio of FTMs to MTFs <strong>and</strong> the UK <strong>and</strong> France having a<br />
larger ratio of MTFs to FTMs.<br />
In order to see if our population of respondents was within the normative range of people who<br />
might respond to other surveys, we asked respondents several questions in which we would expect to<br />
see a normative relation to other citizens of EU 27, for example their age <strong>and</strong> salary, alongside several<br />
questions which might indicate variance due to their trans status.