Transgender EuroStudy â Legal Survey and Focus ... - ILGA Europe
Transgender EuroStudy â Legal Survey and Focus ... - ILGA Europe
Transgender EuroStudy â Legal Survey and Focus ... - ILGA Europe

You also want an ePaper? Increase the reach of your titles
YUMPU automatically turns print PDFs into web optimized ePapers that Google loves.
<strong>Transgender</strong> <strong>EuroStudy</strong>:<br />
<strong>Legal</strong> <strong>Survey</strong> <strong>and</strong> <strong>Focus</strong> on the<br />
<strong>Transgender</strong> Experience of Health Care<br />
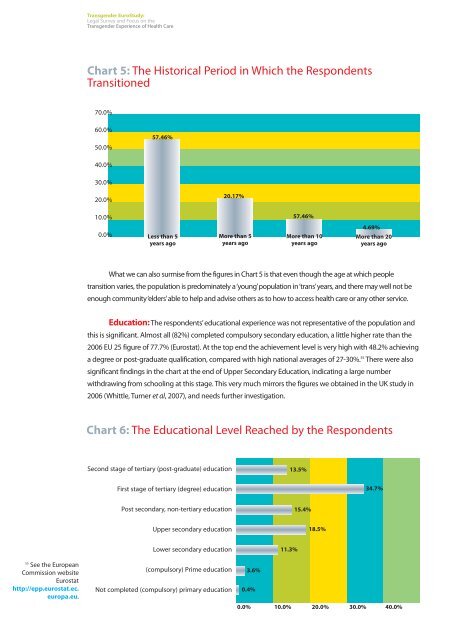
Chart 5: The Historical Period in Which the Respondents<br />
Transitioned<br />
70.0%<br />
60.0%<br />
50.0%<br />
57.46%<br />
40.0%<br />
30.0%<br />
20.0%<br />
20.17%<br />
10.0%<br />
57.46%<br />
0.0%<br />
Less than 5<br />
years ago<br />
More than 5<br />
years ago<br />
More than 10<br />
years ago<br />
4.69%<br />
More than 20<br />
years ago<br />
What we can also surmise from the figures in Chart 5 is that even though the age at which people<br />
transition varies, the population is predominately a ‘young’population in ‘trans’years, <strong>and</strong> there may well not be<br />
enough community ‘elders’able to help <strong>and</strong> advise others as to how to access health care or any other service.<br />
Education: The respondents’ educational experience was not representative of the population <strong>and</strong><br />
this is significant. Almost all (82%) completed compulsory secondary education, a little higher rate than the<br />
2006 EU 25 figure of 77.7% (Eurostat). At the top end the achievement level is very high with 48.2% achieving<br />
a degree or post-graduate qualification, compared with high national averages of 27-30%. 55 There were also<br />
significant findings in the chart at the end of Upper Secondary Education, indicating a large number<br />
withdrawing from schooling at this stage. This very much mirrors the figures we obtained in the UK study in<br />
2006 (Whittle, Turner et al, 2007), <strong>and</strong> needs further investigation.<br />
Chart 6: The Educational Level Reached by the Respondents<br />
Second stage of tertiary (post-graduate) education<br />
13.5%<br />
First stage of tertiary (degree) education<br />
34.7%<br />
Post secondary, non-tertiary education<br />
15.4%<br />
Upper secondary education<br />
18.5%<br />
55<br />
See the <strong>Europe</strong>an<br />
Commission website<br />
Eurostat<br />
http://epp.eurostat.ec.<br />
europa.eu.<br />
Lower secondary education<br />
(compulsory) Prime education<br />
Not completed (compulsory) primary education<br />
11.3%<br />
3.6%<br />
0.4%<br />
0.0% 10.0% 20.0% 30.0% 40.0%