Transgender EuroStudy â Legal Survey and Focus ... - ILGA Europe
Transgender EuroStudy â Legal Survey and Focus ... - ILGA Europe
Transgender EuroStudy â Legal Survey and Focus ... - ILGA Europe

You also want an ePaper? Increase the reach of your titles
YUMPU automatically turns print PDFs into web optimized ePapers that Google loves.
<strong>Transgender</strong> <strong>EuroStudy</strong>:<br />
<strong>Legal</strong> <strong>Survey</strong> <strong>and</strong> <strong>Focus</strong> on the<br />
<strong>Transgender</strong> Experience of Health Care<br />
Comparison by occupation<br />
100<br />
80<br />
60<br />
40<br />
20<br />
0<br />
34 34<br />
unskilled<br />
skilled<br />
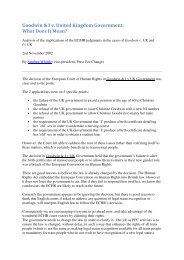
Chart 14 shows that nearly one third of the respondents from all the selected groups are<br />
reporting that they were refused treatment because a practitioner did not approve of gender<br />
reassignment. There is also only an improvement of 9% for the respondents who transitioned less than<br />
5 years ago. There is no difference at all between those who were in skilled or unskilled occupations,<br />
but a difference of 17% in the comparisons across salaries, with a markedly smaller number of those<br />
on a higher income reporting a refusal.<br />
A survey respondent in Italy wrote:<br />
My GP stopped writing my prescriptions (not hormones) <strong>and</strong> advised me to find another doctor<br />
because he didn’t approve of my transition.<br />
Further Analysis of Those Who Were Refused<br />
Who Paid for Treatment Themselves<br />
We asked respondents if they had ever been refused, or made to wait far longer than expected,<br />
for any treatment relating to transgender or transsexual health care, including gender reassignment,<br />
after appropriate clinical recommendation. We then added a filter to determine those who had been<br />
refused <strong>and</strong> then paid themselves. This filter was applied across the different groups.<br />
Chart 14: Percentage of Respondents Who Were Refused<br />
Treatment <strong>and</strong> Paid Themselves<br />
Comparison by when transitioned<br />
100<br />
80<br />
60<br />
40<br />
20<br />
0<br />
60<br />
54<br />
> 10 years<br />
> 5 years