Statistická ročenka Olomouckého kraje 2011 - Český statistický úřad
Statistická ročenka Olomouckého kraje 2011 - Český statistický úřad
Statistická ročenka Olomouckého kraje 2011 - Český statistický úřad

Create successful ePaper yourself
Turn your PDF publications into a flip-book with our unique Google optimized e-Paper software.
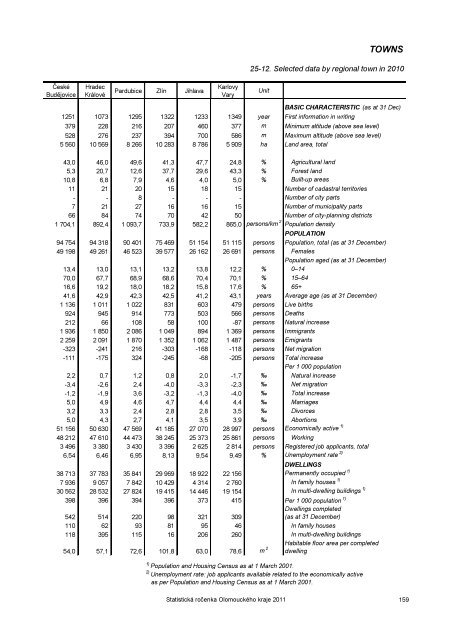
TOWNS<br />
25-12. Selected data by regional town in 2010<br />
České<br />
Budějovice<br />
Hradec<br />
Králové<br />
Pardubice Zlín Jihlava<br />
Karlovy<br />
Vary<br />
Unit<br />
BASIC CHARACTERISTIC (as at 31 Dec)<br />
1251 1073 1295 1322 1233 1349 year First information in writing<br />
379 228 216 207 460 377 m Minimum altitude (above sea level)<br />
528 276 237 394 700 586 m Maximum altitude (above sea level)<br />
5 560 10 569 8 266 10 283 8 786 5 909 ha Land area, total<br />
43,0 46,0 49,6 41,3 47,7 24,8 % Agricultural land<br />
5,3 20,7 12,6 37,7 29,6 43,3 % Forest land<br />
10,8 6,8 7,9 4,6 4,0 5,0 % Built-up areas<br />
11 21 20 15 18 15 Number of cadastral territories<br />
- - 8 - - - Number of city parts<br />
7 21 27 16 16 15 Number of municipality parts<br />
66 84 74 70 42 50 Number of city-planning districts<br />
1 704,1 892,4 1 093,7 733,9 582,2 865,0 persons/km 2 Population density<br />
POPULATION<br />
94 754 94 318 90 401 75 469 51 154 51 115 persons Population, total (as at 31 December)<br />
49 198 49 261 46 523 39 577 26 162 26 691 persons Females<br />
Population aged (as at 31 December)<br />
13,4 13,0 13,1 13,2 13,8 12,2 % 0–14<br />
70,0 67,7 68,9 68,6 70,4 70,1 % 15–64<br />
16,6 19,2 18,0 18,2 15,8 17,6 % 65+<br />
41,6 42,9 42,3 42,5 41,2 43,1 years Average age (as at 31 December)<br />
1 136 1 011 1 022 831 603 479 persons Live births<br />
924 945 914 773 503 566 persons Deaths<br />
212 66 108 58 100 -87 persons Natural increase<br />
1 936 1 850 2 086 1 049 894 1 369 persons Immigrants<br />
2 259 2 091 1 870 1 352 1 062 1 487 persons Emigrants<br />
-323 -241 216 -303 -168 -118 persons Net migration<br />
-111 -175 324 -245 -68 -205 persons Total increase<br />
Per 1 000 population<br />
2,2 0,7 1,2 0,8 2,0 -1,7 ‰ Natural increase<br />
-3,4 -2,6 2,4 -4,0 -3,3 -2,3 ‰ Net migration<br />
-1,2 -1,9 3,6 -3,2 -1,3 -4,0 ‰ Total increase<br />
5,0 4,9 4,6 4,7 4,4 4,4 ‰ Marriages<br />
3,2 3,3 2,4 2,8 2,8 3,5 ‰ Divorces<br />
5,0 4,3 2,7 4,1 3,5 3,9 ‰ Abortions<br />
51 156 50 630 47 569 41 185 27 070 28 997 persons Economically active 1)<br />
48 212 47 610 44 473 38 245 25 373 25 861 persons Working<br />
3 496 3 380 3 430 3 396 2 625 2 814 persons Registered job applicants, total<br />
6,54 6,46 6,95 8,13 9,54 9,49 % Unemployment rate 2)<br />
DWELLINGS<br />
38 713 37 783 35 841 29 969 18 922 22 156 Permanently occupied 1)<br />
7 936 9 057 7 842 10 429 4 314 2 760 In family houses 1)<br />
30 562 28 532 27 824 19 415 14 446 19 154 In multi-dwelling buildings 1)<br />
398 396 394 396 373 415 Per 1 000 population 1)<br />
542 514 220 98 321 309<br />
Dwellings completed<br />
(as at 31 December)<br />
110 62 93 81 95 46 In family houses<br />
118 395 115 16 206 260 In multi-dwelling buildings<br />
54,0 57,1 72,6 101,8 63,0 78,6 m 2 Habitable floor area per completed<br />
dwelling<br />
1) Population and Housing Census as at 1 March 2001.<br />
2) Unemployment rate: job applicants available related to the economically active<br />
as per Population and Housing Census as at 1 March 2001.<br />
<strong>Statistická</strong> <strong>ročenka</strong> <strong>Olomouckého</strong> <strong>kraje</strong> <strong>2011</strong> 159