Statistická ročenka Olomouckého kraje 2011 - Český statistický úřad
Statistická ročenka Olomouckého kraje 2011 - Český statistický úřad
Statistická ročenka Olomouckého kraje 2011 - Český statistický úřad

Create successful ePaper yourself
Turn your PDF publications into a flip-book with our unique Google optimized e-Paper software.
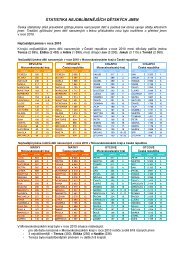
2005 2006 2007 2008 2009 2010 Unit<br />
BASIC CHARACTERISTIC<br />
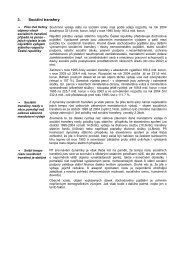
1-2. Long-term development of the Olomoucký Region in 1995–2010<br />
(data for 1995-2004 are not recalculated for regions established as at 1 January 2005)<br />
Continued<br />
LABOUR MARKET<br />
282,8 292,2 295,9 296,0 292,4 278,5<br />
thousand<br />
persons The employed, total<br />
15,9 16,5 14,2 11,1 15,6 13,7 Agriculture, forestry and fishing<br />
116,3 126,3 131,0 127,6 117,8 115,7 Industry and Construction<br />
150,6 149,5 150,7 157,3 159,0 149,1 Market and non-market services<br />
58,1 58,3 57,5 57,0 57,4 55,7 % Participation rate<br />
225,6 223,4 228,2 222,8 212,3 .<br />
headcount,<br />
thousand<br />
Average registered number<br />
of employees 4)<br />
15 744 16 797 18 080 19 292 19 926 . CZK Average monthly gross wage 4)<br />
13 268 13 935 15 646 17 019 17 412 . Agriculture, forestry and fishing<br />
15 833 16 842 18 299 19 425 20 099 . Industry<br />
15 288 16 759 17 683 22 037 22 496 . Construction<br />
Unemployment (as at 31 December) 5)<br />
36 180 31 187 23 495 23 470 41 092 42 117 persons Registered job applicants, total<br />
34 209 29 299 21 944 22 218 40 026 40 732 Available<br />
18 675 16 838 12 785 12 250 18 846 19 904 Females<br />
2 849 4 537 5 224 2 747 821 1 210 vacancies Vacancies<br />
Registered unemployment rate<br />
. . . . . . % According to the former methodology<br />
10,65 8,97 6,73 6,87 12,19 12,48 % According to the new methodology<br />
ORGANIZATIONAL STATISTICS<br />
129 331 130 427 132 139 135 028 133 275 136 229 Registered entities (as at 31 December)<br />
8 858 9 294 9 819 10 447 10 852 11 336 Business companies and partnerships<br />
514 543 572 578 607 612 Cooperatives<br />
37 28 23 21 16 15 State-owned enterprises<br />
95 657 96 034 96 992 98 572 102 263 104 365 Entrepreneurs under trade licence<br />
7 621 10) 7 513 10) 7 425 10) 7 412 1 835 11) 1 904 Self-employed farmers<br />
AGRICULTURE<br />
185 344 185 139 184 178 182 347 180 974 175 248 hectares Area under crops, total (as at 31 May) 6)<br />
110 773 107 387 111 076 111 479 112 496 105 104 Cereals, total<br />
787 631 807 846 669 662 Potatoes, total<br />
15 870 17 489 19 815 21 152 20 914 22 876 Rape<br />
Harvests 6)<br />
572 515 488 224 536 286 647 494 625 462 520 048 tonnes Cereals, total<br />
21 248 14 060 20 132 21 006 16 697 15 039 tonnes Potatoes, total<br />
47 732 55 546 62 257 65 485 69 341 64 283 tonnes Rape<br />
Per hectare yields of selected crops 6)<br />
5,10 4,54 4,77 5,79 5,49 4,95 tonnes Cereals, total<br />
27,00 22,25 24,95 24,82 24,98 22,71 tonnes Potatoes, total<br />
3,01 3,18 3,14 3,10 3,32 2,81 tonnes Rape<br />
Livestock as at 1 April of the following<br />
year 7)<br />
92 981 97 241 96 873 91 710 89 441 89 579 heads Cattle, total<br />
217 057 219 339 188 042 144 343 125 277 111 408 heads Pigs, total<br />
567 447 566 104 437 660 531 049 424 019 380 585 heads Poultry, total<br />
5 893 6 067 7 606 7 872 9 175 9 164 heads Sheep, total<br />
38,5 39,1 38,7 36,8 36,2 36,7 heads/100 ha Cattle density 8)<br />
10) 11)<br />
116,5 117,8 101,8 78,9 68,9 62,9 heads/100 ha Pigs density 9)<br />
4) By workplace location, since 2002 includes small enterprises.<br />
5) Registered unemployment as given by labour offices.<br />
6) Before 2002 includes leisure activites of the population.<br />
7) Before 2000 includes leisure activites of the population; before 1 March 2001.<br />
8) Related to agricultural land.<br />
9) Related to arable land.<br />
10) Includes agricultural entrepreneurs.<br />
11) Agricultural entrepreneurs only.<br />
<strong>Statistická</strong> <strong>ročenka</strong> <strong>Olomouckého</strong> <strong>kraje</strong> <strong>2011</strong> 29