ÚZEMNÍ SROVNÁNÍ 26-2. Vybrané ukazatele podle krajů v roce 2010 Měřicí jednotka Česká republika Czech Republic Hlavní město Praha v tom <strong>kraje</strong> Plzeňský Ústecký Karlovarský Středočeský Jihočeský Liberecký Rozloha celkem km 2 78 865,4 496,1 11 015,3 10 056,9 7 560,9 3 314,4 5 334,6 3 163,0 zemědělská půda % 53,7 41,0 60,2 48,9 50,3 37,4 51,7 44,3 lesní pozemky % 33,7 10,3 27,8 37,5 39,6 43,3 30,2 44,4 Počet obcí celkem 6 250 1 1 145 623 501 132 354 215 se statutem města 594 1 82 53 56 37 58 39 Podíl městského obyvatelstva % 70,0 100,0 53,5 64,3 67,8 83,0 79,9 78,1 Hustota obyvatelstva osoby/km 2 133,6 2 533,9 114,8 63,5 75,7 92,8 156,7 139,1 Počet obyvatel (k 31. 12.) osoby 10 532 770 1 257 158 1 264 978 638 706 572 045 307 444 836 045 439 942 Podíl cizinců na obyvatelstvu % 4,0 11,8 4,6 2,4 4,4 6,4 3,7 3,8 Průměrný věk (k 31. 12.) roky 40,8 41,6 40,1 40,9 41,2 40,4 40,0 40,3 Na 1 000 obyvatel živě narození ‰ 11,1 11,8 12,1 10,9 10,9 10,8 11,1 11,7 zemřelí ‰ 10,2 9,8 9,9 10,1 10,2 10,1 10,7 9,7 přistěhovalí ‰ 2,9 26,7 23,9 7,7 8,4 9,7 9,1 10,0 vystěhovalí ‰ 1,4 22,3 12,3 6,9 8,9 11,0 9,7 9,9 celkový přírůstek ‰ 2,5 6,5 13,9 1,7 0,3 -0,6 -0,2 2,1 Hrubý domácí produkt mil. Kč 3 775 237 972 551 405 837 195 732 175 398 79 845 250 267 117 992 na 1 obyvatele Kč 358 957 776 968 322 811 306 833 306 628 259 560 299 435 268 480 průměr ČR = 100 % 100,0 216,5 89,9 85,5 85,4 72,3 83,4 74,8 Zaměstnaní celkem tis. osob 4 885,2 656,8 602,2 300,0 273,7 144,4 361,9 201,5 zemědělství, lesnictví a rybářství % 3,1 0,3 3,0 5,8 5,0 2,7 2,1 2,0 průmysl % 28,5 9,4 26,6 30,2 32,8 31,4 32,0 36,7 stavebnictví % 9,5 8,7 10,1 10,0 8,3 8,8 11,8 11,0 Míra obecné nezaměstnanosti % 7,3 3,8 5,2 5,3 5,9 10,8 11,2 7,0 Průměrná hrubá měsíční mzda zaměstnance (2009) 1) Kč 22 663 30 028 21 972 20 319 21 864 19 450 20 850 20 426 Dokončené byty 36 442 6 151 7 405 2 137 1 903 866 1 097 1 256 na 1 000 obyvatel 3,5 4,9 5,9 3,4 3,3 2,8 1,3 2,9 Hosté v hromadných ubytovacích zařízeních osoby 12 211 878 4 743 373 631 356 892 962 484 178 670 457 289 528 632 568 nerezidenti 6 333 996 4 116 867 142 575 287 703 154 122 458 499 98 001 148 269 Lékaři (přepočtené osoby) osoby 45 646 9 200 3 963 2 557 2 576 1 193 2 845 1 620 na 1 000 obyvatel 4,3 7,3 3,2 4,0 4,5 3,9 3,4 3,7 Nemocnice 189 27 25 9 11 5 20 8 lůžka 62 219 10 018 5 908 3 538 3 508 1 613 5 122 2 674 na 1 000 obyvatel 5,9 8,0 4,7 5,5 6,1 5,2 6,1 6,1 Průměrná pracovní neschopnost % 3,763 3,039 3,879 4,210 3,951 3,610 3,691 4,050 Příjemci důchodů celkem osoby 2 819 093 309 679 319 828 172 023 155 168 77 343 223 069 118 567 z toho starobních 2) 1 645 436 198 350 184 909 97 962 90 582 47 189 125 822 69 036 Průměrný měsíční důchod celkem Kč 9 884 10 634 9 940 9 767 9 882 9 756 9 749 9 791 starobní 2) 10 123 10 817 10 184 10 014 10 075 9 925 10 047 10 056 Zjištěné trestné činy 313 387 74 028 38 217 15 298 13 843 7 939 29 438 13 764 na 1 000 obyvatel 29,8 59,1 30,4 24,0 24,2 25,8 35,2 31,3 Dopravní nehody 75 522 18 190 9 870 2 899 2 813 1 737 7 217 3 864 na 1 000 obyvatel 7,2 14,5 7,9 4,5 4,9 5,6 8,6 8,8 1) pracovištní metoda (včetně subjektů do 20 zaměstnanců) 2) bez souběhu s vdovským nebo vdoveckým 174 <strong>Statistická</strong> <strong>ročenka</strong> <strong>Olomouckého</strong> <strong>kraje</strong> <strong>2011</strong>
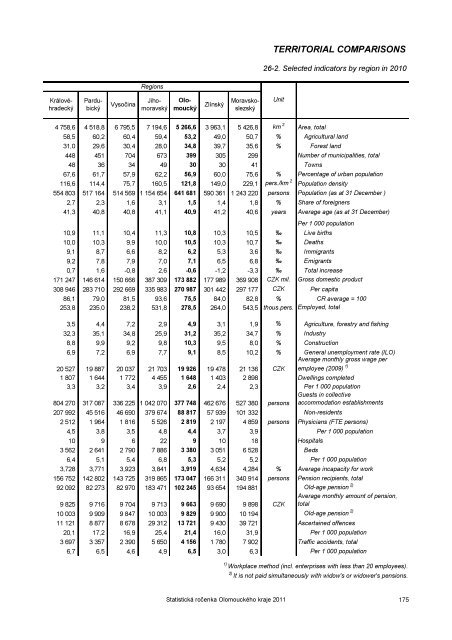
TERRITORIAL COMPARISONS 26-2. Selected indicators by region in 2010 Regions Pardubický Královéhradecký Jihomoravský Vysočina Olomoucký Moravskoslezský Zlínský Unit 4 758,6 4 518,8 6 795,5 7 194,6 5 266,6 3 963,1 5 426,8 km 2 Area, total 58,5 60,2 60,4 59,4 53,2 49,0 50,7 % Agricultural land 31,0 29,6 30,4 28,0 34,8 39,7 35,6 % Forest land 448 451 704 673 399 305 299 Number of municipalities, total 48 36 34 49 30 30 41 Towns 67,6 61,7 57,9 62,2 56,9 60,0 75,6 % Percentage of urban population 116,6 114,4 75,7 160,5 121,8 149,0 229,1 pers./km 2 Population density 554 803 517 164 514 569 1 154 654 641 681 590 361 1 243 220 persons Population (as at 31 December ) 2,7 2,3 1,6 3,1 1,5 1,4 1,8 % Share of foreigners 41,3 40,8 40,8 41,1 40,9 41,2 40,6 years Average age (as at 31 December) Per 1 000 population 10,9 11,1 10,4 11,3 10,8 10,3 10,5 ‰ Live births 10,0 10,3 9,9 10,0 10,5 10,3 10,7 ‰ Deaths 9,1 8,7 6,6 8,2 6,2 5,3 3,6 ‰ Immigrants 9,2 7,8 7,9 7,0 7,1 6,5 6,8 ‰ Emigrants 0,7 1,6 -0,8 2,6 -0,6 -1,2 -3,3 ‰ Total increase 171 247 146 614 150 666 387 309 173 882 177 989 369 908 CZK mil. Gross domestic product 308 946 283 710 292 669 335 983 270 987 301 442 297 177 CZK Per capita 86,1 79,0 81,5 93,6 75,5 84,0 82,8 % CR average = 100 253,8 235,0 238,2 531,8 278,5 264,0 543,5 thous.pers. Employed, total 3,5 4,4 7,2 2,9 4,9 3,1 1,9 % Agriculture, forestry and fishing 32,3 35,1 34,8 25,9 31,2 35,2 34,7 % Industry 8,8 9,9 9,2 9,8 10,3 9,5 8,0 % Construction 6,9 7,2 6,9 7,7 9,1 8,5 10,2 % General unemployment rate (ILO) 20 527 19 887 20 037 21 703 19 926 19 478 21 136 CZK Average monthly gross wage per employee (2009) 1) 1 807 1 644 1 772 4 455 1 648 1 403 2 898 Dwellings completed 3,3 3,2 3,4 3,9 2,6 2,4 2,3 Per 1 000 population Guests in collective 804 270 317 087 336 225 1 042 070 377 748 462 676 527 380 persons accommodation establishments 207 992 45 516 46 690 379 674 88 817 57 939 101 332 Non-residents 2 512 1 964 1 816 5 526 2 819 2 197 4 859 persons Physicians (FTE persons) 4,5 3,8 3,5 4,8 4,4 3,7 3,9 Per 1 000 population 10 9 6 22 9 10 18 Hospitals 3 562 2 641 2 790 7 886 3 380 3 051 6 528 Beds 6,4 5,1 5,4 6,8 5,3 5,2 5,2 Per 1 000 population 3,728 3,771 3,923 3,841 3,919 4,634 4,284 % Average incapacity for work 156 752 142 802 143 725 319 865 173 047 166 311 340 914 persons Pension recipients, total 92 092 82 273 82 970 183 471 102 245 93 654 194 881 Old-age pension 2) 9 825 9 716 9 704 9 713 9 663 9 690 9 898 CZK Average monthly amount of pension, total 10 003 9 909 9 847 10 003 9 829 9 900 10 194 Old-age pension 2) 11 121 8 877 8 678 29 312 13 721 9 430 39 721 Ascertained offences 20,1 17,2 16,9 25,4 21,4 16,0 31,9 Per 1 000 population 3 697 3 357 2 390 5 650 4 156 1 780 7 902 Traffic accidents, total 6,7 6,5 4,6 4,9 6,5 3,0 6,3 Per 1 000 population 1) Workplace method (incl. enterprises with less than 20 employees). 2) It is not paid simultaneously with widow's or widower's pensions. <strong>Statistická</strong> <strong>ročenka</strong> <strong>Olomouckého</strong> <strong>kraje</strong> <strong>2011</strong> 175
- Page 1 and 2:
VÍCETÉMATICKÉ INFORMACE CROSS-TH
- Page 3 and 4:
PŘEDMLUVA Statistická ročenka Ol
- Page 5 and 6:
FOREWORD The Statistical Yearbook o
- Page 7 and 8:
OBSAH Předmluva ..................
- Page 9 and 10:
SEZNAM MAP, KARTOGRAMŮ A GRAFŮ Ge
- Page 11 and 12:
14-101. Spotřeba paliv a energie p
- Page 13 and 14:
11-5. Fruit trees and harvest of fr
- Page 15 and 16:
LIST OF TABLES ON INCLUDED CD 1-101
- Page 17 and 18:
Olomoucký kraj Olomoucký Region N
- Page 19 and 20:
CHARAKTERISTIKA OLOMOUCKÉHO KRAJE
- Page 21 and 22:
CHARACTERISTICS OF THE OLOMOUCKÝ R
- Page 23 and 24:
downhill courses and pistes are pre
- Page 25 and 26:
ZÁKLADNÍ CHARAKTERISTIKA BASIC CH
- Page 27 and 28:
2005 2006 2007 2008 2009 2010 Unit
- Page 29 and 30:
2005 2006 2007 2008 2009 2010 Unit
- Page 31 and 32:
2005 2006 2007 2008 2009 2010 Unit
- Page 33 and 34:
2005 2006 2007 2008 2009 2010 Unit
- Page 35 and 36:
OKRESY DISTRICTS 1-3. Vybrané ukaz
- Page 37 and 38:
OKRESY DISTRICTS 1-5. Vybrané ukaz
- Page 39 and 40:
OKRESY DISTRICTS 1-7. Vybrané ukaz
- Page 41 and 42:
ÚZEMÍ 2-1. Vybrané údaje o úze
- Page 43 and 44:
ÚZEMÍ AREA 2-4. Velikostní skupi
- Page 45 and 46:
ŽIVOTNÍ PROSTŘEDÍ 3-1. Chráně
- Page 47 and 48:
ŽIVOTNÍ PROSTŘEDÍ ENVIRONMENT 3
- Page 49 and 50:
ŽIVOTNÍ PROSTŘEDÍ ENVIRONMENT 3
- Page 51 and 52:
ŽIVOTNÍ PROSTŘEDÍ ENVIRONMENT 3
- Page 53 and 54:
ŽIVOTNÍ PROSTŘEDÍ 3-11. Produkc
- Page 55 and 56:
ŽIVOTNÍ PROSTŘEDÍ ENVIRONMENT 3
- Page 57 and 58:
OBYVATELSTVO POPULATION 4-2. Slože
- Page 59 and 60:
OBYVATELSTVO POPULATION 4-3. Sňatk
- Page 61 and 62:
OBYVATELSTVO POPULATION 4-7. Zemře
- Page 63 and 64:
OBYVATELSTVO POPULATION 4-9. Přist
- Page 65 and 66:
POPULATION 4-10. Selected demograph
- Page 67 and 68:
OBYVATELSTVO 4-12. Cizinci podle ok
- Page 69 and 70:
Hrubý domácí produkt na obyvatel
- Page 71 and 72:
ÚZEMNÍ ROZPOČTY LOCAL GOVERNMENT
- Page 73 and 74:
ÚZEMNÍ ROZPOČTY LOCAL GOVERNMENT
- Page 75 and 76:
CENY PRICES 7-2. Průměrné ceny v
- Page 77 and 78:
ŽIVOTNÍ PODMÍNKY LIVING CONDITIO
- Page 79 and 80:
TRH PRÁCE LABOUR MARKET 9-3. Ekono
- Page 81 and 82:
TRH PRÁCE LABOUR MARKET 9-6. Zamě
- Page 83 and 84:
TRH PRÁCE LABOUR MARKET 9-8. Prům
- Page 85 and 86:
TRH PRÁCE LABOUR MARKET 9-10. Medi
- Page 87 and 88:
TRH PRÁCE LABOUR MARKET 9-11. Mír
- Page 89 and 90:
TRH PRÁCE LABOUR MARKET 9-14. Neum
- Page 91 and 92:
ORGANIZAČNÍ STATISTIKA ORGANIZATI
- Page 93 and 94:
ORGANIZAČNÍ STATISTIKA ORGANIZATI
- Page 95 and 96:
ORGANIZAČNÍ STATISTIKA ORGANIZATI
- Page 97 and 98:
ZEMĚDĚLSTVÍ AGRICULTURE 11-2. Os
- Page 99 and 100:
ZEMĚDĚLSTVÍ AGRICULTURE 11-6. Ho
- Page 101 and 102:
ZEMĚDĚLSTVÍ AGRICULTURE 11-10. P
- Page 103 and 104:
PRŮMYSL INDUSTRY 13-1. Vybrané ú
- Page 105 and 106:
PRŮMYSL INDUSTRY 13-3. Tržby za p
- Page 107 and 108:
PRŮMYSL INDUSTRY 13-5. Průměrná
- Page 109 and 110:
STAVEBNICTVÍ, BYTOVÁ VÝSTAVBA 15
- Page 111 and 112:
STAVEBNICTVÍ, BYTOVÁ VÝSTAVBA CO
- Page 113 and 114:
STAVEBNICTVÍ, BYTOVÁ VÝSTAVBA CO
- Page 115 and 116:
CESTOVNÍ RUCH TOURISM 16-2. Kapaci
- Page 117 and 118:
CESTOVNÍ RUCH TOURISM 16-4. Kapaci
- Page 119 and 120:
DOPRAVA TRANSPORT 17-2. Délka siln
- Page 121 and 122:
INFORMAČNÍ A KOMUNIKAČNÍ TECHNO
- Page 123 and 124: VĚDA A VÝZKUM SCIENCE AND RESEARC
- Page 125 and 126: VĚDA A VÝZKUM SCIENCE AND RESEARC
- Page 127 and 128: Diagram of the Czech Republic educa
- Page 129 and 130: VZDĚLÁVÁNÍ EDUCATION 20-2. Pře
- Page 131 and 132: ZDRAVOTNICTVÍ HEALTH 21-1. Vybran
- Page 133 and 134: ZDRAVOTNICTVÍ HEALTH 21-3. Vybran
- Page 135 and 136: SOCIÁLNÍ ZABEZPEČENÍ SOCIAL SEC
- Page 137 and 138: SOCIÁLNÍ ZABEZPEČENÍ SOCIAL SEC
- Page 139 and 140: SOCIÁLNÍ ZABEZPEČENÍ SOCIAL SEC
- Page 141 and 142: SOCIÁLNÍ ZABEZPEČENÍ SOCIAL SEC
- Page 143 and 144: KRIMINALITA, NEHODY CRIME, ACCIDENT
- Page 145 and 146: KRIMINALITA, NEHODY CRIME, ACCIDENT
- Page 147 and 148: KRIMINALITA, NEHODY CRIME, ACCIDENT
- Page 149 and 150: SPRÁVNÍ OBVODY ADMINISTRATIVE DIS
- Page 151 and 152: SPRÁVNÍ OBVODY ADMINISTRATIVE DIS
- Page 153 and 154: SPRÁVNÍ OBVODY ADMINISTRATIVE DIS
- Page 155 and 156: SPRÁVNÍ OBVODY ADMINISTRATIVE DIS
- Page 157 and 158: MĚSTA TOWNS 25-11. Vybrané ukazat
- Page 159 and 160: TOWNS 25-12. Selected data by regio
- Page 161 and 162: OBCE MUNICIPALITIES 25-13. Katastr
- Page 163 and 164: OBCE MUNICIPALITIES 25-13. Katastr
- Page 165 and 166: Vybrané ukazatele v regionech soud
- Page 167 and 168: TERRITORIAL COMPARISONS 26-1. Selec
- Page 169 and 170: TERRITORIAL COMPARISON 26-1. Select
- Page 171 and 172: Districts Prostějov Přerov Šumpe
- Page 173: TERRITORIAL COMPARISONS 26-1. Selec
- Page 177 and 178: Regions TERRITORIAL COMPARISONS 26-
- Page 179 and 180: 2. ÚZEMÍ A PODNEBÍ Úvodní tabu
- Page 181 and 182: organizace je alokována na základ
- Page 183 and 184: podniků do 20 zaměstnanců se zv
- Page 185 and 186: Průměrná hrubá měsíční mzda
- Page 187 and 188: které ČSÚ publikuje ve spoluprá
- Page 189 and 190: (sociální služby - zařízení,
- Page 191 and 192: METHODOLOGICAL NOTES The methodolog
- Page 193 and 194: of which is similar to that of muni
- Page 195 and 196: Data on prices of selected types of
- Page 197 and 198: the Ministry of Labour and Social A
- Page 199 and 200: Building permit means the building
- Page 201 and 202: Reporting units in the R&D statisti
- Page 203 and 204: The sickness insurance system of be
- Page 205 and 206: INFORMACE O KRAJI NA INTERNETU Na i
- Page 207 and 208: ZDROJE DAT PŘEVZATÝCH Z JINÝCH R
- Page 209 and 210: Statistická ročenka Olomouckého
- Page 211 and 212: Statistická ročenka Olomouckého
- Page 213 and 214: Statistická ročenka Olomouckého
- Page 215 and 216: Statistická ročenka Olomouckého
- Page 217 and 218: Statistická ročenka Olomouckého