Statistická ročenka Olomouckého kraje 2011 - Český statistický úřad
Statistická ročenka Olomouckého kraje 2011 - Český statistický úřad
Statistická ročenka Olomouckého kraje 2011 - Český statistický úřad

Create successful ePaper yourself
Turn your PDF publications into a flip-book with our unique Google optimized e-Paper software.
POPULATION<br />
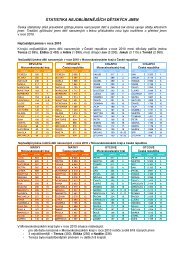
4-10. Selected demographic data by district in 2010<br />
Districts<br />
Prostějov Přerov Šumperk<br />
110 122 134 072 124 395 Mid-year population<br />
53 669 65 626 61 172 Males<br />
56 453 68 446 63 223 Females<br />
110 182 133 932 124 246 Population (as at 31 December)<br />
53 685 65 572 61 079 Males<br />
56 497 68 360 63 167 Females<br />
Population aged (as at 31 December)<br />
15 893 18 834 17 916 0–14<br />
76 174 93 237 87 104 15–64<br />
18 115 21 861 19 226 65 +<br />
Females aged<br />
7 845 9 219 8 673 0–14<br />
37 785 46 026 43 009 15–64<br />
10 867 13 115 11 485 65 +<br />
41,1 41,1 40,9 Average age of population (as at 31 December)<br />
39,6 39,5 39,4 Males<br />
42,6 42,7 42,4 Females<br />
114,0 116,1 107,3 Index of ageing (as at 31 December)<br />
90,1 91,0 83,7 Males<br />
138,5 142,3 132,4 Females<br />
Life expectancy at birth in 2006–2010<br />
73,88 73,32 73,5 Males<br />
79,47 79,81 80,1 Females<br />
432 554 487 Marriages<br />
326 344 318 Divorces<br />
1 192 1 416 1 315 Births, total<br />
1 189 1 415 1 313 Live births<br />
3 1 2 Stillbirths<br />
370 408 410 Abortions, total<br />
219 244 231 Induced abortions<br />
1 335 1 374 1 320 Deaths, total<br />
7 3 1 Infant deaths<br />
5 3 1 Neonatal deaths<br />
-146 41 -7 Natural increase<br />
1 082 1 144 911 Immigrants<br />
968 1 577 1 063 Emigrants<br />
114 -433 -152 Net migration<br />
-32 -392 -159 Total increase<br />
Per 1 000 mid-year population<br />
3,9 4,1 3,9 Marriages<br />
3,0 2,6 2,6 Divorces<br />
10,8 10,6 10,6 Live births<br />
3,4 3,0 3,3 Abortions<br />
12,1 10,2 10,6 Deaths<br />
-1,3 0,3 -0,1 Natural increase<br />
9,8 8,5 7,3 Immigrants<br />
8,8 11,8 8,5 Emigrants<br />
1,0 -3,2 -1,2 Net migration<br />
-0,3 -2,9 -1,3 Total increase<br />
75,5 62,1 65,3 Divorces per 100 marriages<br />
31,0 28,8 31,2 Abortions per 100 births<br />
18,4 17,2 17,6 Induced abortions per 100 births<br />
2,5 0,7 1,5 Stillbirth rate<br />
5,9 2,1 0,8 Infant mortality<br />
4,2 2,1 0,8 Neonatal mortality<br />
<strong>Statistická</strong> <strong>ročenka</strong> <strong>Olomouckého</strong> <strong>kraje</strong> <strong>2011</strong> 65