Energy - IUCN
Energy - IUCN
Energy - IUCN

Create successful ePaper yourself
Turn your PDF publications into a flip-book with our unique Google optimized e-Paper software.
4.2. Trends<br />
4.2.1. The Growing Demand for <strong>Energy</strong><br />
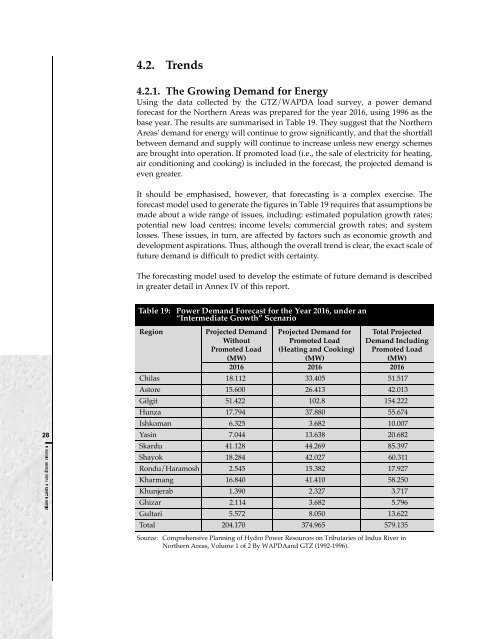
Using the data collected by the GTZ/WAPDA load survey, a power demand<br />
forecast for the Northern Areas was prepared for the year 2016, using 1996 as the<br />
base year. The results are summarised in Table 19. They suggest that the Northern<br />
Areas' demand for energy will continue to grow significantly, and that the shortfall<br />
between demand and supply will continue to increase unless new energy schemes<br />
are brought into operation. If promoted load (i.e., the sale of electricity for heating,<br />
air conditioning and cooking) is included in the forecast, the projected demand is<br />
even greater.<br />
It should be emphasised, however, that forecasting is a complex exercise. The<br />
forecast model used to generate the figures in Table 19 requires that assumptions be<br />
made about a wide range of issues, including: estimated population growth rates;<br />
potential new load centres; income levels; commercial growth rates; and system<br />
losses. These issues, in turn, are affected by factors such as economic growth and<br />
development aspirations. Thus, although the overall trend is clear, the exact scale of<br />
future demand is difficult to predict with certainty.<br />
The forecasting model used to develop the estimate of future demand is described<br />
in greater detail in Annex IV of this report.<br />
Table 19: Power Demand Forecast for the Year 2016, under an<br />
“Intermediate Growth” Scenario<br />
28<br />
Region Projected Demand Projected Demand for Total Projected<br />
Without Promoted Load Demand Including<br />
Promoted Load (Heating and Cooking) Promoted Load<br />
(MW) (MW) (MW)<br />
2016 2016 2016<br />
Chilas 18.112 33.405 51.517<br />
Astore 15.600 26.413 42.013<br />
Gilgit 51.422 102.8 154.222<br />
Hunza 17.794 37.880 55.674<br />
Ishkoman 6.325 3.682 10.007<br />
Yasin 7.044 13.638 20.682<br />
Skardu 41.128 44.269 85.397<br />
Shayok 18.284 42.027 60.311<br />
Rondu/Haramosh 2.545 15.382 17.927<br />
Kharmang 16.840 41.410 58.250<br />
Khunjerab 1.390 2.327 3.717<br />
Ghizar 2.114 3.682 5.796<br />
Gultari 5.572 8.050 13.622<br />
Total 204.170 374.965 579.135<br />
Source: Comprehensive Planning of Hydro Power Resources on Tributaries of Indus River in<br />
Northern Areas, Volume 1 of 2 By WAPDAand GTZ (1992-1996).