Energy - IUCN
Energy - IUCN
Energy - IUCN

Create successful ePaper yourself
Turn your PDF publications into a flip-book with our unique Google optimized e-Paper software.
elating to NA were consulted. Population growth rates used in various reports by<br />
WAPDA in connection with the planning of hydro-electric resources in the area<br />
were looked into. Discussion were held with the Planning and Development<br />
Department of Northern Areas and NAPWD officials. All investigations confirmed<br />
that growth rate to be adopted after 1981 census was on a lower side-compared to<br />
the inter-censal growth rate. Therefore, annual growth rates of 4.5 percent was used<br />
for A-1 load centres 3.5 percent for A, 3.2 percent for B and 2.8 percent for C<br />
category load centres.<br />
6.2.1.2. Annual Population Growth Rate<br />
The population growth rate is the main determining factor for future load<br />
development. As autonomous load is essentially the demand of power of the people<br />
in a locality, it is necessary to give the basis of growth rate to be adopted to estimate<br />
population over the planning horizon, which in this case comprises 16 years.<br />
Taking into consideration the Government policies, it is likely that in medium and<br />
long-range (10-20 years). The growth rate will decline. But future rates of growth<br />
can't be defined exactly and assumptions have to be made in order to make<br />
sensitivity analysis three alternative scenarios have to be considered.<br />
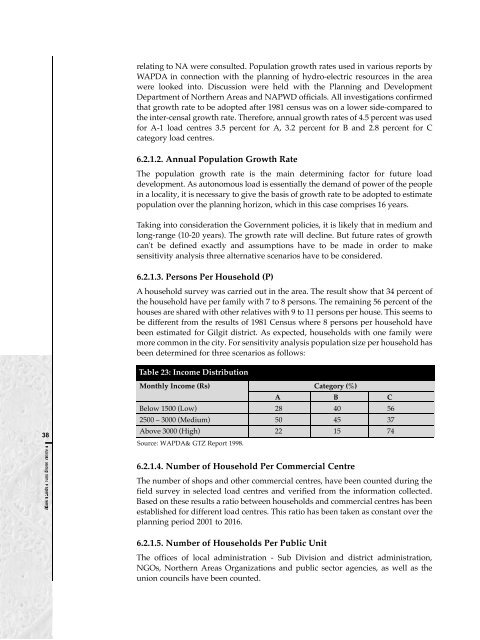
6.2.1.3. Persons Per Household (P)<br />
A household survey was carried out in the area. The result show that 34 percent of<br />
the household have per family with 7 to 8 persons. The remaining 56 percent of the<br />
houses are shared with other relatives with 9 to 11 persons per house. This seems to<br />
be different from the results of 1981 Census where 8 persons per household have<br />
been estimated for Gilgit district. As expected, households with one family were<br />
more common in the city. For sensitivity analysis population size per household has<br />
been determined for three scenarios as follows:<br />
Table 23: Income Distribution<br />
38<br />
Monthly Income (Rs) Category (%)<br />
A B C<br />
Below 1500 (Low) 28 40 56<br />
2500 – 3000 (Medium) 50 45 37<br />
Above 3000 (High) 22 15 74<br />
Source: WAPDA& GTZ Report 1998.<br />
6.2.1.4. Number of Household Per Commercial Centre<br />
The number of shops and other commercial centres, have been counted during the<br />
field survey in selected load centres and verified from the information collected.<br />
Based on these results a ratio between households and commercial centres has been<br />
established for different load centres. This ratio has been taken as constant over the<br />
planning period 2001 to 2016.<br />
6.2.1.5. Number of Households Per Public Unit<br />
The offices of local administration - Sub Division and district administration,<br />
NGOs, Northern Areas Organizations and public sector agencies, as well as the<br />
union councils have been counted.