Full Document: PDF 949KB - Te Puni Kokiri
Full Document: PDF 949KB - Te Puni Kokiri
Full Document: PDF 949KB - Te Puni Kokiri

Create successful ePaper yourself
Turn your PDF publications into a flip-book with our unique Google optimized e-Paper software.
are major employers in the manufacturing<br />
industry based in this district. Other large<br />
areas of employment for Mäori in this<br />
region included the retail trade, education,<br />
agriculture, forestry and fishing, construction,<br />
and health and community services industries.<br />
Table 10.12 shows Mäori and non-Mäori<br />
employment in the Bay of Plenty region broken<br />
down into eight occupation groups on census<br />
night 2006.<br />
49<br />
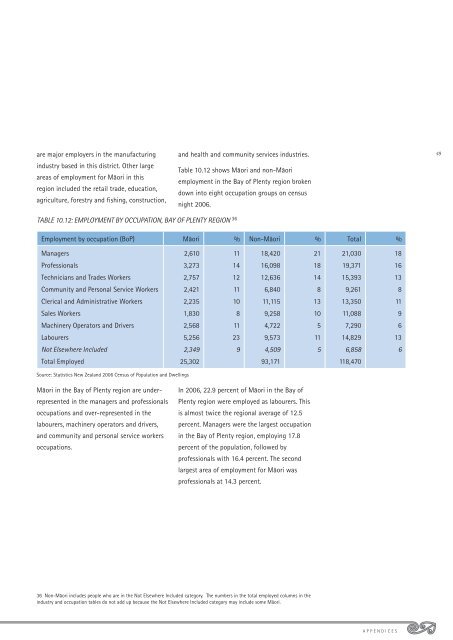
TABLE 10.12: EMPLOYMENT BY OCCUPATION, BAY OF PLENTY REGION 36<br />
Employment by occupation (BoP) Mäori % Non-Mäori % Total %<br />
Managers 2,610 11 18,420 21 21,030 18<br />
Professionals 3,273 14 16,098 18 19,371 16<br />
<strong>Te</strong>chnicians and Trades Workers 2,757 12 12,636 14 15,393 13<br />
Community and Personal Service Workers 2,421 11 6,840 8 9,261 8<br />
Clerical and Administrative Workers 2,235 10 11,115 13 13,350 11<br />
Sales Workers 1,830 8 9,258 10 11,088 9<br />
Machinery Operators and Drivers 2,568 11 4,722 5 7,290 6<br />
Labourers 5,256 23 9,573 11 14,829 13<br />
Not Elsewhere Included 2,349 9 4,509 5 6,858 6<br />
Total Employed 25,302 93,171 118,470<br />
Source: Statistics New Zealand 2006 Census of Population and Dwellings<br />
Mäori in the Bay of Plenty region are underrepresented<br />
in the managers and professionals<br />
occupations and over-represented in the<br />
labourers, machinery operators and drivers,<br />
and community and personal service workers<br />
occupations.<br />
In 2006, 22.9 percent of Mäori in the Bay of<br />
Plenty region were employed as labourers. This<br />
is almost twice the regional average of 12.5<br />
percent. Managers were the largest occupation<br />
in the Bay of Plenty region, employing 17.8<br />
percent of the population, followed by<br />
professionals with 16.4 percent. The second<br />
largest area of employment for Mäori was<br />
professionals at 14.3 percent.<br />
36 Non-Mäori includes people who are in the Not Elsewhere Included category. The numbers in the total employed columns in the<br />
industry and occupation tables do not add up because the Not Elsewhere Included category may include some Mäori.<br />
APPENDICES