Structural and optical properties of silver-doped zinc oxide sputtered ...
Structural and optical properties of silver-doped zinc oxide sputtered ...
Structural and optical properties of silver-doped zinc oxide sputtered ...

Create successful ePaper yourself
Turn your PDF publications into a flip-book with our unique Google optimized e-Paper software.
S.H. Jeong et al. / Surface & Coatings Technology 193 (2005) 340–344 341<br />
prepared with different weight percent (wt.%) <strong>of</strong> AgNO 3 in<br />
the targets: pure ZnO, 2 wt.% SZO, <strong>and</strong> 4 wt.% SZO.<br />
2.2. Deposition conditions<br />
The sputtering system was pumped down to 310 6<br />
Torr using turbo molecular pump. The working pressure<br />
which mainly consisted <strong>of</strong> a high-purity Ar(99.99%) gas<br />
was 32 mTorr. The glass substrates were cleaned in an<br />
ultrasonic cleaner for 10 min with acetone, alcohol, alkaline<br />
solution <strong>and</strong> then distilled water. All substrates were blown<br />
with dry nitrogen gas. ZnO films were deposited on the<br />
substrates at room temperature (RT) with rf power <strong>of</strong> 150 W<br />
after presputtering <strong>of</strong> the targets with Ar plasma for 5 min.<br />
Due to the practical applicability <strong>of</strong> SZO films, 150- to 200-<br />
nm-thick samples were typically prepared for <strong>optical</strong><br />
measurements. The crystal structure, microstructure, <strong>and</strong><br />
the thickness were observed using X-ray diffraction (XRD)<br />
<strong>and</strong> scanning electron microscope (SEM), respectively. X-<br />
ray photoelectron spectroscopy (XPS) was also utilized to<br />
analyze the chemical state <strong>of</strong> SZO films. The <strong>optical</strong><br />
transmittance measurements were performed with a UV/<br />
visible spectrophotometer. The oxygen K-edge features <strong>of</strong><br />
SZO films were also investigated using near-edge X-ray<br />
absorption fine structure (NEXAFS) spectroscopy.<br />
3. Results <strong>and</strong> discussion<br />
3.1. <strong>Structural</strong> characterization<br />
We investigated how the growth rate was related to<br />
deposition parameters, such as substrate temperature, target<br />
to substrate distance (D ts ), rf power, etc. Details <strong>of</strong> the ZnO<br />
growth have already been described in our previous papers<br />
[3,4].<br />
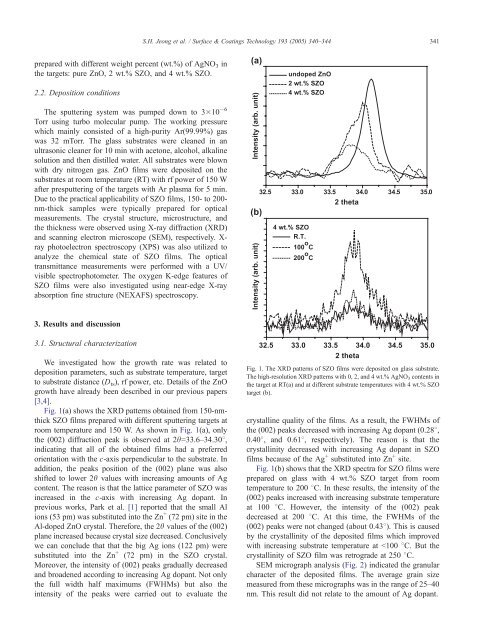
Fig. 1(a) shows the XRD patterns obtained from 150-nmthick<br />
SZO films prepared with different sputtering targets at<br />
room temperature <strong>and</strong> 150 W. As shown in Fig. 1(a), only<br />
the (002) diffraction peak is observed at 2h=33.6–34.308,<br />
indicating that all <strong>of</strong> the obtained films had a preferred<br />
orientation with the c-axis perpendicular to the substrate. In<br />
addition, the peaks position <strong>of</strong> the (002) plane was also<br />
shifted to lower 2h values with increasing amounts <strong>of</strong> Ag<br />
content. The reason is that the lattice parameter <strong>of</strong> SZO was<br />
increased in the c-axis with increasing Ag dopant. In<br />
previous works, Park et al. [1] reported that the small Al<br />
ions (53 pm) was substituted into the Zn + (72 pm) site in the<br />
Al-<strong>doped</strong> ZnO crystal. Therefore, the 2h values <strong>of</strong> the (002)<br />
plane increased because crystal size decreased. Conclusively<br />
we can conclude that that the big Ag ions (122 pm) were<br />
substituted into the Zn + (72 pm) in the SZO crystal.<br />
Moreover, the intensity <strong>of</strong> (002) peaks gradually decreased<br />
<strong>and</strong> broadened according to increasing Ag dopant. Not only<br />
the full width half maximums (FWHMs) but also the<br />
intensity <strong>of</strong> the peaks were carried out to evaluate the<br />
Fig. 1. The XRD patterns <strong>of</strong> SZO films were deposited on glass substrate.<br />
The high-resolution XRD patterns with 0, 2, <strong>and</strong> 4 wt.% AgNO 3 contents in<br />
the target at RT(a) <strong>and</strong> at different substrate temperatures with 4 wt.% SZO<br />
target (b).<br />
crystalline quality <strong>of</strong> the films. As a result, the FWHMs <strong>of</strong><br />
the (002) peaks decreased with increasing Ag dopant (0.288,<br />
0.408, <strong>and</strong> 0.618, respectively). The reason is that the<br />
crystallinity decreased with increasing Ag dopant in SZO<br />
films because <strong>of</strong> the Ag + substituted into Zn + site.<br />
Fig. 1(b) shows that the XRD spectra for SZO films were<br />
prepared on glass with 4 wt.% SZO target from room<br />
temperature to 200 8C. In these results, the intensity <strong>of</strong> the<br />
(002) peaks increased with increasing substrate temperature<br />
at 100 8C. However, the intensity <strong>of</strong> the (002) peak<br />
decreased at 200 8C. At this time, the FWHMs <strong>of</strong> the<br />
(002) peaks were not changed (about 0.438). This is caused<br />
by the crystallinity <strong>of</strong> the deposited films which improved<br />
with increasing substrate temperature at b100 8C. But the<br />
crystallinity <strong>of</strong> SZO film was retrograde at 250 8C.<br />
SEM micrograph analysis (Fig. 2) indicated the granular<br />
character <strong>of</strong> the deposited films. The average grain size<br />
measured from these micrographs was in the range <strong>of</strong> 25–40<br />
nm. This result did not relate to the amount <strong>of</strong> Ag dopant.