Avocet Mining PLC Prospectus December 2011
Avocet Mining PLC Prospectus December 2011
Avocet Mining PLC Prospectus December 2011

Create successful ePaper yourself
Turn your PDF publications into a flip-book with our unique Google optimized e-Paper software.
c105718pu065 Proof 5: 7.12.11_13:43 B/L Revision:<br />
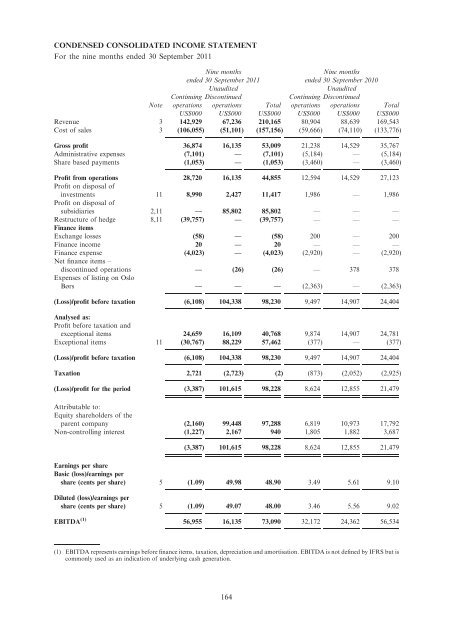
CONDENSED CONSOLIDATED INCOME STATEMENT<br />
For the nine months ended 30 September <strong>2011</strong><br />
Nine months<br />
ended 30 September <strong>2011</strong><br />
Unaudited<br />
Continuing Discontinued<br />
Nine months<br />
ended 30 September 2010<br />
Unaudited<br />
Continuing Discontinued<br />
Note operations operations Total operations operations Total<br />
US$000 US$000 US$000 US$000 US$000 US$000<br />
Revenue 3 142,929 67,236 210,165 80,904 88,639 169,543<br />
Cost of sales 3 (106,055) (51,101) (157,156) (59,666) (74,110) (133,776)<br />
Gross profit 36,874 16,135 53,009 21,238 14,529 35,767<br />
Administrative expenses (7,101) — (7,101) (5,184) — (5,184)<br />
Share based payments (1,053) — (1,053) (3,460) — (3,460)<br />
Profit from operations 28,720 16,135 44,855 12,594 14,529 27,123<br />
Profit on disposal of<br />
investments 11 8,990 2,427 11,417 1,986 — 1,986<br />
Profit on disposal of<br />
subsidiaries 2,11 — 85,802 85,802 — — —<br />
Restructure of hedge 8,11 (39,757) — (39,757) — — —<br />
Finance items<br />
Exchange losses (58) — (58) 200 — 200<br />
Finance income 20 — 20 — — —<br />
Finance expense (4,023) — (4,023) (2,920) — (2,920)<br />
Net finance items –<br />
discontinued operations — (26) (26) — 378 378<br />
Expenses of listing on Oslo<br />
Børs — — — (2,363) — (2,363)<br />
(Loss)/profit before taxation (6,108) 104,338 98,230 9,497 14,907 24,404<br />
Analysed as:<br />
Profit before taxation and<br />
exceptional items 24,659 16,109 40,768 9,874 14,907 24,781<br />
Exceptional items 11 (30,767) 88,229 57,462 (377) — (377)<br />
(Loss)/profit before taxation (6,108) 104,338 98,230 9,497 14,907 24,404<br />
Taxation 2,721 (2,723) (2) (873) (2,052) (2,925)<br />
(Loss)/profit for the period (3,387) 101,615 98,228 8,624 12,855 21,479<br />
Attributable to:<br />
Equity shareholders of the<br />
parent company (2,160) 99,448 97,288 6,819 10,973 17,792<br />
Non-controlling interest (1,227) 2,167 940 1,805 1,882 3,687<br />
(3,387) 101,615 98,228 8,624 12,855 21,479<br />
Earnings per share<br />
Basic (loss)/earnings per<br />
share (cents per share) 5 (1.09) 49.98 48.90 3.49 5.61 9.10<br />
Diluted (loss)/earnings per<br />
share (cents per share) 5 (1.09) 49.07 48.00 3.46 5.56 9.02<br />
EBITDA (1) 56,955 16,135 73,090 32,172 24,362 56,534<br />
(1) EBITDA represents earnings before finance items, taxation, depreciation and amortisation. EBITDA is not defined by IFRS but is<br />
commonly used as an indication of underlying cash generation.<br />
164