Avocet Mining PLC Prospectus December 2011
Avocet Mining PLC Prospectus December 2011
Avocet Mining PLC Prospectus December 2011

Create successful ePaper yourself
Turn your PDF publications into a flip-book with our unique Google optimized e-Paper software.
c105718pu040 Proof 5: 7.12.11_13:40 B/L Revision:<br />
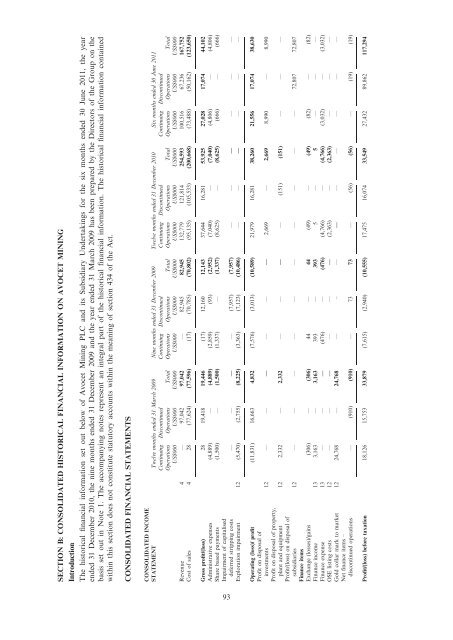
SECTION B: CONSOLIDATED HISTORICAL FINANCIAL INFORMATION ON AVOCET MINING<br />
Introduction<br />
The historical financial information set out below of <strong>Avocet</strong> <strong>Mining</strong> <strong>PLC</strong> and its Subsidiary Undertakings for the six months ended 30 June <strong>2011</strong>, the year<br />
ended 31 <strong>December</strong> 2010, the nine months ended 31 <strong>December</strong> 2009 and the year ended 31 March 2009 has been prepared by the Directors of the Group on the<br />
basis set out in Note 1. The accompanying notes represent an integral part of the historical financial information. The historical financial information contained<br />
within this section does not constitute statutory accounts within the meaning of section 434 of the Act.<br />
CONSOLIDATED FINANCIAL STATEMENTS<br />
CONSOLIDATED INCOME<br />
STATEMENT Twelve months ended 31 March 2009 Nine months ended 31 <strong>December</strong> 2009 Twelve months ended 31 <strong>December</strong> 2010 Six months ended 30 June <strong>2011</strong><br />
Continuing<br />
Operations<br />
Discontinued<br />
Operations Total<br />
Continuing<br />
Operations<br />
Discontinued<br />
Operations Total<br />
Continuing<br />
Operations<br />
Discontinued<br />
Operations Total<br />
Continuing<br />
Operations<br />
Discontinued<br />
Operations Total<br />
US$000 US$000 US$000 US$000 US$000 US$000 US$000 US$000 US$000 US$000 US$000 US$000<br />
Revenue 4 — 97,042 97,042 — 82,945 82,945 132,779 121,814 254,593 100,516 67,236 167,752<br />
Cost of sales 4 28 (77,624) (77,596) (17) (70,785) (70,802) (95,135) (105,533) (200,668) (73,488) (50,162) (123,650)<br />
Gross profit/(loss) 28 19,418 19,446 (17) 12,160 12,143 37,644 16,281 53,925 27,028 17,074 44,102<br />
Administrative expenses (4,889) — (4,889) (2,859) (93) (2,952) (7,040) — (7,040) (4,806) — (4,806)<br />
Share based payments (1,500) — (1,500) (1,337) — (1,337) (8,625) — (8,625) (666) — (666)<br />
Impairment of capitalised<br />
deferred stripping costs — — — — (7,957) (7,957) — — — — — —<br />
Exploration impairment 12 (5,470) (2,755) (8,225) (3,363) (7,123) (10,486) — — — — — —<br />
Operating (loss)/ profit (11,831) 16,663 4,832 (7,576) (3,013) (10,589) 21,979 16,281 38,260 21,556 17,074 38,630<br />
Profit on disposal of<br />
investments 12 — — — — — — 2,669 — 2,669 8,990 — 8,990<br />
Profit on disposal of property,<br />
plant and equipment 12 2,332 — 2,332 — — — — (151) (151) — — —<br />
Profit/(loss) on disposal of<br />
subsidiaries 12 — — — — — — — — — — 72,807 72,807<br />
Finance items<br />
Exchange (losses)/gains (306) — (306) 44 — 44 (49) — (49) (82) — (82)<br />
Finance income 13 3,163 — 3,163 393 — 393 5 — 5 — — —<br />
Finance expense 13 — — — (476) — (476) (4,766) — (4,766) (3,032) — (3,032)<br />
OSE listing costs 12 — — — — — — (2,363) — (2,363) — — —<br />
Gold collar mark to market 12 24,768 — 24,768 — – — — — — — — —<br />
Net finance items –<br />
discontinued operations — (910) (910) — 73 73 — (56) (56) — (19) (19)<br />
Profit/(loss) before taxation 18,126 15,753 33,879 (7,615) (2,940) (10,555) 17,475 16,074 33,549 27,432 89,862 117,294<br />
93