NOTICE OF MEETING AND AGENDA - Metro Transit
NOTICE OF MEETING AND AGENDA - Metro Transit
NOTICE OF MEETING AND AGENDA - Metro Transit

You also want an ePaper? Increase the reach of your titles
YUMPU automatically turns print PDFs into web optimized ePapers that Google loves.
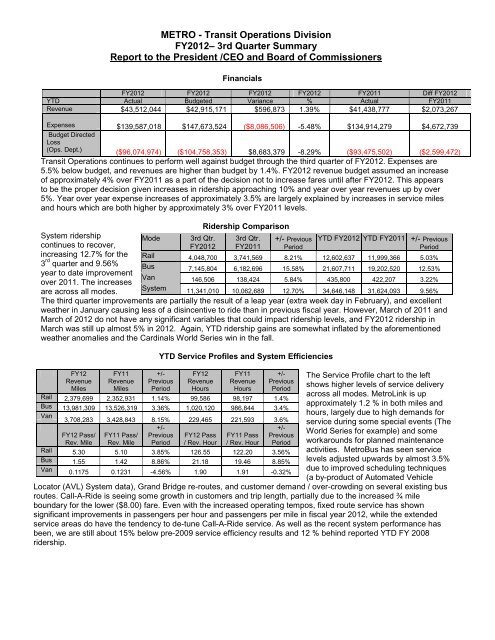
METRO - <strong>Transit</strong> Operations Division<br />
FY2012– 3rd Quarter Summary<br />
Report to the President /CEO and Board of Commissioners<br />
Financials<br />
FY2012 FY2012 FY2012 FY2012 FY2011 Diff FY2012<br />
YTD Actual Budgeted Variance % Actual FY2011<br />
Revenue $43,512,044 $42,915,171 $596,873 1.39% $41,438,777 $2,073,267<br />
Expenses $139,587,018 $147,673,524 ($8,086,506) -5.48% $134,914,279 $4,672,739<br />
Budget Directed<br />
Loss<br />
(Ops. Dept.) ($96,074,974) ($104,758,353) $8,683,379 -8.29% ($93,475,502) ($2,599,472)<br />
<strong>Transit</strong> Operations continues to perform well against budget through the third quarter of FY2012. Expenses are<br />
5.5% below budget, and revenues are higher than budget by 1.4%. FY2012 revenue budget assumed an increase<br />
of approximately 4% over FY2011 as a part of the decision not to increase fares until after FY2012. This appears<br />
to be the proper decision given increases in ridership approaching 10% and year over year revenues up by over<br />
5%. Year over year expense increases of approximately 3.5% are largely explained by increases in service miles<br />
and hours which are both higher by approximately 3% over FY2011 levels.<br />
Ridership Comparison<br />
System ridership<br />
Mode 3rd Qtr. 3rd Qtr. +/- Previous YTD FY2012 YTD FY2011 +/- Previous<br />
continues to recover,<br />
FY2012 FY2011 Period<br />
Period<br />
increasing 12.7% for the Rail<br />
3 rd 4,048,700 3,741,569 8.21% 12,602,637 11,999,366 5.03%<br />
quarter and 9.56% Bus 7,145,804 6,182,696 15.58% 21,607,711 19,202,520 12.53%<br />
year to date improvement<br />
Van<br />
over 2011. The increases<br />
146,506 138,424 5.84% 435,800 422,207 3.22%<br />
are across all modes.<br />
System 11,341,010 10,062,689 12.70% 34,646,148 31,624,093 9.56%<br />
The third quarter improvements are partially the result of a leap year (extra week day in February), and excellent<br />
weather in January causing less of a disincentive to ride than in previous fiscal year. However, March of 2011 and<br />
March of 2012 do not have any significant variables that could impact ridership levels, and FY2012 ridership in<br />
March was still up almost 5% in 2012. Again, YTD ridership gains are somewhat inflated by the aforementioned<br />
weather anomalies and the Cardinals World Series win in the fall.<br />
FY12<br />
Revenue<br />
Miles<br />
FY11<br />
Revenue<br />
Miles<br />
YTD Service Profiles and System Efficiencies<br />
+/-<br />
Previous<br />
Period<br />
FY12<br />
Revenue<br />
Hours<br />
FY11<br />
Revenue<br />
Hours<br />
+/-<br />
Previous<br />
Period<br />
Rail 2,379,699 2,352,931 1.14% 99,586 98,197 1.4%<br />
Bus 13,981,309 13,526,319 3.36% 1,020,120 986,844 3.4%<br />
Van<br />
3,708,283 3,428,843 8.15% 229,465 221,593 3.6%<br />
FY12 Pass/<br />
Rev. Mile<br />
FY11 Pass/<br />
Rev. Mile<br />
+/-<br />
Previous<br />
Period<br />
FY12 Pass<br />
/ Rev. Hour<br />
FY11 Pass<br />
/ Rev. Hour<br />
+/-<br />
Previous<br />
Period<br />
Rail 5.30 5.10 3.85% 126.55 122.20 3.56%<br />
Bus 1.55 1.42 8.86% 21.18 19.46 8.85%<br />
Van 0.1175 0.1231 -4.56% 1.90 1.91 -0.32%<br />
The Service Profile chart to the left<br />
shows higher levels of service delivery<br />
across all modes. <strong>Metro</strong>Link is up<br />
approximately 1.2 % in both miles and<br />
hours, largely due to high demands for<br />
service during some special events (The<br />
World Series for example) and some<br />
workarounds for planned maintenance<br />
activities. <strong>Metro</strong>Bus has seen service<br />
levels adjusted upwards by almost 3.5%<br />
due to improved scheduling techniques<br />
(a by-product of Automated Vehicle<br />
Locator (AVL) System data), Grand Bridge re-routes, and customer demand / over-crowding on several existing bus<br />
routes. Call-A-Ride is seeing some growth in customers and trip length, partially due to the increased ¾ mile<br />
boundary for the lower ($8.00) fare. Even with the increased operating tempos, fixed route service has shown<br />
significant improvements in passengers per hour and passengers per mile in fiscal year 2012, while the extended<br />
service areas do have the tendency to de-tune Call-A-Ride service. As well as the recent system performance has<br />
been, we are still about 15% below pre-2009 service efficiency results and 12 % behind reported YTD FY 2008<br />
ridership.