NOTICE OF MEETING AND AGENDA - Metro Transit
NOTICE OF MEETING AND AGENDA - Metro Transit
NOTICE OF MEETING AND AGENDA - Metro Transit

Create successful ePaper yourself
Turn your PDF publications into a flip-book with our unique Google optimized e-Paper software.
YTD FY2012 FY2011 +/-<br />
Arrests – <strong>Metro</strong>Bus<br />
15 16 -6.25%<br />
Arrests – <strong>Metro</strong>Link<br />
834 766 8.88%<br />
Summons - <strong>Metro</strong>Bus<br />
42 28 50.00%<br />
Summons - <strong>Metro</strong>Link<br />
1763 1358 29.82%<br />
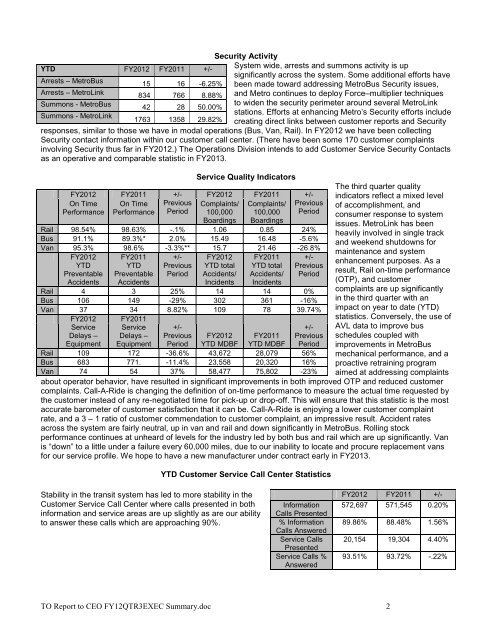
Security Activity<br />
System wide, arrests and summons activity is up<br />
significantly across the system. Some additional efforts have<br />
been made toward addressing <strong>Metro</strong>Bus Security issues,<br />
and <strong>Metro</strong> continues to deploy Force–multiplier techniques<br />
to widen the security perimeter around several <strong>Metro</strong>Link<br />
stations. Efforts at enhancing <strong>Metro</strong>’s Security efforts include<br />
creating direct links between customer reports and Security<br />
responses, similar to those we have in modal operations (Bus, Van, Rail). In FY2012 we have been collecting<br />
Security contact information within our customer call center. (There have been some 170 customer complaints<br />
involving Security thus far in FY2012.) The Operations Division intends to add Customer Service Security Contacts<br />
as an operative and comparable statistic in FY2013.<br />
FY2012 FY2011 +/-<br />
On Time<br />
Performance<br />
On Time<br />
Performance<br />
Previous<br />
Period<br />
Service Quality Indicators<br />
FY2012<br />
Complaints/<br />
100,000<br />
FY2011<br />
Complaints/<br />
100,000<br />
+/-<br />
Previous<br />
Period<br />
Boardings Boardings<br />
Rail 98.54% 98.63% -.1% 1.06 0.85 24%<br />
Bus 91.1% 89.3%* 2.0% 15.49 16.48 -5.6%<br />
Van 95.3% 98.6% -3.3%** 15.7 21.46 -26.8%<br />
FY2012<br />
YTD<br />
Preventable<br />
Accidents<br />
FY2011<br />
YTD<br />
Preventable<br />
Accidents<br />
+/-<br />
Previous<br />
Period<br />
FY2012<br />
YTD total<br />
Accidents/<br />
Incidents<br />
FY2011<br />
YTD total<br />
Accidents/<br />
Incidents<br />
+/-<br />
Previous<br />
Period<br />
Rail 4 3 25% 14 14 0%<br />
Bus 106 149 -29% 302 361 -16%<br />
Van 37 34 8.82% 109 78 39.74%<br />
FY2012<br />
Service<br />
Delays –<br />
Equipment<br />
FY2011<br />
Service<br />
Delays –<br />
Equipment<br />
+/-<br />
Previous<br />
Period<br />
+/-<br />
Previous<br />
Period<br />
FY2012<br />
YTD MDBF<br />
FY2011<br />
YTD MDBF<br />
Rail 109 172 -36.6% 43,672 28,079 56%<br />
Bus 683 771. -11.4% 23,558 20,320 16%<br />
Van 74 54 37% 58,477 75,802 -23%<br />
The third quarter quality<br />
indicators reflect a mixed level<br />
of accomplishment, and<br />
consumer response to system<br />
issues. <strong>Metro</strong>Link has been<br />
heavily involved in single track<br />
and weekend shutdowns for<br />
maintenance and system<br />
enhancement purposes. As a<br />
result, Rail on-time performance<br />
(OTP), and customer<br />
complaints are up significantly<br />
in the third quarter with an<br />
impact on year to date (YTD)<br />
statistics. Conversely, the use of<br />
AVL data to improve bus<br />
schedules coupled with<br />
improvements in <strong>Metro</strong>Bus<br />
mechanical performance, and a<br />
proactive retraining program<br />
aimed at addressing complaints<br />
about operator behavior, have resulted in significant improvements in both improved OTP and reduced customer<br />
complaints. Call-A-Ride is changing the definition of on-time performance to measure the actual time requested by<br />
the customer instead of any re-negotiated time for pick-up or drop-off. This will ensure that this statistic is the most<br />
accurate barometer of customer satisfaction that it can be. Call-A-Ride is enjoying a lower customer complaint<br />
rate, and a 3 – 1 ratio of customer commendation to customer complaint, an impressive result. Accident rates<br />
across the system are fairly neutral, up in van and rail and down significantly in <strong>Metro</strong>Bus. Rolling stock<br />
performance continues at unheard of levels for the industry led by both bus and rail which are up significantly. Van<br />
is “down” to a little under a failure every 60,000 miles, due to our inability to locate and procure replacement vans<br />
for our service profile. We hope to have a new manufacturer under contract early in FY2013.<br />
YTD Customer Service Call Center Statistics<br />
Stability in the transit system has led to more stability in the<br />
Customer Service Call Center where calls presented in both<br />
information and service areas are up slightly as are our ability<br />
to answer these calls which are approaching 90%.<br />
Information<br />
Calls Presented<br />
% Information<br />
Calls Answered<br />
Service Calls<br />
Presented<br />
Service Calls %<br />
Answered<br />
FY2012 FY2011 +/-<br />
572,697 571,545 0.20%<br />
89.86% 88.48% 1.56%<br />
20,154 19,304 4.40%<br />
93.51% 93.72% -.22%<br />
TO Report to CEO FY12QTR3EXEC Summary.doc 2