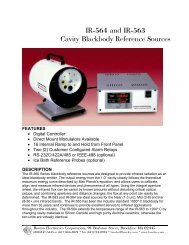
Time Correlated Single Photon Counting Systems - Boston ...
Time Correlated Single Photon Counting Systems - Boston ...
Time Correlated Single Photon Counting Systems - Boston ...

Create successful ePaper yourself
Turn your PDF publications into a flip-book with our unique Google optimized e-Paper software.
<strong>Boston</strong> Electronics Corporation<br />
91 Boylston Street, Brookline MA 02445 USA<br />
(800)347-5445 or (617)566-3821 fax (617)731-0935<br />
www.boselec.com boselec@world.std.com<br />
<strong>Time</strong> <strong>Correlated</strong><br />
<strong>Single</strong> <strong>Photon</strong><br />
<strong>Counting</strong> <strong>Systems</strong><br />
The Becker & Hickl<br />
SPC-series Module Family<br />
PC Based<br />
<strong>Systems</strong><br />
i n t e l l i g e n t<br />
measurement<br />
and<br />
control systems<br />
Becker & Hickl GmbH<br />
Nahmitzer Damm 30<br />
12277 Berlin, Germany<br />
Tel. +49 30 787 56 32<br />
Fax. +49 30 787 57 34<br />
www.becker-hickl.de<br />
info@becker-hickl.de
<strong>Boston</strong> Electronics Corporation, 91 Boylston St, Brookline MA 02445 USA * (800)3477-5445 or (617)566-3821 * fax (617731-0935 * tcspc@boselec.com<br />
Target Application<br />
SPC-630 SPC-730 SPC-830 SPC-134 <strong>Time</strong> Harp 200<br />
Standard lifetime experiments<br />
<strong>Single</strong> Molecule Detection<br />
Stopped Flow<br />
Correlation Experiments<br />
FCS Experiments<br />
Standard lifetime experiments,<br />
Lifetime imaging, Confocal<br />
and two-photon scanning<br />
Microscopy<br />
Multi parameter experiments<br />
Stopped Flow<br />
Standard lifetime experiments,<br />
Lifetime imaging, Confocal<br />
and two-photon scanning<br />
Microscopy<br />
Multi parameter experiments<br />
Stopped Flow<br />
<strong>Single</strong> Molecule Detection<br />
Correlation Experiments<br />
FCS Experiments<br />
Optical tomography<br />
<strong>Single</strong> Molecule<br />
Stopped Flow<br />
Correlation Experiments<br />
FCS Experiments<br />
No. of TCSPC Channels 1 1 1 4 1<br />
Modules operable in parallel 4 x SPC-630 4 x SPC-730 4 x SPC-830 1 x SPC-134<br />
TAC - ADC with error<br />
reduction<br />
TAC - ADC with error<br />
reduction<br />
TAC - ADC with error<br />
reduction<br />
TAC - ADC with error<br />
reduction<br />
Standard lifetime<br />
<strong>Single</strong> Molecule<br />
Microscope with scan stage<br />
Correlation Experiments<br />
FCS Experiments<br />
Conversion Principle<br />
<strong>Time</strong>-to-Digital Converter<br />
Patent DE 43 39 784 A1 Patent DE 43 39 784 A1 Patent DE 43 39 784 A1 Patent DE 43 39 784 A1<br />
Detector Channel<br />
Constant Fraction<br />
Constant Fraction<br />
Constant Fraction<br />
Constant Fraction<br />
Constant Fraction<br />
Sync Channel<br />
Constant Fraction<br />
Constant Fraction<br />
Constant Fraction<br />
Constant Fraction<br />
Level Trigger<br />
<strong>Time</strong> Resolution 820 fs per time channel 820 fs per time channel 820 fs per time channel 820 fs per time channel 40 ps per time channel<br />
Diff. nonlinearity 0.6% to 1% pp,
<strong>Boston</strong> Electronics Corporation, 91 Boylston St, Brookline MA 02445 USA * (800)3477-5445 or (617)566-3821 * fax (617731-0935 * tcspc@boselec.com<br />
Available multi-detector<br />
extension devices for<br />
Operating Modes<br />
SPC-630 SPC-730 SPC-830 SPC-134 <strong>Time</strong> Harp 200<br />
4 MCPs, 4 PMTs<br />
8 MCPs, 8 PMTs<br />
8 APDs<br />
16 channel pmt head<br />
<strong>Single</strong><br />
Oscilloscope<br />
2 dimensional f(xyt)<br />
Sequence f(t,T), fi(t,ext)<br />
Spectrum fi(T), fi(ext)<br />
Continuous Flow (unlimited<br />
seq.)<br />
<strong>Time</strong> Tag (FIFO)<br />
4 MCPs, 4 PMTs<br />
8 MCPs, 8 PMTs<br />
8 APDs<br />
16 channel pmt head<br />
<strong>Single</strong><br />
Oscilloscope<br />
2 dimensional f(xyt)<br />
Sequence f(t,T), fi(t,ext)<br />
Spectrum fi(T), fi(ext)<br />
Imaging (Sync In, Sync Out,<br />
XY in, XY out)<br />
4 MCPs, 4 PMTs<br />
8 MCPs, 8 PMTs<br />
8 APDs<br />
16 channel pmt head<br />
<strong>Single</strong><br />
Oscilloscope<br />
2 dimensional f(xyt)<br />
Sequence f(t,T), fi(t,ext)<br />
Spectrum fi(T), fi(ext)<br />
Imaging (Sync In, Sync Out,<br />
XY in)<br />
<strong>Time</strong> Tag (FIFO)<br />
4 MCPs, 4 PMTs<br />
8 MCPs, 8 PMTs<br />
8 APDs<br />
<strong>Single</strong><br />
Oscilloscope<br />
2 dimensional f(xyt)<br />
Sequence f(t,T), fi(t,ext)<br />
Spectrum fi(T), fi(ext)<br />
Continuous Flow (unlimited<br />
seq.)<br />
<strong>Time</strong> Tag (FIFO)<br />
4 APDs<br />
Integration<br />
Oscilloscope<br />
Sequence f(t,T)<br />
Contiuous<br />
<strong>Time</strong>-tag (Option)<br />
Experiment Trigger<br />
Triggered accumulation of<br />
sequences<br />
Detector / Experiment control<br />
(Own products only)<br />
Free Documentaion available<br />
on web site<br />
Related Products<br />
(Own products only)<br />
Start of measurement<br />
Start of sequence<br />
Each step of sequence<br />
Start of measurement<br />
Start of sequence<br />
Each step of sequence<br />
Frame Clock, Line Clock, Pxl<br />
Clock<br />
Start of measurement<br />
Start of sequence<br />
Each step of sequence<br />
Frame Clock, Line Clock, Pxl<br />
Clock<br />
Start of measurement<br />
Start of sequence<br />
Each step of sequence<br />
yes yes yes yes<br />
Preamplifiers with detector<br />
overload protection, PMH-100<br />
Detector modules, PML-16<br />
multichannel detector head,<br />
DCC-100 Detector Controller ,<br />
STP-340 Step Motor<br />
Controller,<br />
Routers for MCPs, PMTs,<br />
APDs, Dual ADC module for<br />
XY In operation<br />
Preamplifiers with detector<br />
overload protection, PMH-100<br />
Detector modules, PML-16<br />
multichannel detector head,<br />
DCC-100 Detector Controller ,<br />
STP-340 Step Motor<br />
Controller,<br />
Routers for MCPs, PMTs,<br />
APDs, Dual ADC module for<br />
XY In operation, Adapters for<br />
Zeiss, Leica, Olympus and<br />
Biorad laser scanning<br />
microscopes<br />
Preamplifiers with detector<br />
overload protection, PMH-100<br />
Detector modules, PML-16<br />
multichannel detector head,<br />
DCC-100 Detector Controller ,<br />
STP-340 Step Motor<br />
Controller,<br />
Routers for MCPs, PMTs,<br />
APDs<br />
SPC Manual, 165 pages; TCSPC Introduction, 5 pages; Upgrading laser scanning microscopes for lifetime imaging; Controlling SPC<br />
modules; Protecting Photomultipliers; FRET measurements by TCSPC lifetime microscopy; Multi-wavelengthe TCSPC lifetime<br />
imaging; High count rate multichannel TCSPC for optical tomography; Optical Tomography: TCSPC Imaging of Female Breast;<br />
Setting up High Gain Detector Electronics for TCSPC Applications; Testing SPC Modules; 16 Channel Detector Head for TCSPC<br />
Modules; Routing Modules for <strong>Time</strong>-<strong>Correlated</strong> <strong>Single</strong> <strong>Photon</strong> <strong>Counting</strong>; Detector Control Module DCC100 Manual; TCSPC<br />
Software is available and FREE; Manual: Multi - SPC 32 bit Dynamic Link Library<br />
SPC-300, SPC-330 TCSPC; SPC-400, SPC-430 TCSPC; SPC-500, SPC-530 TCSPC; MSA-100 1ns multiscaler; MSA-300 5ns<br />
multisclaer; PMS-400 and PMM-328 Gated photon counters / multiscalers; Picosecond Diode Lasers<br />
Start of measurement<br />
Start of sequence<br />
Preamplifiers with detector<br />
overload protection, Routers<br />
for APDs<br />
Measurement examples<br />
<strong>Time</strong> Harp 100<br />
Picosecond Diode Lasers<br />
03/21/2003 Q:\Product Literature\Becker Hickl\Comparison SPC- & <strong>Time</strong>Harp.doc
The TCSPC Microscopy Solution<br />
SPC-830<br />
High Resolution <strong>Time</strong>-<strong>Correlated</strong> <strong>Single</strong> <strong>Photon</strong> <strong>Counting</strong> Imaging<br />
and FCS Module for Laser Scanning Microscopes<br />
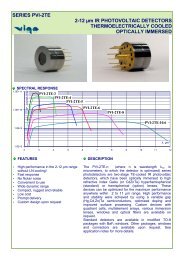
♦ Complete picosecond imaging system on single PC board<br />
♦ Picosecond resolution<br />
♦ Ultra-high sensitivity<br />
♦ Multi detector capability<br />
♦ High-speed on-board data acquisition<br />
♦ Works at any scanning speed of microscope<br />
♦ High resolution picosecond lifetime imaging<br />
♦ FRET imaging<br />
♦ High-resolution steady state imaging<br />
♦ <strong>Single</strong>-point time-lapse lifetime analysis<br />
♦ <strong>Single</strong>-point FCS / lifetime data<br />
♦ <strong>Time</strong> channel width down to 813 fs<br />
♦ Image size up to 4096 x 4096 pixels<br />
♦ Electrical time resolution down to 8 ps fwhm / 4 ps rms<br />
♦ Reversed start/stop: Laser repetition rates up to 200 MHz<br />
♦ Useful count rate up to 4 MHz - dead time 125 ns<br />
♦ Active and passive scanning control<br />
♦ Software versions for windows 95 / 98 / 2000 / NT<br />
0.3 Lifetime, ns 1.2<br />
CFP/YFP FRET<br />
0.5 FRET Intensity 2.0<br />
Becker & Hickl GmbH<br />
Nahmitzer Damm 30<br />
12277 Berlin, Berlin<br />
Tel. +49 / 30 / 787 56 32<br />
Fax. +49 / 30 / 787 57 34<br />
email: info@becker-hickl.com<br />
www.becker-hickl.com<br />
US Representative:<br />
<strong>Boston</strong> Electronics Corp<br />
tcspc@boselec.com<br />
www.boselec.com<br />
UK Representative:<br />
<strong>Photon</strong>ic Solutions PLC<br />
sales@psplc.com<br />
www.psplc.com<br />
Covered by patents DE 43 39 784 A1 and DE 43 39 787
The TCSPC Microscopy Solution<br />
SPC-830<br />
<strong>Photon</strong> Channel<br />
Principle<br />
Constant Fraction Discriminator<br />
<strong>Time</strong> Resolution (FWHM / RMS, electr.)<br />
7 ps / 4 ps<br />
Opt. Input Voltage Range<br />
- 50 mV to - 1 V<br />
Min. Input Pulse Width<br />
400 ps<br />
Lower Threshold<br />
- 20 mV to - 500 mV<br />
Zero Cross Adjust<br />
- 100 mV to + 100 mV<br />
Synchronisation Channel<br />
Principle<br />
Constant Fraction Discriminator<br />
Opt. Input Voltage Range<br />
- 50 mV to - 1 V<br />
Min. Input Pulse Width<br />
400 ps<br />
Threshold<br />
- 20 mV to -500 mV<br />
Frequency Range<br />
0 to 200 MHz<br />
Frequency Divider 1-2-4-8-16<br />
Zero Cross Adjust<br />
-100 mV to + 100 mV<br />
<strong>Time</strong>-to-Amplitude Converter / ADC<br />
Principle<br />
Ramp Generator / Biased Amplifier<br />
TAC Range<br />
50 ns to 2 us<br />
Biased Amplifier Gain 1 to 15<br />
Biased Amplifier Offset<br />
0 to 100% of TAC Range<br />
<strong>Time</strong> Range incl. Biased Amplifier<br />
3.3 ns to 2 us<br />
min. <strong>Time</strong> / Channel<br />
813 fs<br />
TAC Window Discriminator<br />
Any Window inside TAC Range<br />
ADC Principle<br />
50 ns 12 bit Flash ADC with Error Correction<br />
Diff. Nonlinearity (dith width 1/8, 90% of TAC range)<br />
< 0.5% rms, typically
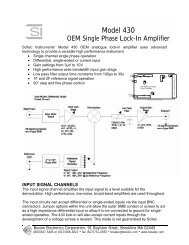
The TCSPC Power Package<br />
SPC-134<br />
Four Channel <strong>Time</strong>-<strong>Correlated</strong> <strong>Single</strong> <strong>Photon</strong> <strong>Counting</strong> Module<br />
♦ Four Completely Parallel TCSPC Channels<br />
♦ Ultra-High Data Throughput<br />
♦ Overall Count Rate 32 MHz<br />
♦ Channel Count Rate 8 MHz (Dead <strong>Time</strong> 125ns)<br />
♦ Dual Memory Architecture: Readout during Measurement<br />
♦ Reversed Start/Stop: Repetition Rates up to 200 MHz<br />
♦ Electrical <strong>Time</strong> Resolution down to 8 ps FWHM / 5 ps rms<br />
♦ Channel Resolution down to 813 fs<br />
♦ Up to 4096 <strong>Time</strong> Channels / Curve<br />
♦ Measurement <strong>Time</strong>s down to 0.1 ms<br />
♦ Software Versions for Windows 95 / 98 / NT<br />
♦ Direct Interfacing to most Detector Types<br />
♦ <strong>Single</strong> Decay Curve Mode<br />
♦ Oscilloscope Mode<br />
♦ Seqential Recording Mode<br />
♦ Spectrum Scan Mode with 8 Independent <strong>Time</strong> Windows<br />
♦ Continuous Flow Mode for <strong>Single</strong> Molecule Detection<br />
Decay curves measured in seconds<br />
Sequential Recording<br />
Fluorescence decay of single molecules<br />
i n t e l l i g e n t<br />
measurement<br />
and<br />
control systems<br />
Becker & Hickl GmbH<br />
Nahmitzer Damm 30<br />
12277 Berlin<br />
Tel. +49 / 30 / 787 56 32<br />
Fax. +49 / 30 / 787 57 34<br />
email: info@becker-hickl.de<br />
http://www.becker-hickl.de
SPC-134<br />
<strong>Photon</strong> Channels<br />
Principle<br />
Constant Fraction Discriminator (CFD)<br />
<strong>Time</strong> Resolution (FWHM / RMS, electr.)<br />
8 ps / 5 ps<br />
Opt. Input Voltage Range<br />
- 50 mV to - 1 V<br />
Lower Threshold<br />
- 20 mV to - 500 mV<br />
Upper Threshold -<br />
Zero Cross Adjust<br />
- 100 mV to + 100 mV<br />
Synchronisation Channels<br />
Principle<br />
Constant Fraction Discriminator (CFD)<br />
Opt. Input Voltage Range<br />
- 50 mV to - 1 V<br />
Threshold<br />
- 20 mV to -500 mV<br />
Frequency Range<br />
0 to 200 MHz<br />
Frequency Divider 1-2-4<br />
Zero Cross Adjust<br />
-100 mV to + 100 mV<br />
<strong>Time</strong>-to-Amplitude Converters / ADCs<br />
Principle<br />
Ramp Generator / Biased Amplifier<br />
TAC Range<br />
50 ns to 2 us<br />
Biased Amplifier Gain 1 to 15<br />
Biased Amplifier Offset<br />
0 to 100% of TAC Range<br />
<strong>Time</strong> Range incl. Biased Amplifier<br />
3.3 ns to 2 us<br />
min. <strong>Time</strong> / Channel<br />
813 fs<br />
ADC Principle<br />
50 ns Flash ADC with Error Correction<br />
Diff. Nonlinearity<br />
< 2% rms<br />
Data Acquisition<br />
Dead <strong>Time</strong><br />
125ns<br />
max. Number of Curves in Memory 4096 1024 256 64<br />
Number of <strong>Time</strong> Channels / Curve 64 256 1024 4096<br />
max. Counts / Channel 2 16 -1<br />
Overflow Control<br />
none / stop / repeat and correct<br />
Collection <strong>Time</strong><br />
0.1 ms to 10000 s<br />
Display Interval <strong>Time</strong><br />
10ms to 1000 s<br />
Repeat <strong>Time</strong><br />
0.1 ms to 1000 s<br />
Curve Control (internal)<br />
Programmable Hardware Sequencer<br />
Count Enable Control<br />
1 bit TTL<br />
Measurement Trigger<br />
TTL<br />
Operation Environment<br />
Computer System<br />
PC Pentium<br />
Bus Connectors<br />
PCI<br />
Used PCI Slots 4<br />
Power Consumption approx. 18 W at +5V, 0.7 W at +12V<br />
Dimensions<br />
225 mm x 125 mm x 85 mm<br />
Accessories and Associated Products<br />
Detectors (MCPs, PMTs), Multichannel Detector Heads, Step Motor Controllers,<br />
Preamplifiers, PIN and Avalanche Photodiode Modules, ps Diode Lasers. Also<br />
available: SPC-3x0/4x0/500/5x0/6x0/7x0 time-correlated single photon counting<br />
modules, gated photon counters and multiscalers. Please call for individual data sheets<br />
and descriptions.<br />
Becker & Hickl GmbH<br />
Nahmitzer Damm 30<br />
12277 Berlin<br />
Tel. +49 / 30 / 787 56 32<br />
Fax. +49 / 30 / 787 57 34<br />
email: info@becker-hickl.de<br />
http://www.becker-hickl.de<br />
i n t e l l i g e n t<br />
measurement<br />
and<br />
control systems
The TCSPC General Solution<br />
SPC-600/630<br />
<strong>Time</strong>-<strong>Correlated</strong> <strong>Single</strong> <strong>Photon</strong> <strong>Counting</strong> Modules with dual Memory<br />
and PCI Bus<br />
♦ Complete TCSPC <strong>Systems</strong> on single PC Boards<br />
♦ Dual Memory Architecture: Unlimited Sequential Curve Recording<br />
♦ Histogram Mode: Recording of Decay Curves<br />
♦ FIFO Memory Mode: Continuous Recording by BIFL Method<br />
♦ Reversed Start/Stop: Repetition Rates up to 200 MHz<br />
♦ Electrical <strong>Time</strong> Resolution down to 8 ps FWHM / 5 ps rms<br />
♦ Channel Resolution down to 813 fs<br />
♦ Up to 4096 <strong>Time</strong> Channels / Curve<br />
♦ Ultra High Count Rate: Up to 8 MHz (125 ns Dead <strong>Time</strong>)<br />
♦ Measurement <strong>Time</strong>s down to 0.1 ms<br />
♦ Multi Detector Capability: Up to 128 Detector Channels<br />
♦ Software Versions for Windows 3.1 / 95 / 98 / NT<br />
♦ Optional Step Motor Controller for Wavelength or Sample Scanning<br />
♦ Direct Interfacing to most Detector Types<br />
♦ <strong>Single</strong> Decay Curve Mode<br />
♦ Oscilloscope Mode<br />
♦ Multiple Decay Curve Mode (Wavelength, <strong>Time</strong> or User Defined)<br />
♦ Spectrum Scan Mode with 8 Independent <strong>Time</strong> Windows<br />
♦ Multichannel X-Y-t-Mode<br />
♦ Continuous Flow and BIFL Mode for <strong>Single</strong> Molecule Detection<br />
‘<strong>Single</strong>’ Mode: Decay curves measured within seconds<br />
‘Continuous Flow’ Mode: Fluorescence decay from<br />
single molecules<br />
‘BIFL’ Mode: Traces of<br />
single molecules<br />
i n t e l l i g e n t<br />
measurement<br />
and<br />
control systems<br />
Becker & Hickl GmbH<br />
Nahmitzer Damm 30<br />
12277 Berlin<br />
Tel. +49 / 30 / 787 56 32<br />
Fax. +49 / 30 / 787 57 34<br />
email: info@becker-hickl.de<br />
http://www.becker-hickl.de
SPC-600<br />
SPC-630<br />
<strong>Photon</strong> Channel SPC-600 SPC-630<br />
Principle<br />
Constant Fraction Discriminator<br />
<strong>Time</strong> Resolution (FWHM / RMS, electr.) 13 ps / 7 ps 8 ps / 5 ps<br />
Opt. Input Voltage Range ± 10 mV to ± 80 mV - 50 mV to - 1 V<br />
Lower Threshold 5 mV to 80 mV - 20 mV to - 500 mV<br />
Upper Threshold 5 mV to 80 mV -<br />
Zero Cross Adjust -10 mV to + 10 mV - 100 mV to + 100 mV<br />
Synchronisation Channel SPC-600 SPC-630<br />
Principle<br />
Constant Fraction Discriminator<br />
Opt. Input Voltage Range ± 10 mV to ± 50 mV - 50 mV to - 1 V<br />
Threshold - - 20 mV to -500 mV<br />
Frequency Range<br />
0 to 200 MHz<br />
Frequency Divider 1-2-4-8-16<br />
Zero Cross Adjust -10 mV to + 10 mV -100 mV to + 100 mV<br />
<strong>Time</strong>-to-Amplitude Converter / ADC<br />
Principle<br />
Ramp Generator / Biased Amplifier<br />
TAC Range<br />
50 ns to 2 us<br />
Biased Amplifier Gain 1 to 15<br />
Biased Amplifier Offset<br />
0 to 100% of TAC Range<br />
<strong>Time</strong> Range incl. Biased Amplifier<br />
3.3 ns to 2 us<br />
min. <strong>Time</strong> / Channel<br />
813 fs<br />
TAC Window Discriminator<br />
Any Window inside TAC Range<br />
ADC Principle<br />
50 ns Flash ADC with Error Correction<br />
Diff. Nonlinearity (dith. width 1/8)<br />
< 0.5 % rms<br />
Data Acquisition (Histogram Mode)<br />
Dead <strong>Time</strong><br />
125ns<br />
max. Number of Curves in Memory 4096 1024 256 64<br />
max. Number of Detector Channels 128 128 128 32<br />
Number of <strong>Time</strong> Channels / Curve 64 256 1024 4096<br />
max. Counts / Channel 2 16 -1<br />
Overflow Control<br />
none / stop / repeat and correct<br />
Collection <strong>Time</strong><br />
0.1 us to 10000 s<br />
Display Interval <strong>Time</strong><br />
10ms to 1000 s<br />
Repeat <strong>Time</strong><br />
0.1 ms to 1000 s<br />
Curve Control (internal)<br />
Programmable Hardware Sequencer<br />
Curve Control (external Routing)<br />
7 bit TTL<br />
Add/Sub (Lock-in) Control<br />
1 bit TTL<br />
Count Enable Control<br />
1 bit TTL<br />
Control Signal Latch Delay<br />
0 to 255 ns<br />
Data Acquisition (FIFO / BIFL Mode)<br />
ADC Resolution 12 bit 8 bit<br />
Dead <strong>Time</strong> 150 ns 125 ns<br />
Output Data Format (ADC / Macrotime / Routing) 12 / 24/ 8 8 / 17 / 3<br />
FIFO buffer Capacity (photons) 128 k 256 k<br />
Macro <strong>Time</strong>r Resolution 1 us, 24 bit 50ns, 17 bit<br />
Curve Control (external Routing) 8 bit TTL 3 bit TTL<br />
Count Enable Control<br />
1 bit TTL<br />
Routing Signal Latch Delay<br />
0 to 255 ns<br />
Operation Environment<br />
Computer System PC Pentium or 486<br />
Bus Connector<br />
PCI<br />
Power Consumption approx. 20 W at +5V, 0.7 W at +12V<br />
Dimensions<br />
312 mm x 122 mm x 28 mm<br />
Accessories and Associated Products<br />
Detectors (MCPs, PMTs), Multichannel Detector Heads, Routing Devices for Multichannel Measurements,<br />
Step Motor Controllers, Preamplifiers, PIN and Avalanche Photodiode Modules, ps Diode Lasers. Also<br />
available: SPC-300/330/400/430/500/530 time-correlated single photon counting modules, gated photon<br />
counters and multiscalers. Please call for individual data sheets and descriptions.<br />
Becker & Hickl GmbH<br />
Nahmitzer Damm 30<br />
12277 Berlin<br />
Tel. +49 / 30 / 787 56 32<br />
Fax. +49 / 30 / 787 57 34<br />
email: info@becker-hickl.de<br />
http://www.becker-hickl.de<br />
i n t e l l i g e n t<br />
measurement<br />
and<br />
control systems
The ps Imaging Solution<br />
SPC-700/730<br />
<strong>Time</strong>-<strong>Correlated</strong> <strong>Single</strong> <strong>Photon</strong> <strong>Counting</strong> Imaging Modules<br />
with Scanning Control and PCI Bus<br />
♦ Complete TCSPC Imaging <strong>Systems</strong> on single PC Boards<br />
♦ Up to 65636 (256 x 256) Decay Curves in Memory<br />
♦ Up to 4096 <strong>Time</strong> Channels / Curve<br />
♦ Multi Detector Capability: Up to 128 x 128 Detector Channels<br />
♦ Electrical <strong>Time</strong> Resolution down to 8 ps fwhm / 4 ps rms<br />
♦ Channel Resolution down to 813 fs<br />
♦ Reversed Start/Stop: Repetition Rates up to 200 MHz<br />
♦ Count Rate up to 3 MHz<br />
♦ Measurement <strong>Time</strong>s down to 1 ms<br />
♦ Active or Passive Scanning Control<br />
♦ Optional Step Motor Controller<br />
♦ Software Versions for Windows 3.1 / 95 / 98 / NT<br />
♦ <strong>Single</strong> Decay Curve Mode<br />
♦ Multiple Decay Curve Mode (Wavelength, <strong>Time</strong> or User Defined)<br />
♦ Spectrum Scan Mode with 8 Independent <strong>Time</strong> Windows<br />
♦ Oscilloscope Mode<br />
♦ Multichannel X-Y-t-Mode<br />
♦ Fast Object Scanning / Lifetime Imaging Modes<br />
i n t e l l i g e n t<br />
measurement<br />
and<br />
control systems<br />
Becker & Hickl GmbH<br />
Nahmitzer Damm30<br />
12277 Berlin<br />
Tel. +49 / 30 / 787 56 32<br />
Fax. +49 / 30 / 787 57 34<br />
email info@becker-hickl.de<br />
http://www.becker-hickl.de
SPC-700<br />
SPC-730<br />
<strong>Photon</strong> Channel SPC-700 SPC-730<br />
Principle<br />
Constant Fraction Discriminator<br />
<strong>Time</strong> Resolution (FWHM / RMS, electr.) 13 ps / 7 ps 7 ps / 4 ps<br />
Opt. Input Voltage Range ± 10 mV to ± 80 mV - 50 mV to - 1 V<br />
Lower Threshold 5 mV to 80 mV - 20 mV to - 500 mV<br />
Upper Threshold 5 mV to 80 mV -<br />
Zero Cross Adjust -10 mV to + 10 mV - 100 mV to + 100 mV<br />
Synchronisation Channel SPC-700 SPC-730<br />
Principle<br />
Constant Fraction Discriminator<br />
Opt. Input Voltage Range ± 10 mV to ± 50 mV - 50 mV to - 1 V<br />
Threshold - - 20 mV to -500 mV<br />
Frequency Range<br />
0 to 200 MHz<br />
Frequency Divider 1-2-4-8-16<br />
Zero Cross Adjust -10 mV to + 10 mV -100 mV to + 100 mV<br />
<strong>Time</strong>-to-Amplitude Converter / ADC<br />
Principle<br />
Ramp Generator / Biased Amplifier<br />
TAC Range<br />
50 ns to 2 us<br />
Biased Amplifier Gain 1 to 15<br />
Biased Amplifier Offset<br />
0 to 100% of TAC Range<br />
<strong>Time</strong> Range incl. Biased Amplifier<br />
3.3 ns to 2 us<br />
min. <strong>Time</strong> / Channel<br />
813 fs<br />
TAC Window Discriminator<br />
Any Window inside TAC Range<br />
ADC Principle<br />
50 ns Flash ADC with Error Correction<br />
Diff. Nonlinearity (dith width 1/8, 90% of TAC range)<br />
< 0.5% rms<br />
Data Acquisition<br />
Dead <strong>Time</strong> (from stop to next photon)<br />
180 ns<br />
Number of <strong>Time</strong> Channels / Curve 64 256 1024 4096<br />
max. Number of Curves in Memory 65536 16384 4096 1024<br />
max. Square Scanning Area (pixels) 256 x 256 128 x 128 64 x 64 32 x 32<br />
max. Number of Detector Channels 16384 16384 4096 1024<br />
Counts / Channel 2 16 -1<br />
Counts / Channel ('<strong>Single</strong>' mode, repeat and acquire) 2 32 -1<br />
Overflow Control<br />
none / stop / repeat and acquire<br />
Collection <strong>Time</strong> (per curve or per pixel)<br />
100 ns to 1000 s<br />
Display Interval <strong>Time</strong><br />
10ms to 1000 s<br />
Repeat <strong>Time</strong><br />
0.1 ms to 1000 s<br />
Curve Control (Internal Routing)<br />
up to 65536 Curves<br />
Curve Control (Passive Scanning)<br />
14 bit TTL or SYNC Pulses from Scanner to SPC<br />
Scanning Control (Active Routing)<br />
14 bit TTL or Sync Pulses from SPC to Scanner<br />
Count Enable Control<br />
1 bit TTL<br />
Control Signal Latch Delay<br />
0 to 255 ns<br />
Operation Environment<br />
Computer System PC Pentium or 486<br />
Bus Connector<br />
PCI<br />
Power Consumption approx. 20 W at +5V, 0.7 W at +12V<br />
Dimensions<br />
312 mm x 122 mm x 28 mm<br />
Accessories<br />
Detector Heads (MCPs, PMTs), Multichannel Detector Heads, Routing Devices for Multichannel<br />
Measurements, Step Motor Controllers, Preamplifiers, PIN and Avalanche Photodiode Modules,<br />
ps Diode Lasers, Adapter Cables for Scanning Microscopes. Please call for individual data<br />
sheets.<br />
Becker & Hickl GmbH<br />
Nahmitzer Damm 30<br />
12277 Berlin<br />
Tel. +49 / 30 / 787 56 32<br />
Fax. +49 / 30 / 787 57 34<br />
email info@becker-hickl.de<br />
http://www.becker-hickl.de<br />
i n t e l l i g e n t<br />
measurement<br />
and<br />
control systems
Becker & Hickl GmbH August 2002<br />
High Performance<br />
<strong>Photon</strong> <strong>Counting</strong><br />
Tel. +49 - 30 - 787 56 32<br />
FAX +49 - 30 - 787 57 34<br />
http://www.becker-hickl.com<br />
email: info@becker-hickl.com<br />
SPCImage - Version 2.3<br />
Data Analysis Software for<br />
Fluorescence Lifetime Imaging Microscopy<br />
Calculation of colored lifetime images with combined decay and intensity information<br />
Processing of images with up to 1M (1024 x 1024) decay curves and up to 256 time channels<br />
Multiexponential fit with deconvolution from instrumental response function<br />
Adaptive suppression of scattered light and dark noise<br />
Presentation of fit quality by weighted residuals and reduced 2 for any selected pixel<br />
Selectable region of interest (ROI) , display of parameter distribution within ROI<br />
Color and brightness postprocessing of intensity and lifetime images<br />
Dynamic data exchange (DDE) from SPC-730/830 measurement software or import of data files<br />
Export function of windows bitmap or TIFF-files with 24-bit color depth<br />
Windows 95/98 and Windows NT 4.0/2000/XP compatible<br />
Fig. 1 : Graphical User Interface of the SPCImage software
1. Introduction<br />
Parallel processing of the fluorescence intensity and the fluorescence lifetime will enhance<br />
performance of imaging systems significantly. Especially in fluorescence lifetime imaging<br />
microscopy (FLIM) it is an important benefit to exploit the dependency of fluorescence lifetime to<br />
physical parameters. In contrast to the intensity the lifetime is measured as an absolute value and<br />
therefore overcomes many problems which result from complicated calibration procedures.<br />
The data analysis is of crucial relevance for gathering the desired information from time- and<br />
spatial-resolved fluorescence measurements. In principle two problems have to be solved a)<br />
derivation of a model function that is suitable for the description of time- and spatial-resolved<br />
fluorescence measurements and b) development of a fast algorithm for numerically fitting the<br />
model parameters to the individual data sets.<br />
In the SPCImage software a deconvolution technique is used to separate the decays associated with<br />
the different pixels into the contributions which originate from different emitting species. Given a 2<br />
dimensional set of fluorescence decay curves the model condenses the data by fitting it to a single<br />
exponential decay function with constant offset and a scattering correction. The model`s final<br />
values come from the underlying theory that the data can be approximated by a convolution of this<br />
‘pure decay’ and a numerically recorded response function of the measuring system.<br />
According to theory least-square fitting is a maximum likelihood estimation of the fitted parameters<br />
if the measurement errors are independent and normally distributed with constant standard<br />
deviation. Fluorescence measurements performed by time correlated single photon counting can<br />
fulfill the first requirement almost ideal since the data is collected from a large set of excitation<br />
pulses. However, the standard deviation of the time channels are not constant but obey a poisson<br />
statistic with a standard deviation of 2 = N , being N the number of the counts per channel. When<br />
relaxing the assumption of a constant standard deviation it is possible to work out a maximum<br />
likelihood estimation that holds for all cases where the number of counts per channel is not too<br />
small. In cases down to 4 counts the poisson distribution is still reasonably good approximated by a<br />
gauss function with 2 = N. Therefore the algorithm uses a “smart binning” technology which<br />
combines adjacent channels to achieve the above requirement for all channels with
2. Tutorial<br />
The software described in this manual is designed to provide an easy access to the liftime<br />
information in each pixel and presents it in a user definable way as a color coded image. SPCImage<br />
2.3 will run under all 32-bit Windows Operating <strong>Systems</strong>. A quick machine with at least 128 Mb<br />
of memory and a similar amount of free hard disk space is recommended. Screen resolution should<br />
be 1024x768 or better. The installation of the software is integrated in the TCSPC package and<br />
requires a licence key.<br />
Figure 1 shows the color coding in combination with a conventional intensity image. It was taken<br />
from a single cell layer of fixed cells which were stained with two different dyes. Nonlinear least<br />
square fitting with a single-exponential decay delivered the fluorescence decay rates in the<br />
individual pixels of the image. The color coded image displays the fluorescence intensity as<br />
brightness and the fluorescence time as color. Since the algorithm comprises deconvolution from an<br />
instrumental response as well as automatic subtraction of the dark noise both time resolution and<br />
signal to noise ratio can be enhanced significantly. The quality of the fit is shown for one selected<br />
pixel. The fluorescence decay times are clearly distinguished and are displayed by red and green<br />
colour respectively.<br />
With the new version a special data file format for lifetime images with the extension “.img” is<br />
introduced. Files with this extension can be saved and loaded by the application. As a new feature<br />
the loading may be now invoked by double clicking of the file or by dragging it into the main<br />
window of the SPCImage software!<br />
2.1 File Import<br />
Since SPCImage gets all the fluorescence lifetime data from the measurement software it is<br />
necessary to transfer the data between the two applications. The dataset from a SPC-700/730/830<br />
module is loaded into the application by importing an .sdt file which was created by the<br />
measurement software.<br />
Version 2.3 of SPCImage allows to select different measurement pages eventually contained in the<br />
measurement file. Pages are used to store subsequent measurements ( see explanation in the SPC<br />
user manual ) or for measurements in which the routing capability is used. Version 2.3 can process<br />
“.sdt” files with a format from single file up to 1024 x 1024 pixel.
By default the file type is set to “Scan Image” to import the dataset of the image as described above.<br />
By switching to “Instrumental Response” the program will try to import a single curve containing<br />
the temporal behaviour of the measurement system (optics + electronics). A more detailed<br />
description of this procedure can be found below.<br />
2.2 Options Display Settings<br />
An intensity image of the data is displayed after having successfully imported the data . This image<br />
is calculated from the time integrated number of counts for each pixel (pixel-sum). An autoscaling<br />
of the intensity is performed by selecting the range from 0 (black) to the maximum pixel sum within<br />
the image (white). There are two possible ways to change the intensity of the image:<br />
i) When the “autoscale” checkbox is disabled a user defined maximum can be inserted.<br />
This feature enables an “absolute scaling” for comparing different measurements (or<br />
pages within one measurement).<br />
ii)<br />
The brightness of the image can be controlled by the Brightness & Contrast Dialog. The<br />
sliders can be used to change the image appearance by “trial-and-error”.<br />
2.3 Calculate Instrumental Response (F5)<br />
After importing the dat a decay curve and a fit will appear in the “single curve”-diagram at the<br />
bottom of the window. It belongs to the pixel which was selected with the small blue cursor within<br />
the intensity image. The model function of the fit curve is a “Multiexponential Decay” with offsetcorrection.<br />
The latter taking ambient light and/or dark noise into account:<br />
F(<br />
t)<br />
a<br />
0<br />
a e<br />
1<br />
a<br />
e<br />
a<br />
t<br />
/ 1 t<br />
/ 2 t<br />
/ 3<br />
2<br />
3<br />
e<br />
The number of exponential decays that are used is given by the “Components” parameter in the<br />
lower right of the application window:
The constant a 0 is denoted as “Offset” and can be fixed, i.e. held at a user given value, by activating<br />
the check box next to the value field. If the offset it is not fixed the program will calculate this<br />
parameter by averaging the number of photons in front of the first vertical cursor! Please note that<br />
the intensity coefficients a 1 through a 3 are given as relative amplitudes which can not be changed by<br />
the user. The decay-times 1<br />
through 3<br />
are denoted in picoseconds (ps) and are “fixable”. If the<br />
“Fix”-box is checked the corresponding value must be inserted by the user and is not changed by<br />
the program during the fitting process.<br />
The analytical function is convoluted with an “instrumental response” function before it is fitted to<br />
the data. By default the fitting algorithm uses a dataset for the convolution which is calculated from<br />
the first derivative of the rising part of the fluorescence. However, the true shape of the<br />
instrumental response is determined by the detector and is also influenced by the excitation source<br />
and the optical pathway of your system. Therefore the shape of the system response calculated by<br />
this procedure is only a rough approximation and may cause deviations especially in the first part of<br />
the curve. Please note that only the region between the two vertical lines is taken into account by<br />
the fitting procedure. Therefore it may appear that the fit outside these lines is not correct and the<br />
cursors have to be moved to the region of interest. It is a good idea to place the first cursor line<br />
directly in front of the rising edge of the fluorescence decay and the second near the end of the<br />
curve where a dropping of the decay not yet appears.<br />
The time-shift parameter denoted as “Shift” determines how the instrumental response function is<br />
located relative to the rising edge of the fluorescence (given in channels). The scattering factor<br />
takes into account how much of the exciation light is directly scattered instead of being absorbed<br />
and emitted as fluorescence.<br />
If the curve seems to have very few counts it is a good idea to increase the so called binning factor.<br />
This factor defines how many pixels are combined before the decay time is calculated. The<br />
preselected value of 1 means that (2 n + 1) x (2 n +1) = 9 pixels are summed up to produce one<br />
decay curve. Values greater than 3 are not recommended since a higher factor will decrease the<br />
spatial resolution. In addition you can select a “ threshold”. This value defines the lower limit of<br />
photons that at least has to be in the maximum of the curve - otherwise fitting is skipped.<br />
2.4 Calculate Decay Matrix (F2)<br />
Now you can create a lifetime image by using the function to calculate the “Decay Matrix” which<br />
contains the calculated fit parameters for every pixel. This procedure needs most of the<br />
computational resources and takes several seconds to some minutes depending on model<br />
complexity, image size and computer speed.
2.5 Options Color Coding<br />
After calculating the decay matrix for the first time the color images might not revealing the full<br />
information. Therefore it is recommended to adjust the color range according to the particular<br />
lifetime distribution of the individual image. For this purpose please use first the “Autoscale”-<br />
button and then the vertical black cursors which are positioned at left and right side of the lifetime<br />
distribution panel respectively.<br />
If the mode Continuous Colors is used the position of the black cursors are reflected by the Color<br />
Range values (Minimum/Maximum) in the upper left of the dialog box. In the upper right of the<br />
dialog three list boxes can be found which belongs to the Displayed Value. As a default the average<br />
lifetime “tm” of the decay matrix is taken. This means that for a multi-exponential decay the<br />
average lifetime is calculated according to the formular:<br />
<br />
m<br />
<br />
N<br />
<br />
i1<br />
N<br />
<br />
i1<br />
a <br />
i<br />
a<br />
i<br />
i<br />
As the default mode for the color is a continuous color scale. The value m<br />
is presented with a<br />
rainbow-like distribution which runs from red (small values) to blue (large values). By changing the<br />
Color Direction to “Blue-Green-Red” this order can be reversed. For another presentation the Color<br />
Mode may be switched to Discrete Colors. With this option it is possible to select the regions for<br />
red (R), green (G) or blue (B) manually.<br />
Next to “tm” the Value1 of the Displayed Value box can be choosen as the lifetime components: (t1,<br />
t2 , t3 ) the relative amplitudes (a1, a2, a3 ) or the relative qunatum yields (q1, q2, a3) of the<br />
individual components. In this case the color image will present only the selected value. of taking<br />
the lifetime average. Moreover the colour coded value can be the result of a simple arithmetic
calculation ( sum, difference, product, quotient ) selected by the operation selection box. Please<br />
note that the distribution curve in the color scale window (see below) will also change in this case<br />
since it always reflects the distribution of the value which is finally used to generate the color<br />
image.<br />
2.6 Options Preferences<br />
It is possible to configure the general appearance of the application by this dialog. If the<br />
Windows operating system uses “large fonts” it is preferable to switch the application window<br />
also to “Large”.<br />
By default the “Show Intensity Window”- checkbox is switch on. This means that the intensity<br />
image is presented next to the lifetime image. To safe space within the main window you may<br />
switch off this option. In this case the distribution graph is presented in a larger diagram to display<br />
more details.<br />
Please note that the application window has to be restarted when changing some of the application<br />
window options! This is done automatically after pressing ok – do not restart the application<br />
manually during this process.
For all parts of the lifetime image where no fit parameters could be determind ( due to low photon<br />
numbers or excluding by the range-of-interest cursors ) it is possible to diplay the intensity<br />
information instead. When checking the “Combine Intensity Image” this option is enabled and you<br />
will usually see a part of the image to be gray-scaled. The group of radio button “small-mediumlarge”<br />
can be used to switch the resolution of the image windows. The “large” option can be helpful<br />
to display the details of high resolution images ( 512 x 512 and higher) wheras the “small” option<br />
might fit better for image resolutions ( 128 x 128 or lower ).<br />
The “Decay Window” group allows to activate the response function inside the decay diagram.<br />
Furthermor it is now possible the switch of the automatic recalculation of the parameters within<br />
each pixel. This was implemented due to the following reason: If the “Recalculate each point” box<br />
is switched on (default) the software will repeat the fit for each pixel when moving the cursor or<br />
changing the parameters of the fit model. Whereas this guarantees that a correct fit is presented for<br />
each pixel it might not relect the decay matrix that was calculated before by pressing<br />
Calculate->Decay Matrix. If the the “Recalculate each point” checkbox is switched off the decay<br />
window always presents the of the original parameters of the decay matrix – only in the case the<br />
pixel was not fitted before it will present a new fit.<br />
The “Automatic Response Calculation” which is switched on by default and enables a quick and<br />
robust estimation of the system function. It also places the first cursor directly in front of the rising<br />
part of the decay curve after the “Calculate -> Response Function (F5)” procedure is invoked. If the<br />
“Automatic Response Calculation” is switched off the first cursor has to be placed manually in front<br />
of the rising part of the fluorescence trace and the second near the maximum of the trace. In this<br />
case the the binning factor should be increased to get a trace with a well defined rising edge. Please<br />
note that the “Calculate -> Response Function (F5)” command takes only the region between the<br />
cursor lines into account when working without “Automatic Response Calculation”.<br />
The Display of the<br />
2.7 File Export<br />
The new version comes with a convenient export filter to enable postprocessing of the generated<br />
data by an external software. The dialog box shown below lists all data elements that may be
exported by clicking the checkboxes next to it.<br />
All data generated by the Calculate->Decay Matrix command can be stored into ASCII files with<br />
the help of the first group Matrix. After pressing Export the program asks for a name of the export<br />
file. Please note that the name contained in the dialog box will be used as “ending” of the complete<br />
filename. The first part is automatically added by the program according to the type of data.<br />
The created files for the Matrix contain space seperated values with an end-of-line character for<br />
each row. The “coded value” matrix contains the values from which the current color image was<br />
generated ( 2.5 Options Color Coding ). The Trace group allows to export the data of single<br />
curves. The format of these files is x-Value and y-Value in each row seperated with a space.<br />
Two image formats are supported by the new version. Next to the windows bitmap format (.bmp) it<br />
is now possible to choose the Tagged Image File Format (.tiff) for the color- and the gray-scale<br />
image. In addition to this it is possible to export the color legend bar as an extra file. This will allow<br />
to present the correct color coding together with a lifetime image.
Complete reconstruction of tissue structures and optical properties from time-resolved data is extremely demanding and<br />
not entirely solved yet. Nevertheless, it turns out that a large number of time-resolved detection channels is required to<br />
obtain meaningful optical tomographic images. For in-vivo applications it is important to keep the measuring time<br />
short, i.e. simultaneous recording at different projection angles is highly desired. An additional advantage of a multichannel<br />
measurement is that for a given number of photons injected the total number of detected photons is increased<br />
improving signal-to-noise ratio compared to single-channel detection.<br />
Fig. 1: Appearance of an object under different projection angles (top) and tomosynthesis (bottom)<br />
To record data for optical mammography containing temporal information, modulation techniques and time-correlated<br />
single photon counting techniques are used. TCSPC has the benefit of a higher system bandwidth limited by the transit<br />
time spread of the detector rather than by the width of its pulse response. Furthermore, TCSPC yields a shot-noise<br />
limited signal-to-noise ratio and a near-ideal sensitivity. Conventional TCSPC electronics is, however, too bulky for the<br />
required number of channels and poses severe restrictions on the photon count rate.<br />
We present improved TCSPC electronics which can be used for up to 32 detector channels with an effective overall<br />
count rate of 20 MHz and demonstrate its application to optical mammography.<br />
2. HIGH COUNT RATE MULTICHANNEL TCSPC<br />
The TCSPC device is shown in fig. 2, left. It is a package of four completely parallel TCSPC channels. Each channel<br />
can be expanded to record the signals of eight detectors simultaneously and has a maximum useful count rate of 5 MHz.<br />
The package is operated in a standard PC. The block diagram of one TCSPC channel is shown in fig. 2, right.<br />
detector no.<br />
Latch<br />
detector no.<br />
Memory<br />
from detectors<br />
from<br />
detector(s)<br />
CFD<br />
Counter<br />
DAC<br />
SUB<br />
from<br />
laser<br />
CFD<br />
start<br />
stop<br />
TAC<br />
time<br />
+<br />
ADC<br />
One of four identical channels<br />
Histograms<br />
Fig. 2, left: The complete 4-channel device ready to be inserted in a PC<br />
right: Block diagram of one TCSPC channel. CFD - constant fraction discriminator, TAC - time-to-amplitude<br />
converter, DAC - digital-to-analog converter, ADC - analog-to-digital converter, SUB - subtraction circuit<br />
Basically, the device uses the well-known reversed start-stop principle with constant fraction discriminators, CFD, timeto-amplitude<br />
converter, TAC, and analog-to-digital-converter, ADC, that addresses a memory in which the histogram of<br />
the photon density over time is built up.<br />
European Conferences on Biomedical Optics, ECBO 2001, Munic, June 2001
High count rate multichannel TCSPC for optical tomography<br />
Wolfgang Becker *a , Axel Bergmann a , Heidrun Wabnitz **b , Dirk Grosenick b , Adam Liebert ***b<br />
a<br />
Becker & Hickl GmbH; b Physikalisch-Technische Bundesanstalt Berlin<br />
ABSTRACT<br />
An improved <strong>Time</strong>-<strong>Correlated</strong> <strong>Single</strong> <strong>Photon</strong> <strong>Counting</strong> (TCSPC) technique features high count rate, low differential<br />
nonlinearity and multi-detector capability. The system has four completely parallel TCSPC channels and achieves an<br />
effective overall count rate of 20 MHz. By an active routing technique, up to eight detectors can be connected to each of<br />
the TCSPC channels. We used the system to record optical mammograms after pulsed laser illumination at different<br />
wavelengths and projection angles.<br />
Keywords: (170.3660) light propagation in tissue; (170.6960) tomography; (170.3830) mammography<br />
1. INTRODUCTION<br />
Attempts to image structures in deep tissues by optical tomography based on near-infrared (NIR) light are faced with<br />
the problem that details are washed out by the strong scattering of photons. Therefore, optical tomography of thick<br />
tissues cannot achieve spatial resolution comparable to that of X ray methods. There are, however, two benefits of<br />
optical methods: At sufficiently low power NIR radiation does not harm tissue. From absorption coefficients measured<br />
at several wavelengths, physiological quantities can be derived, in particular haemoglobin concentration and blood<br />
oxygen saturation [1].<br />
Light propagation in tissue is governed by scattering and absorption of photons. Unfortunately, these effects cannot be<br />
reliably distinguished in simple steady state measurements. However, when pulsed light is used, time-resolved detection<br />
of diffusely transmitted or reflected intensity yields additional information. Although increased scattering and increased<br />
absorption both decrease the output intensity, stronger scattering broadens the transmitted or reflected pulse while<br />
increased absorption tends to narrow it. By modelling propagation of light as diffusion of photons and by using<br />
appropriate boundary conditions when solving the diffusion equation, the reduced scattering coefficient and the<br />
absorption coefficient of a homogeneous medium can be distinguished and quantified using the shape of the broadened<br />
pulse only [2].<br />
Optical tomography aims at the detection of inhomogeneities in tissue and relies on measurements at a number of<br />
detector positions for each source position. Various mathematical methods have been developed to reconstruct the<br />
position and the optical properties of inhomogeneities from measured data [3, 4]. <strong>Time</strong>-resolved techniques improve<br />
localisation and characterisation of inhomogeneities [5], as information on the pathlength of each photon becomes<br />
available. Inhomogeneities differing from the surrounding tissue by scattering and absorption have different influence<br />
on the distribution of times of flight of photons.<br />
Transillumination scanning optical mammography [6] is performed in slab geometry, i.e. the breast is compressed<br />
between two glass plates with source and detector, positioned on opposite sides, scanned synchronously. Detection at<br />
different projection angles gives additional information on the internal structure of the tissue. The apparent location of<br />
the image of structural details depends on the depth of the corresponding structure in the tissue. By shifting and adding<br />
images obtained at different projection angles structural details in selected layers can be enhanced while those of other<br />
layers are smeared out (fig.1). The method is known as “digital tomosynthesis” in X ray mammography [7] and requires<br />
data taken at a sufficient number of projection angles. This empirical approach yields images containing depth<br />
information but cannot compensate for the loss in resolution and contrast due to scattering.<br />
* becker@becker-hickl.de; phone +49 30 7875632; fax +49 30 7875734; http://www.becker-hickl.de; Becker & Hickl GmbH,<br />
Nahmitzer Damm 30, D-12277 Berlin, Germany; ** heidrun.wabnitz@ptb.de, phone +49 30 3481 293; fax +49 30 3481 505;<br />
Physikalisch-Technische Bundesanstalt Berlin, Abbestr. 2-12, D-10587 Berlin, Germany; *** permanent address: Institute of<br />
Biocybernetics and Biomedical Enginnering, Trojdena 4, 02-109 Warsaw, Poland<br />
European Conferences on Biomedical Optics, ECBO 2001, Munic, June 2001
In contrast to the conventional setup, we use an ultra-fast ADC with an error reduction circuitry and an extended<br />
memory structure for multidetector operation [8]. The applied principle of analog to digital conversion is shown in<br />
fig. 2. The ADC is supplemented by an up-down counter which counts the incoming photon pulses. The counter output<br />
data is fed to a DAC generating a triangle signal which is added to the output of the TAC. The ADC converts the sum of<br />
both signals, giving the sum of the TAC value and the counter data. At the output of the ADC, the counter data is<br />
subtracted from the ADC result. This restores the original detection time measured by the TAC. Compared to a direct<br />
ADC conversion, this principle has a striking benefit: It converts the time of each photon in a different place on the<br />
ADC characteristics and therefore smoothens out the ADC errors. This smoothing works so efficiently, that we can use<br />
an ultra-fast ADC with only 12 bit non-missing code accuracy. Together with a speed-optimised TAC, we achieve a<br />
signal processing time of only 125 ns per photon.<br />
The effect of the ADC error reduction is shown in fig. 3, left. An unmodulated light signal was recorded without error<br />
correction, and for a 7 bit and 9 bit width of the counter. Fig. 3, right, shows that the instrument response function is not<br />
substantially broadened by the error reduction.<br />
7 bit<br />
off<br />
7 bit<br />
9 bit<br />
9 bit<br />
FWHM=7.5ps FWHM=7.6ps<br />
FWHM=<br />
8.2ps<br />
off<br />
Fig. 3, left: Unmodulated light recorded without error reduction, and with a counter data width of 7 bit and 9 bit<br />
right: Corresponding instrument response function for an electrical test signal<br />
Fig. 4 shows how one TCSPC channel is expanded for operation with eight detectors. The expansion is based on the<br />
fact that it is unlikely to detect several photons in the same laser pulse period. This is a general condition for any<br />
TCSPC measurement and therefore not a restriction for the multi-detector configuration.<br />
The single photon pulse from each detector is fed to a discriminator that<br />
responds when the detector has seen a photon. The discriminator outputs<br />
are encoded to generate a 3 bit channel number.<br />
The output signals of all detectors are merged into one output line by a<br />
summing amplifier. Thus, on the detection of each photon we get a<br />
detector pulse and a detector number.<br />
The detector pulse is connected in the usual way to the CFD input of one<br />
TCSPC channel (fig. 2). When the TCSPC channel detects this pulse, it<br />
writes the ‘channel number’ bits into a data latch that controls the memory<br />
segment in which the photon is stored. Thus, in the TCSPC memory eight<br />
histograms corresponding to the individual detectors are built up.<br />
In the unlikely case that several detectors respond in the same laser pulse<br />
period, the encoder delivers an ‘invalid’ signal which inhibits the storing<br />
of the current photon. Therefore, the well-known pile-up distortion of the<br />
histogram is even smaller than with a single detector operated at the<br />
overall count rate of the eight detectors.<br />
Detector<br />
1<br />
2<br />
8<br />
Discriminator<br />
1<br />
2<br />
8<br />
Summing<br />
Amplifier<br />
Encoder<br />
Channel<br />
Number<br />
invalid<br />
Detector Pulse<br />
Fig. 4: Expansion for multi-detector operation<br />
3. APPLICATION TO LASER-PULSE MAMMOGRAPHY<br />
The TCSPC device was tested in the laser-pulse mammograph described in [6]. For the experiments described below,<br />
the mammograph was upgraded to four detection channels. When recording mammograms, the source-detector<br />
arrangement is scanned across the slightly compressed breast in two dimensions. <strong>Time</strong>-resolved transmittance is<br />
measured within 100 ms at each of 1000-2000 scan positions, 2.5 mm apart. Mammograms are recorded within 3-<br />
6 min. The diameter of the illuminated spot at the upper surface is about 3 mm, the detector fibre bundles are 4 mm in<br />
diameter.<br />
All detectors were Hamamatsu R7400U-02 photomultipliers. Preamplifiers (50db) were used to compensate for the<br />
relatively low gain of the R7400U-02 detectors. The arrangement of the detector fibre bundles D1 to D4 is shown in<br />
European Conferences on Biomedical Optics, ECBO 2001, Munic, June 2001
fig 5 (upper right). D1 was the direct channel opposite to the source fibre, D2, D3 and D4 were offset by 2 cm.<br />
Picosecond laser pulses from a 670 nm and a 785 nm diode laser (PicoQuant, Berlin) were multiplexed.<br />
To test the system we used the phantom shown in fig. 5 (upper left). It consisted of a rectangular cuvette with several<br />
black wires of 1.7 mm diameter and one transparent and three black spheres of 8 mm diameter. The wires were arranged<br />
at different depths and orientations. The two longest wires ran parallel to and 0.6 cm apart from the front and rear<br />
surfaces of the scattering liquid, respectively. The black spheres were positioned 1.2 cm from the front plane, at the<br />
centre plane and 1.2 cm from the rear plane. The transparent (glass) sphere was placed at the centre plane. The inner<br />
thickness of the cuvette was 6.8 cm. As scattering liquid a mixture of whole milk and water with addition of a small<br />
amount of black ink was used. At 670 nm the reduced scattering and absorption coefficients were about 10 cm -1 and<br />
0.04 cm -1 , respectively, and thus typical of the optical properties of breast tissue.<br />
Fig. 5 shows the result of a 65 by 53 pixel scan with a step size of 2.5 mm. The images were created from the time-offlight<br />
distributions of the photons integrated over time and normalised at a common reference position. The different<br />
appearance of the phantom under different projection angles is clearly visible. The image coordinates are referenced to<br />
the coordinates of the source. The objects close to the source (lower sphere and wire running from upper left to lower<br />
middle of the image, s. fig. 5) do not change their position at different viewing angles. The other objects (e.g. upper<br />
sphere and wire running from lower left to upper middle) appear shifted depending on their depth and on the detector<br />
position.<br />
2 cm<br />
D4<br />
Source<br />
D2<br />
D1 D3<br />
Fig. 5: Phantom images - arranged according to the positions of the detecting fibre bundles (s. upper right) - representing total photon<br />
counts for different projection angles. In all figures a linear gray scale is used. Black corresponds to the minimum, white to the<br />
maximum value of the photon counts displayed. A photo of the phantom taken from an oblique direction is shown (upper left).<br />
Figs. 6b and c show the results of tomosynthesis [7, 6] based on the images corresponding to detector positions D1 to<br />
D3. For comparison, the image corresponding to D1 (s. fig. 5) is also included (fig. 6a). The raw images were added<br />
with appropriate offsets to synthesise images corresponding to a plane 0.8 cm below the source (fig. 6b) and a plane at<br />
the centre of the phantom (fig. 6c). The images show the black objects (wires and spheres) of the phantom more or less<br />
clearly. The contrast of objects in the synthesised plane remains unchanged while the contrast of objects in other planes<br />
is smeared out. There is, however, no indication of the glass sphere at the centre plane, not even in the corresponding<br />
tomosynthesis image.<br />
European Conferences on Biomedical Optics, ECBO 2001, Munic, June 2001
a b c<br />
Fig. 6: Tomosynthesis for localisation of objects at various depth using images representing total photon counts (s. fig. 5): Raw<br />
image derived from the central detector D1 (a), tomosynthesis of images recorded by detectors D1, D2 and D3 for a plane close to<br />
the source (b) and for the central plane (c).<br />
a b c<br />
Fig. 7: Tomosynthesis of images generated from photons in an early time window: Raw image derived from the central detector D1<br />
(a), tomosynthesis of images recorded by detectors D1, D2 and D3 for the same planes as in fig. 6 (b, c).<br />
Fig. 7 was obtained from photon counts in an early time window of the times-of-flight distribution of photons. The<br />
window was adjusted to contain 10% of all photons detected at a reference position. Although the images contain some<br />
noise due to the smaller number of photons, the glass sphere shows up. Adding images appropriately shifted for<br />
tomosynthesis enhances not only the objects in the synthesised plane but also reduces the noise. It should be noted that<br />
three projection angles are sufficient to triangulate the depth of an inhomogeneity of any shape. However, to obtain<br />
images of selected planes a much larger number of projection angles must be used.<br />
D4<br />
D2<br />
D1<br />
D3<br />
Fig. 8: Mammograms of a volunteer recorded simultaneously at four projection angles. The images were generated from photon<br />
counts in a late time window. The arrangement of the mammograms corresponds to that of the detectors D1-D4 (s. fig. 5).<br />
European Conferences on Biomedical Optics, ECBO 2001, Munic, June 2001
Fig. 8 shows 51 by 21 pixel mammograms of a breast of a volunteer recorded at 785 nm by the four-channel setup. The<br />
mammograms were obtained by using photon counts in the 8th of 10 consecutive time windows each containing 10% of<br />
all photons detected at a reference position. It was shown previously that mammograms based on this time window are<br />
essentially free of edge effects without requiring correction algorithms to be applied [6]. The mammograms of fig. 8<br />
corresponding to the different projection angles show slight differences. Since the pattern of the superficial blood<br />
vessels does not change significantly with the projection angle it can be concluded that these vessels were close to the<br />
source plane.<br />
4. CONCLUSIONS<br />
The TCSPC device described above has successfully been used to record time-resolved transmittance of phantoms and<br />
a compressed breast at high speed, high accuracy and high time resolution.<br />
5. REFERENCES<br />
1. T. O. McBride, B. W. Pogue, E. D. Gerety, S. B. Poplack, U.L. Österberg, K. D. Paulsen, “Spectroscopic diffuse<br />
optical tomography for the quantitative assessment of hemoglobin concentration and oxygen saturation in breast<br />
tissue”, Appl. Opt. 38, 5480-5490 (1999)<br />
2. M.S. Patterson, B. Chance, B.C. Wilson, “<strong>Time</strong>-resolved reflectance and transmittance for the noninvasive<br />
measurement of tissue optical properties”, Appl. Opt. 28, 2331-2336 (1989).<br />
3. S.R. Arridge, "Optical tomography in medical imaging“, Inverse Problems 15, R41–R93 (1999).<br />
4. S. B. Colak, D. G. Papaioannou, G. W. ’t Hooft, M. B. van der Mark, H. Schomberg, J. C. J. Paasschens, J. B. M.<br />
Melissen, and N. A. A. J. van Asten, "Tomographic image reconstruction from optical projections in light-diffusing<br />
media“, Appl. Opt. 36, 180-213 (1997)<br />
5. F. Gao, P. Poulet, and Y. Yamada, “Simultaneous mapping of absorption and scattering coefficients from a threedimensional<br />
model of time-resolved optical tomography”, Appl. Opt. 39, 5898-5910 (2000)<br />
6. D. Grosenick, H. Wabnitz, H. H. Rinneberg, K.T. Moesta, P.M. Schlag, “Development of a time-domain<br />
mammograph and first in vivo applications”, Applied Optics, 38 (1999) No. 13, 2927-2943<br />
7. L.T. Niklason et. al., “Digital tomosynthesis in breast imaging”, Radiology 205, 399-406 (1997)<br />
8. Becker & Hickl GmbH, SPC-134 through SPC-730 Operating manual, www.becker-hickl.com<br />
European Conferences on Biomedical Optics, ECBO 2001, Munic, June 2001
Picosecond Fluorescence Lifetime Microscopy by TCSPC Imaging<br />
Wolfgang Becker*, Axel Bergmann*, Karsten König**, Uday Tirlapur**<br />
* Becker & Hickl GmbH, D-12277 Berlin, Germany, ** Friedrich-Schiller-University, Institute of<br />
Anatomy II, D-07743 Jena, Germany<br />
Abstract<br />
A new <strong>Time</strong>-<strong>Correlated</strong> <strong>Single</strong> <strong>Photon</strong> <strong>Counting</strong> (TCSPC) imaging technique delivers combined intensity-lifetime images in<br />
a two-photon laser scanning microscope. The sample is excited by laser pulses of 150 fs duration and 80 MHz repetition<br />
rate. The microscope scans the sample with a pixel dwell time in the µs range. The fluorescence is detected with a fast PMT<br />
at the non-descanned port of the laser scanning microscope. The single photon pulses from the PMT and the scan control<br />
signals from the scanning head are used to build up a three-dimensional histogram of the photon density over the time within<br />
the decay function and the image coordinates x and y. Analysis of the recorded data delivers images containing the intensity<br />
as brightness and the lifetime as colour, images within selected time windows or decay curves in selected pixels. The<br />
performance of the system is shown for typical applications such as FRET measurements, Ca imaging and discrimination of<br />
endogenous fluorophores or different dyes in living cells and tissues.<br />
Keywords: Fluorescence lifetime imaging, laser scanning microscope, time-correlated single photon counting<br />
1. Introduction<br />
To investigate molecular interactions in cells and subcellular structures fluorescence markers are used which specifically link<br />
to protein structures. Staining the sample with different dyes and recording the fluorescence image reveals the cell structures<br />
via the different fluorescence spectra and fluorescence lifetime of the dyes. Energy transfer between the dye molecules and<br />
the proteins changes the fluorescence quantum efficiency and thus the fluorescence lifetime. Due to the variation of the dye<br />
concentration these effects cannot be distinguished in simple intensity images. Therefore, recording time-resolved patterns<br />
of the full fluorescence decay functions rather than simple intensity imaging is required to investigate molecular interactions<br />
in biological systems.<br />
Recording time-resolved fluorescence images can be achieved by combining a confocal laser scanning microscope, a<br />
femtosecond Titanium Sapphire (TiSa) Laser and an advanced <strong>Time</strong>-<strong>Correlated</strong> <strong>Single</strong> <strong>Photon</strong> <strong>Counting</strong> (TCSPC) imaging<br />
technique.<br />
2. The Laser Scanning Microscope<br />
The optical principle of a confocal microscope is shown in fig. 1.<br />
The laser is fed into the optical path via a dichroic mirror and<br />
focused into the sample by the microscope objective lens. In the<br />
traditional one-photon setup the light from the sample goes back<br />
through the objective lens, through the dichroic mirror and<br />
through a pinhole in the upper image plane of the objective lens.<br />
Light from outside the focal plane is not focused into the pinhole<br />
plane and therefore substantially suppressed. X-Y imaging is<br />
achieved by optically scanning the laser spot over the sample,<br />
Z imaging (optical sectioning) is possible by moving the sample or<br />
the microscope up and down.<br />
With a fs TiSa laser the sample can be excited by two-photon<br />
absorption. Due to the short pulse duration and the small diameter<br />
of the Airy disk the photon density in the focus is very high, so<br />
Laser<br />
Excited<br />
Detector<br />
Pinhole<br />
Dichroic<br />
Mirror<br />
Objective<br />
Lens<br />
Sample<br />
One-<strong>Photon</strong> Excitation<br />
Laser<br />
NIR fs pulses<br />
Excited<br />
Detector<br />
Dichroic<br />
Mirror<br />
Objective<br />
Lens<br />
Sample<br />
Two-<strong>Photon</strong> Excitation<br />
Fig. 1: Principle of a laser scanning microscope (scanning<br />
setup not shown)<br />
SPIE BIOS 2001, Multiphoton Microscopy in the Biomedical Sciences 1
that the two-photon excitation works with high efficiency. Excitation occurs only in the focus, so that no pinhole is required<br />
to reject light from outside the focal plane. For imaging biological samples, two-photon excitation has several benefits:<br />
- Scattering and absorption coefficients at the near infrared excitation wavelength are small. Therefore, layers deeply in the<br />
sample can be excited.<br />
- If deep sample layers are imaged the scattering at the emission wavelength broadens the luminescent spot seen by the<br />
microscope objective. The absence of a pinhole allows to efficiently record the emitted light from a relatively large area<br />
while maintaining the optical sectioning capability.<br />
- Living cells are surprisingly stable when illuminated with NIR radiation [1].<br />
2. TCSPC Lifetime Imaging<br />
2.1. Light Sources<br />
Fluorescence Lifetime Imaging requires a pulsed excitation source. Two-photon microscopes use fs pulsed Ti:Sa lasers so<br />
that a suitable light source is already present. For one-photon excitation, a frequency-doubled Ti:Sa can be used.<br />
Synchrotron radiation has also been used [2], but is available only in some special cases. A reasonable cost solution are<br />
pulsed diode lasers which are available for the blue and red spectral range. These lasers deliver pulses down to 40 ps fwhm<br />
with up to 80 MHz repetition rate. They are by far a better solution than modulating the continuous laser of a commercial<br />
one-photon microscope which is sometimes suggested.<br />
2.2. Detection Electronics<br />
To record fluorescence images with lifetime information gated image intensifiers, modulated image intensifiers or single<br />
channel modulation techniques [3], gated photon counting [4], and time-correlated photon counting can be used.<br />
In conjunction with a scanning microscope, most of these methods have serious drawbacks. Simple gating of the detector<br />
electronics discards the majority of the fluorescence photons and thus yields a poor sensitivity. Gated photon counting and<br />
single channel modulation techniques usually have problems with the high scanning speed of the microscope. Image<br />
intensifiers and other direct imaging techniques do not only record photons from the scanned spot of the sample, but also the<br />
thermal background events from the remaining detector area.<br />
Gated photon counting can be accomplished in several parallel channels with subsequent time windows [4] . However,<br />
correct signal analysis is a problem if, as usual, the detector response shows afterpulses and bumps or if the optical system is<br />
not absolutely free of reflections.<br />
<strong>Time</strong>-correlated single photon counting (TCSPC) is often believed to be an extremely slow method unable to reach short<br />
acquisition times. This ill reputation came from older NIM systems used in conjunction with low repetition rate light<br />
sources. Nevertheless, an early application of a high count rate TCSPC system to laser microscopy used an Ar+ laser for<br />
excitation and reached a count rate of 2∗10 5 / s [5].<br />
State-of-the art TCSPC systems reach count rates in<br />
the MHz range and therefore are able to record<br />
decay functions within a few ms. The TCSPC<br />
method has a high detection efficiency, a time<br />
resolution limited only by the transit time spread of<br />
the detector and directly delivers the decay<br />
functions in the time domain. Furthermore, the<br />
TCSPC method can be combined with a<br />
multiplexed detection which is ideally suited for<br />
scanning applications [6].<br />
The principle our TCSPC Lifetime Imaging module<br />
is shown in fig. 2.<br />
The module employs an advanced TCSPC<br />
technique featuring both high count rate and low<br />
differential nonlinearity. It contains the usual<br />
building blocks (CFDs, TAC, ADC) in the<br />
From PMT<br />
Start<br />
From Laser<br />
Stop<br />
From Microscope<br />
Scanning Unit<br />
Frame Sync<br />
Line Sync<br />
Pixel Clock<br />
<strong>Time</strong><br />
Measurement<br />
CFD<br />
CFD<br />
TAC<br />
ADC<br />
Scanning Interface<br />
Counter Y<br />
Counter X<br />
<strong>Time</strong><br />
within<br />
decay<br />
curve<br />
Location<br />
within<br />
scanning<br />
area<br />
Fig. 2: Principle of TCSPC Lifetime Imaging<br />
Y<br />
t<br />
Histogram<br />
Memory<br />
X<br />
2<br />
SPIE BIOS 2001, Multiphoton Microscopy in the Biomedical Sciences
‘reversed start-stop’ configuration together with a scanning interface and a large histogram memory integrated on one board.<br />
The TCSPC module receives the single photon pulses from the photomultiplier (PMT) of the microscope, the reference<br />
pulses from the laser and the Frame Sync, Line Sync and Pixel Clock signals from the scanning unit of the microscope. For<br />
each PMT pulse, i.e. for each photon, the TCSPC module determines the time of the photon within the laser pulse sequence<br />
and the location within the scanning area. These values are used to address the histogram memory in which the events are<br />
accumulated. Thus, in the memory the distribution of the photon density over X, Y, and the time within the fluorescence<br />
decay function builds up. The result can be interpreted as a two-dimensional (X, Y) array of fluorescence decay curves or as<br />
a sequence of fluorescence images for different<br />
times (t) after the excitation pulse.<br />
Due to memory size limitations the maximum<br />
number of time channels per pixel and the minimum<br />
time channel width depend on the image resolution.<br />
Some possible combinations are given in table 1.<br />
For an image resolution smaller than the resolution<br />
of the microscope scan, several adjacent pixels are<br />
binned into one pixel of the TCSPC image.<br />
image resolution t channels per pixel min. t channel width<br />
pixels<br />
ps<br />
256 x 256 64 52<br />
128 x 128 256 13<br />
64 x 64 1024 3.25<br />
32 x 32 4096 0.82<br />
1024, line scan 4096 0.82<br />
Table 1: Number of time channels and minimum time channel width for<br />
different image resolution<br />
The actual time resolution depends on the detector<br />
and is 300 ps to 500 ps (fwhm) with the PMTs typically built-in in the microscope, and 30 ps (fwhm) with external<br />
Microchannel Plate (MCP) detectors. Interestingly, there is practically no loss of photons in the TCSPC imaging process.<br />
Due to the short dead time of the TCSPC imaging module (180 ns) nearly all detected photons are processed and<br />
accumulated in the histogram.<br />
3. The TCSPC Scanning Microscope<br />
The general setup of the TCSPC microscope is shown in figure 3. A Ti:Sa laser delivers femtosecond pulses in the<br />
wavelength range from 780 nm to 900 nm. We used different Coherent and Spectra Physics systems with a pulse width from<br />
90 fs to 800 fs. The repetition rate was 76 or 82 MHz.<br />
Scanning Head<br />
TiSa Laser<br />
200 fs, 76 MHz<br />
780 nm to 900 nm, 200fs<br />
Preamp<br />
P1 .. P4:<br />
internal PMTs,<br />
descanned<br />
P4<br />
P3<br />
P1<br />
P2<br />
SPC-730 TCSPC Imaging Module<br />
SYNC<br />
Stop<br />
Start<br />
Preamp<br />
scan<br />
mirrors<br />
P5<br />
external PMT,<br />
non-descanned<br />
System Computer<br />
Pixel Clock, Line Sync, Frame Sync<br />
Scan Control<br />
Unit of<br />
Microscope<br />
Confocal Microscope<br />
Fig. 3: General setup of the TCSPC Laser Scanning Microscope<br />
SPIE BIOS 2001, Multiphoton Microscopy in the Biomedical Sciences 3
The microscope scans the sample in the x-y plane providing an image of the sample in the focal plane of the objective lens.<br />
3 D imaging is achieved by changing the depth of the focus in the sample. We used the Zeiss LSM-410, the LSM-510 in the<br />
Axiovert and the Axioplan version, and the Leica SP-1 and SP-2.<br />
The scanning heads of these microscopes have several detection channels equipped with variable confocal pinholes, filters,<br />
and photomultipliers (PMTs). The PMTs are small side-window tubes which give good sensitivity but not the optimum time<br />
resolution in the TCSPC mode. Unfortunately, replacing these PMTs with faster ones is difficult if not impossible. To get a<br />
high time resolution from the detection channel of a LSM-510 scanning head we used a fibre in place of one detector and fed<br />
the light to a Hamamatsu R3809U-50 MCP PMT.<br />
For two-photon excitation which does not require a pinhole, attaching a fast detector to the non-descanned port of the<br />
microscope is a better solution. We use the PMH-100-1 detector head of Becker & Hickl (transit time spread 150 ps) and<br />
the Hamamatsu R3809U-50 (transit time spread 30 ps). To get best performance from the R3809U-50 we use a Becker &<br />
Hickl HFAC-26-01 preamplifier. The instrument response functions for these detectors are shown in fig. 4 and fig. 5.<br />
fwhm=150ps fwhm=30ps<br />
Fig 4: System response for the PMH-100 detector<br />
Fig 5: System response for the R3809U-50 MCP<br />
If the non-descanned port is used problems can arise from incomplete blocking of scattered laser light. If the appropriate<br />
filters are not present in the microscope a suitable set of filters must be found and placed in front of the detector.<br />
Data acquisition is accomplished by the Becker & Hickl SPC-730 TCSPC Imaging module [6]. The CFD input receives the<br />
single photon pulses of the PMT. Synchronisation with the laser pulse sequence is achieved by the SYNC signal from the<br />
reference diode of the Ti:Sa laser.<br />
The SPC-730 module gets the scan control signals, Pixel Clock, Line Sync, and Frame Sync, from the scan controller of the<br />
microscope. Connecting the TCSPC module does not require any modifications in the microscope hardware and software.<br />
The scan parameters are controlled in the usual way via the microscope software. The normal scan speed, the zoom function,<br />
region of interest setting, etc. can be used also when recording lifetime images. Furthermore, the SPC-730 can be run in<br />
parallel with the standard image recording electronics of the microscope. Basically, steady state images and lifetime images<br />
in different spectral ranges can be obtained at the same time.<br />
Due to the simple interfacing the SPC-730 TCSPC Imaging module can be adapted to almost any laser scanning microscope.<br />
The only requirement is that Frame Sync and Line Sync signals with TTL or CMOS levels can be made available. The Pixel<br />
Clock signal is not absolutely required. If it is not available a pixel clock can be generated in the SPC-730 module. The cost<br />
for upgrading a microscope is about $ 17,000 to $ 30,000 ($ 15,000 for the imaging module plus $ 2000 to $ 15,000 for the<br />
detector).<br />
4. Results<br />
Fig. 6 shows a TCSPC image of a single cell layer (double staining with Hoechst for DNA and Alexa 488 for Tubulin)<br />
obtained by simultaneous two-photon excitation at 800 nm in a Zeiss LSM-510 Axioplan microscope. The detector was a<br />
PMH-100-1 at the non-descanned port giving an instrument response function of 150 ps fwhm. The overall acquisition time<br />
was 60 seconds at a count rate of about 10 5 photons per second. The intensity image containing the photons of all time<br />
channels is shown left.<br />
4<br />
SPIE BIOS 2001, Multiphoton Microscopy in the Biomedical Sciences
Deconvolution analysis delivers the fluorescence lifetime τ in the<br />
individual pixels of the image. This allows to generate intensity-τ<br />
images that display the fluorescence intensity and the fluorescence<br />
lifetime as brightness and colour (fig. 4, right). The quality of the fit<br />
is shown for two selected pixels (fig.4, bottom). The decay times of<br />
2.0 ns and 2.8 ns are clearly distinguished.<br />
Fig. 7 shows an intensity-τ image of the autofluorescence of human<br />
skin, obtained with two-photon excitation in a Zeiss LSM-410. The<br />
count rate was 25,000 / s. The two-photon fluorescence of melanin<br />
was found to be a potential tumor indicator [7]. Lifetime images can<br />
help to separate the melanin fluorescence from NADH or other<br />
fluorescence components.<br />
Fig. 8 was obtained with a Leica SP-1 and shows a Ca lifetime image<br />
of cortex neurons after Calcium Green injection. The count rate was<br />
10 5 / s. The lifetime of the Calcium Green is a direct measure of the<br />
calcium ion concentration. Therefore, lifetime images can avoid the<br />
intensity calibration normally used for Ca imaging.<br />
Fig. 9 shows cells containing CFP and YFP excited at 820 nm. The<br />
count rate was 20,000 /s. The microscope was an LSM-410 Axiovert<br />
Fig. 6: Intensity image (top left), intensity-τ image (top<br />
right) and fitted curves<br />
2<br />
FRET<br />
1<br />
1 ns Lifetime 3 ns 1 ns<br />
Lifetime<br />
5 ns<br />
500ps<br />
Fig. 7: Autofluorescence of human skin.<br />
Zeiss LSM-410, 2-photon excitation<br />
Fig. 8: Ca image of cortex neurons. Leica<br />
SP-1, 2-photon excitation<br />
Fig 9: FRET in cells containing CFP and<br />
YFP. Zeiss LSM-410, 2-photon excitation<br />
with a Hamamatsu R3809U-50 MCP attached to the non-descanned port. To<br />
suppress the excitation light and to select the fluorescence wavelength we used<br />
three 720 nm short pass filters (SWP-BL-720, Delta Light & Optics) and a<br />
440 - 490 nm bandpass filter.<br />
In this example, CFP acts as a donor and YFP as an acceptor for FRET. The CFP<br />
fluorescence is therefore quenched in the places where FRET occurs. The<br />
fluorescence in these places shows double exponential decay which cannot be<br />
displayed by a simple colour coding. Therefore, green was used for the short<br />
lifetime and red for the long lifetime component. The colours were mixed<br />
according to the relative intensities of the components. The decay curves of<br />
selected areas are shown in fig. 10.<br />
The acquisition times for the lifetime images shown above were in the range from<br />
30 seconds to 20 minutes. Although simple intensity images are obtained by<br />
TCSPC imaging in the same time as with the standard recording electronics of<br />
Fig 10: Decay functions of selected areas<br />
of fig. 9<br />
1<br />
2<br />
SPIE BIOS 2001, Multiphoton Microscopy in the Biomedical Sciences 5
the microscope, such images do not contain enough photons for lifetime analysis. Basically, the acquisition time could be<br />
decreased by increasing the laser power and thus the photon count rate. The SPC-730 module allows count rates up to some<br />
10 6 photons per second which would decrease the acquisition time by a factor of 10 to 100. However, for living cells the<br />
limitation is the stability of the sample [1] which usually restricts the count rate to values less than 10 5 / s. Therefore, the<br />
only way to decrease the acquisition time is to confine the scanning area to a small region of interest. Since the acquisition<br />
time scales down with the number of pixels, reasonable data for an area in the order of 4 x 4 pixels can be obtained in less<br />
than 100 ms.<br />
Conclusions<br />
The results show the potential of TCSPC Laser Scanning Microscopy as a new method of fluorescence lifetime imaging. The<br />
field of application covers energy transfer measurements (Fluorescence Resonance Energy Transfer, FRET), Ca imaging,<br />
separation of multiple fluorescent labels, imaging of the autofluorescence of cells, and other fluorescence imaging<br />
applications of microscopic samples.<br />
Acknowledgements<br />
We are indebted to Thomas Behnisch, Istitut für Neurobiologie Magdeburg, Christoph Biskup, Klinikum der FSU Jena,<br />
Physiologisches Institut II, Zeiss Jena GmbH and Leica GmbH in Mannheim for cooperation and making available their<br />
microscopes and samples for the experiments.<br />
References<br />
[1] K. König, P.T.C. So, W.W. Mantulin, B.J. Tromberg, E. Gratton, Two-<strong>Photon</strong> excited lifetime imaging of<br />
autofluorescence in cells during UVA and NIR photostress. J. Microsc. 183, 197-204<br />
[2] C.J.R. Vanderoord, G.R. Jones, D.A. Shaw, I.H. Munro, Y.K.Levine, H.C. Gerritsen, High resolution confocal<br />
microscopy using synchrotron radiation. J. Microsc. 182, 217-224<br />
[3] P.T.C. So, T. French, W.M.Yu, K.M. Berland, C.Y. Dong, E. Gratton, <strong>Time</strong>-resolved fluorescence microscopy using<br />
two-photon excitation. Bioimaging, 3, 1-15<br />
[4] J. Sytsma, J.M. Vroom, C.J. de Grauw, H.C. Gerritsen, <strong>Time</strong>-Gated lifetime imaging and micro-volume spectroscopy<br />
using two-photon excitation. J. Microsc. 191, 39-51<br />
[5] I. Bugiel, K. König, H. Wabnitz, Investigations of cells by fluorescence laser scanning microscopy with subnanosecond<br />
resolution. Lasers in the Life Sciences 3, 47-53<br />
[6] Becker & Hickl GmbH, SPC-300 through SPC-730 Operating manual. www.becker-hickl.de<br />
[7] K. Teuchner, J. Ehlert, W. Freyer, D. Leupold, P. Altmeyer, M. Stücker, K. Hoffmann. Fluorescence studies of melanin<br />
by stepwise two-photon femtosecond laser excitation. J. Fluoresc. 10, 275-281<br />
Author Information:<br />
Wolfgang Becker Axel Bergmann Karsten König Uday Tirlapur<br />
www.becker-hickl.de www.becker-hickl.de www.mti.uni-jena.de www.mti.uni-jena.de<br />
becker@becker-hickl.de bergmann@becker-hickl.de kkoe@mti-n.mti.uni-jen.de utir@mti-n.mti.uni-jen.de<br />
6<br />
SPIE BIOS 2001, Multiphoton Microscopy in the Biomedical Sciences
FRET Imaging by Picosecond TCSPC Laser Scanning<br />
Microscopy<br />
Wolfgang Becker, Axel Bergmann<br />
Becker & Hickl GmbH, Nahmitzer Damm 30, D-12277 Berlin, Germany<br />
info@becker-hickl.com<br />
Klaus Benndorf , Christoph Biskup, Thomas Zimmer<br />
Friedrich-Schiller-University, Institute of Physiology II, D-07740 Jena, Germany<br />
cbis@mti-n.uni-jena.de<br />
Abstract<br />
A new <strong>Time</strong>-<strong>Correlated</strong> <strong>Single</strong> <strong>Photon</strong> <strong>Counting</strong> (TCSPC) imaging technique in conjunction with a<br />
two-photon laser scanning microscope was used to obtain FRET lifetime data from living cells. Double<br />
exponential decay analysis separates the FRET fluorescence from the fluorescence of the unquenched<br />
donor molecules. By using the intensity ratio of the quenched and the unquenched donor fluorescence<br />
images are created that show the size of the FRET in different regions of the cell.<br />
Instrumentation<br />
Recording of time-resolved fluorescence images was achieved by combining a confocal laser scanning<br />
microscope (Zeiss LSM-510 Axiovert), a femtosecond Coherent titanium sapphire laser and an SPC-730<br />
time-correlated single photon counting (TCSPC) imaging module developed by Becker & Hickl, Berlin.<br />
The fibre output option of the LSM-510 was used to connect an ultra-fast MCP-PMT (Hamamatsu<br />
R3809U) for TCSPC detection.<br />
The principle of the TCSPC<br />
imaging technique used in the SPC-<br />
730 is shown in fig. 1. The module<br />
contains the usual building blocks<br />
(CFDs, TAC, ADC) in the ‘reversed<br />
start-stop’ configuration together with<br />
a scanning interface and a large<br />
histogram memory integrated on one<br />
board. It receives the single photon<br />
pulses from the photomultiplier<br />
(PMT), the reference pulses from the<br />
laser and the Frame Sync, Line Sync<br />
and Pixel Clock signals from the<br />
scanning unit of the microscope. For<br />
each PMT pulse, i.e. for each photon,<br />
the TCSPC module determines the<br />
time of the photon within the laser<br />
pulse sequence and the location within<br />
From PMT<br />
Start<br />
From Laser<br />
Stop<br />
Line Sync<br />
Pixel Clock<br />
<strong>Time</strong><br />
Measurement<br />
CFD<br />
CFD<br />
From Microscope<br />
Scanning Unit<br />
Scanning Interface<br />
Frame Sync<br />
Location<br />
within<br />
scanning<br />
area<br />
Histogram<br />
Memory<br />
the scanning area. These values are used to address the histogram memory in which the events are<br />
accumulated. Thus, in the memory the distribution of the photon density over X, Y, and the time within the<br />
fluorescence decay function builds up.<br />
The data acquisition runs with the full scanning speed of the microscope. Due to the short dead time of<br />
the TCSPC imaging module (180 ns) there is practically no loss of photons in the TCSPC imaging process.<br />
The time resolution with the R3809U MCP is < 30ps (FWHM).<br />
TAC<br />
ADC<br />
Counter Y<br />
Counter X<br />
SPC-730<br />
TCSPC Imaging Module<br />
<strong>Time</strong><br />
within<br />
decay<br />
curve<br />
Fig. 1: Principle of the TCSPC Lifetime Imaging module<br />
Y<br />
t<br />
X<br />
CLEO / QELS, Baltimore, May 6-10, 2001 1
Results<br />
Fig. 2 shows HEK cells containing CFP and YFP in the α and β1 subunits of the Na channels. Fig. 2a<br />
shows an intensity image of the donor fluorescence obtained by summing the photons from all time<br />
channels of the individual pixels. Fig. 2b shows an intensity-lifetime image built up from the fluorescence<br />
intensity as brightness and the average decay time obtained by single exponential analysis as colour.<br />
Fig. 2b clearly shows lifetime differences throughout the image of the cell.<br />
1<br />
2<br />
1ns<br />
2ns<br />
Fig. 2a: Intensity image of donor (CFP)<br />
Fig. 2b: Intensity-Lifetime Image of Donor CFP<br />
Fig. 3a shows the decay functions of selected pixels of fig. 2b. The decay is clearly not mono-exponential.<br />
Double exponential decay analysis reveals a fast lifetime component of about 0.37 ns and a slow<br />
component of 1.84 ns to 2.09 ns. The fast component most likely comes from the quenched CFP molecules<br />
while the slow component is fluorescence from the unquenched CFP and perhaps some YFP fluorescence.<br />
Both components are found anywhere in the image. However, the ratio of the intensity coefficients of the<br />
components differs considerably between regions with strong FRET and ‘normal’ regions (fig 3b).<br />
66<br />
71<br />
1<br />
2<br />
FRET<br />
normal<br />
34<br />
29<br />
short long<br />
short long<br />
Fig. 3a: Fluorescence decay curves of selected pixels<br />
Fig. 3b: Relative intensity of fast and<br />
slow fluorescence component<br />
Using the ratio of the intensity coefficients of the lifetime components as an indicator for FRET, we created<br />
imaged showing the size of the FRET as colour and the intensity as brightness. The result is shown in<br />
2<br />
CLEO / QELS, Baltimore, May 6-10, 2001
fig. 4. It shows a lot of detail not visible in the pure intensity image and more contrast than the lifetime<br />
image obtained from the average lifetime.<br />
0.5 fast / slow<br />
2.0<br />
Fig. 4: FRET image built up from intensity (brightness) and ratio of coefficients of fast and slow decay<br />
component (colour)<br />
Conclusions<br />
A new TCSPC imaging technique in conjunction with a scanning microscope yields high quality<br />
fluorescence lifetime data. Applied to FRET in living cells, the technique delivers the decay components of<br />
the quenched and unquenched donor molecules. The ratio of the intensity coefficients of the quenched and<br />
the unquenched fluorescence component can be used to build up images that show the size of the FRET<br />
effect in the individual parts of the cell. The images show detail not visible in pure intensity images and<br />
better contrast than images created from the average lifetime.<br />
CLEO / QELS, Baltimore, May 6-10, 2001 3
REVIEW OF SCIENTIFIC INSTRUMENTS VOLUME 70, NUMBER 3 MARCH 1999<br />
<strong>Time</strong>-resolved detection and identification of single analyte molecules<br />
in microcapillaries by time-correlated single-photon counting „TCSPC…<br />
W. Becker and H. Hickl<br />
Becker & Hickl GmbH, Kolonnenstr. 29, 10829 Berlin, Germany<br />
C. Zander and K. H. Drexhage<br />
Institut für Physikalische Chemie, Universität-Gesamthochschule Siegen, Adolf-Reichwein-Str. 3,<br />
57068 Siegen, Germany<br />
M. Sauer, a) S. Siebert, and J. Wolfrum<br />
Physikalisch-Chemisches Institut, Universität Heidelberg, Im Neuenheimer Feld 253,<br />
69120 Heidelberg, Germany<br />
Received 6 October 1998; accepted for publication 3 December 1998<br />
A PC plug-in card for on-line time resolved fluorescence detection of single dye molecules based on<br />
a new time-correlated single photon counting TCSPC module is described. The module contains<br />
all electronic components constant fraction discriminators CFDs, time-to-amplitude converter<br />
TAC, analog-to-digital converter ADC, multichannel analyzer MCA timers on board required<br />
for TCSPC. A fast TAC design in combination with a fast flash ADC and an error-correcting<br />
ADC/MCA principle results in a maximum count rate of 8 MHz dead time 125 ns. A dual memory<br />
architecture allows for unlimited recording of decay curves with collection times down to 150 s<br />
without time gaps between subsequent recordings. Applying a short-pulse diode laser emitting at<br />
640 nm with a repetition rate of 60 MHz in combination with a confocal microscope, we studied<br />
bursts of fluorescence photons from individual dye labeled mononucleotide molecules Cy5-dCTP<br />
in a cone shaped microcapillary with an inner diameter of 0.5 m at the end of the tip. The flow of<br />
the conjugates was controlled by electrokinetic forces. The presented technique permits the counting<br />
and identification of all labeled analyte molecules present in a given sample due to their<br />
characteristic velocities, burst sizes, and fluorescence decay times. © 1999 American Institute of<br />
Physics. S0034-67489903503-0<br />
I. INTRODUCTION<br />
In recent years, several scientific groups achieved the<br />
capability to detect individual fluorescent molecules in liquids<br />
using laser induced fluorescence techniques. 1–10 Due to<br />
the improvements of the instrumentation, different dye molecules<br />
have been identified in solvents on the singlemolecule<br />
level by their characteristic fluorescence decay<br />
times 11–15 and spectral properties. 4,16 Besides the implication<br />
of this highly sensitive detection techniques for the identification<br />
of various analyte molecules in diluted solutions, the<br />
fluorescence characteristics of individual dye molecules in<br />
specific local environments, i.e., the dynamic aspects, are of<br />
particular interest for different biological applications. 17–20<br />
In all applications of the single-molecule detection technique,<br />
it is desirable to count and identify each molecule<br />
present in a given sample with comparable efficiency. Therefore,<br />
great efforts have been made to construct a light barrier<br />
on the single-molecule level using laser induced fluorescence<br />
where all molecules have to pass. 21–23 Unfortunately, here a<br />
drawback is associated with the use of a femto liter detection<br />
volume which is generally applied in confocal fluorescence<br />
microscopy of single molecules. In order to direct the flow of<br />
all molecules through the detection area microcapillaries or<br />
-channels with inner diameters smaller than the detection<br />
area 1 m have to be used. Unfortunately, a drawback is<br />
associated with the use of such small channels, namely<br />
strong adsorption of the analyte molecules to the wall due to<br />
the relatively great surface-to-volume ratio. On the other<br />
hand, if the adsorption can be efficiently suppressed by addition<br />
of detergents or additives, the use of such channels<br />
makes it possible to manipulate the motion of single molecules<br />
by electrokinetic, electro-osmotic, or capillary forces.<br />
Recently, 24 we were able to demonstrate the time-resolved<br />
identification of individual labeled mononucleotide molecules<br />
as they flow through a microcapillary with an inner<br />
diameter of 500200 nm. Furthermore, we showed that by<br />
addition of Tween 20, i.e., a nonionic detergent, adsorption<br />
of negatively charged analyte molecules to the capillary wall<br />
could be neglected. Hence, the flow of the negatively<br />
charged conjugates could be established by electrokinetic<br />
forces. Identification of the labeled mononucleotide molecules<br />
was performed by time-correlated single-photon<br />
counting TCSPC using a PC plug-in card with a minimum<br />
integration time of 600 s and a dead time of several seconds<br />
between subsequent cycles of up to 128 histograms.<br />
However, for on-line identification of each analyte molecule<br />
by the characteristic burst length, fluorescence decay<br />
time, and burst size a TCSPC-card with high acquisition rate<br />
and short integration times without dead times between suba<br />
Electronic mail: sauer@sun0.urz.uni-heidelberg.de<br />
0034-6748/99/70(3)/1835/7/$15.00 1835<br />
© 1999 American Institute of Physics
1836 Rev. Sci. Instrum., Vol. 70, No. 3, March 1999 Becker et al.<br />
prevent adsorption at the glass surface and to diminish the<br />
electro-osmotic flow. 25 Cy5-dCTP Amersham Life Science,<br />
Braunschweig, Germany served as analyte molecule and<br />
was used without further purification. <strong>Single</strong>-molecule solutions<br />
were prepared by diluting a 10 6 M stock solution with<br />
an appropriate amount of solvent down to the required concentration.<br />
To avoid blocking of the tip, all solutions were<br />
filtered through a 20 nm filter prior to injection into the femtotip.<br />
The flow of the negatively charged analyte molecules<br />
Cy5-dCTP through the femtotip was established by electrokinetic<br />
forces using two platinum electrodes. The cathode<br />
was inserted into the microcapillary and the anode was<br />
dipped into the solvent of the tissue culture dish.<br />
FIG. 1. Schematic diagram of the optical and electronic apparatus.<br />
sequent cycles has to be used. In this article, we present<br />
time-resolved detection and identification of each labeled<br />
mononucleotide molecule Cy5-dCTP passing the detection<br />
volume by TCSPC in a microcapillary using a new developed<br />
PC plug-in card for TCSPC.<br />
II. EXPERIMENT<br />
A. <strong>Single</strong>-molecule apparatus and solvents<br />
A schematic diagram of the used experimental setup is<br />
shown in Fig. 1. A pulsed diode laser 640 nm served as<br />
excitation source. This system provided pulses of less than<br />
400 ps full width at half maximum duration with a repetition<br />
rate of 60 MHz. The laser beam passes an excitation filter<br />
639DF9; Omega Optics, Brattleboro, VT and entered an<br />
inverse microscope Axiovert 100 TV, Zeiss, Germany<br />
through the back port and was coupled into an oil-immersion<br />
objective 100NA1.4; Olympus, Tokyo, Japan by a dichroic<br />
beam splitter. Measurements were done with an average<br />
laser power of 630 W at the sample. The fluorescence<br />
signal was collected by the same objective, filtered by two<br />
bandpass filters 675DF50, Omega Optics, Brattleboro, VT;<br />
680HQ65, AF Analysentechnik, Tübingen, Germany and<br />
imaged onto a 100 m pinhole oriented directly in front of<br />
the avalanche photodiode AQ-131, EG&G Optoelectronics,<br />
Canada.<br />
Measurements in open volumes were performed by using<br />
microscope slides with a small depression. 15 To ensure<br />
the detection of each analyte molecule, a cone shaped capillary<br />
with an inner diameter of about 0.50.2 m at the very<br />
end of the tip Femtotip, Eppendorf-Nethler-Hinz GmbH,<br />
Hamburg, Germany was used. The capillary dips into a tissue<br />
culture dish that contains pure glycerol. The small end of<br />
the capillary ID0.5 m was adjusted to meet the focus of<br />
the exciting laser beam by the use of a three-axis (xyz) electrostrictive<br />
actuator 20 nm resolution and a charge coupled<br />
device camera. As solvent inside of the capillary, a 20 mM<br />
Tris-borate buffer pH 8.4 containing 65% water, 30% glycerol,<br />
and 5% Tween 20 was used. Tween 20 was added to<br />
B. TCSPC system<br />
All time-resolved measurements were carried out in the<br />
reverse mode, i.e., the detector signal served as the start signal,<br />
whereas the laser pulse was used as the stop pulse. The<br />
instrument response function of the entire system was measured<br />
to be 420 ps.<br />
1. Detector and synchronization channel<br />
The principle of the TCSPC module SPC-430 is shown<br />
in Fig. 2. The single-photon pulses from the avalanche photodiode<br />
are fed to the input DETECT. To avoid an influence<br />
of amplitude jitter of the detector input pulses a constant<br />
fraction discriminator CFD is used to provide a well defined<br />
start pulse for the time-to-amplitude converted TAC.<br />
The synchronization signals stop pulse generated by the<br />
pulse generator of the laser diode are fed to the input SYNC.<br />
To improve the timing of the synchronization signal also, the<br />
SYNC circuit contains a CFD. In addition, an adjustable frequency<br />
divider with ratios from 1:1 to 1:16 is implemented.<br />
Divider ratios greater than one can be used to record several<br />
periods of the light signal.<br />
2. <strong>Time</strong>-to-amplitude converter<br />
The TAC operates in the reversed start-stop mode. By<br />
this mode, the speed requirements of the TAC can be reduced<br />
because the cycle rate is controlled by the photon detection<br />
rate instead of the considerably higher repetition rate<br />
of the laser. The TAC output voltage is fed to a programmable<br />
gain amplifier PGA. The PGA is used to amplify the<br />
interesting part of the TAC signal and can be adjusted by a<br />
gain and offset option so that the chosen part of the signal<br />
covers the complete ADC range. The speed limiting device<br />
is the PGA. Therefore, it is essential to have a very small<br />
settling time. The employed PGA has a settling time of less<br />
than 40 ns, even if the output voltage returns from saturation.<br />
To increase the effective count rate especially at high PGA<br />
gains, the output voltage of the PGA is checked by a window<br />
discriminator WD which rejects the processing of events<br />
outside of the selected time window. The TAC, the PGA, the<br />
WD, and the associated control circuits, as well as, the CFD<br />
and the SYNC circuit are integrated in compact hybrid circuits.<br />
The small size of all circuits reduces crosstalk between<br />
the start and the stop channel, which is essential to achieve a
Rev. Sci. Instrum., Vol. 70, No. 3, March 1999<br />
Becker et al.<br />
1837<br />
FIG. 2. Block diagram of the PC-interface card SPC-430.<br />
small differential nonlinearity. Besides, the hybrid circuits<br />
reduce speed losses due to signal distortions on interconnection<br />
lines.<br />
3. Analog-to-digital converter<br />
The ADC converts the amplified TAC signal into a<br />
memory address MEM. As in all TCSPC systems, the ADC<br />
must work with an extremely high accuracy. The ADC has a<br />
resolution from 64 to 4096 time channels and the width of<br />
each particular channel has to be constant within 1%–2%.<br />
This requires a ‘‘no missing code’’ accuracy of more than 18<br />
bits which is not achievable with conventional fast ADCs<br />
which are, however, required to achieve a high count rate. In<br />
the SPC-430 module, the problem is solved by the use of a<br />
fast flash ADC with 12 bit no missing code accuracy in combination<br />
with a proprietary error correction method. The basic<br />
idea of this method is the implementation of a variable<br />
offset on the TAC characteristics referred to the ADC characteristics<br />
Fig. 3. Thus, each photons event is converted at<br />
a slightly different position of the ADC characteristics resulting<br />
in an averaging of the errors of the ADC characteristics<br />
and a considerable reduction of the difference of the particular<br />
ADC steps. The arrangement is shown in Fig. 3. The<br />
digital-to-analog converter DAC is used to shift the TAC<br />
output voltage up and down on the ADC characteristics and<br />
is controlled by a counter which counts the start pulses of the<br />
TAC. Consequently, the DAC generates a sawtooth that increases<br />
by one DAC step at each recording of a photon. The<br />
DAC voltage is added to the TAC output voltage and the<br />
resulting signal is converted by the ADC. To restore the<br />
correct address byte for the memory, the counter bits are<br />
subtracted from the ADC result in a digital subtraction circuit.<br />
Of course, each address byte still contains an unavoidable<br />
deviation of the particular ADC step from the correct<br />
value. However, there is a significant difference to a direct<br />
ADC conversion in that the error is now different for different<br />
photons, even if the photons appeared at equal times and<br />
caused equal TAC voltages. Hence, the averaging of the individual<br />
errors results in a smoothing of the effective ADC<br />
characteristics.<br />
The obtained improvement of the conversion accuracy<br />
depends on the number of ADC steps N ADC over which the<br />
signal is shifted by the DAC voltage. Additionally, the accuracy<br />
depends on the distribution of errors of the ADC char-<br />
FIG. 3. A/D conversion of the SPC-<br />
430 with error correction.
1838 Rev. Sci. Instrum., Vol. 70, No. 3, March 1999 Becker et al.<br />
TABLE I. Number of decay curves in the memory banks and minimum<br />
collection times per decay curve for gap-free measurements using a Pentium<br />
200 processor.<br />
ADC resolution<br />
Number of channels<br />
Number of curves<br />
in one memory bank<br />
Minimum collection<br />
time/curve without gaps ms<br />
64 2048 0.15<br />
256 512 0.60<br />
1024 128 2.40<br />
4096 32 9.60<br />
acteristics. If the error of an ADC step is not correlated to the<br />
errors of adjacent steps the improvement is (N ADC ) 1/2 . However,<br />
in real flash ADCs the errors appear periodically with<br />
periods of 4, 8, and 16 low significant byte. If a DAC amplitude<br />
is used which corresponds to a multiple of this value,<br />
the improvement in accuracy is considerably higher than<br />
(N ADC ) 1/2 .<br />
4. Memory control<br />
Differing from conventional TCSPC devices, the data<br />
memory in the SPC-430 module consists of two memory<br />
banks with 128 k words, respectively. Depending on the selected<br />
ADC resolution 64, 256, 1024, or 4096 time channels<br />
in each memory bank 2048, 512, 128, or 32 data<br />
blocks, i.e., decay curves, can be stored. Within a selected<br />
memory bank and data block, respectively, the buildup of the<br />
histogram is done by the usual method. When a photon is<br />
detected, the contents of the addressed location of the MEM<br />
is increased by a fixed increment. This is done by the ADD<br />
circuit. Values greater than 1 can be added to get full scale<br />
recordings in short collection times, e.g., for oscilloscope or<br />
single-molecule applications.<br />
For single-molecule detection and similar applications a<br />
timer controlled sequencer logic is provided which automatically<br />
switches through all available data blocks. When the<br />
current memory bank has been filled with decay curves, the<br />
measurement continues in the other memory bank. While the<br />
measurement runs in one memory bank, the data from the<br />
other bank were read out and written to the hard disk of the<br />
computer. As long as the data stream is fast enough to read<br />
one complete memory bank before the other one is filled,<br />
subsequent decay curves can be measured without gaps between<br />
the curves. The minimum collection integration<br />
times per decay curve for a gap-free measurement for a Pentium<br />
200 processor are given in Table I.<br />
Multichannel-scalar MCS traces were generated by<br />
adding up all photons collected per integration time in an<br />
applied time window.<br />
III. RESULTS AND DISCUSSION<br />
Figure 4 shows a section of a data block derived by<br />
time-resolved fluorescence measurement of a 10 11 M aqueous<br />
solution 20 mM aqueous Tris-borate buffer pH 8.4, 30%<br />
glycerol, 5% Tween 20 Cy5-dCTP in an open volume. The<br />
integration time was set to be 1 ms per decay. The measurement<br />
was performed with an ADC resolution of 64 channels<br />
à 0.25 ns allowing 2048 decay curves to be collected in one<br />
FIG. 4. Raw TCSPC fluorescence data recorded with the plug-in card SPC-<br />
430 from a 10 11 M aqueous solution of Cy5-dCTP 65% 20 mM Trisborate<br />
buffer pH 8.4, 30% glycerol, 5% Tween 20 using a collection time<br />
of 1 ms per decay curve. Excitation power: 630 W at the sample, ADC<br />
resolution: 64 channels à 0.25 ns. Approximately 50 ms after the start of the<br />
experiment a Cy5-dCTP molecule passes the detection volume and a decay<br />
curve containing about 200 fluorescence photons is received within 1 ms in<br />
the applied time-window of 16 ns.<br />
memory bank Table I. As can be seen, at approximately 50<br />
ms after start of the experiment, a single Cy5-dCTP molecule<br />
passes the detection volume and about 200 photons are<br />
detected within 1 ms. With the chosen channel width, 25<br />
photons were collected in the maximum channel by using a<br />
fluorescent dye Cy5 with a relatively short fluorescence<br />
decay time in this solvent of 1.3 ns. 24 In Fig. 5, MCS-traces<br />
3 ms per decay curve are formed from the recorded data<br />
measured at the same sample. Figure 5a shows the MCS<br />
trace observed from the same sample in an open volume. In<br />
Figs. 5b–5f, the sample is measured flowing through the<br />
thin end in the microcapillary at different applied voltages.<br />
With the setup described, an average background of 2 kHz<br />
was obtained in the solvent system at hand in an open volume.<br />
This background arises mainly from Raman scattered<br />
photons passing the emission filter simultaneously with the<br />
excitation pulse. The same background rate was obtained in<br />
the microcapillary at the thin end of the tip. On the basis of<br />
this background, we calculate signal-to-background ratios<br />
S/B of up to 200 for the most intense peaks. It should be<br />
noted that in case of an open volume the analyte molecules<br />
move in and out of the detection volume due to their Brownian<br />
motion. Hence, most analyte molecules will cross the<br />
detection volume at the edge resulting in small burst sizes.<br />
However, if the detection took place inside of a microcapillary<br />
with an inner diameter smaller than the detection area of<br />
the optical system, all analyte molecules should be excited<br />
and detected very efficiently. In addition. Figs. 5b–5f<br />
demonstrates that a control of the analyte movement towards<br />
the anode is possible by applying different voltages. On the<br />
one hand, the number of analyte molecules passing the detection<br />
area increases with increasing voltage. Simultaneously,<br />
the velocities increase thereby decreasing the burst<br />
size.<br />
To study the burst size, the fluorescence decay time, and
Rev. Sci. Instrum., Vol. 70, No. 3, March 1999<br />
Becker et al.<br />
1839<br />
FIG. 5. Fluorescence signals observed from a 10 11 M solution of Cy5-dCTP in 65% 20 mM Tris-borate buffer pH 8.4, 30% glycerol, 5% Tween 20 with an<br />
integration time of 3 ms per bin. the data were collected with the PC-module SPC-430 for TCSPC and converted into MCS traces. a Open volume, b, c,<br />
d, e, and f microcapillary at different applied voltages of 2, 5, 9, 15, and 30 V, respectively.<br />
the burst length of each individual burst, we used a burst<br />
recognition procedure. To suppress the background 2 kHz<br />
efficiently, only bursts with a count rate higher than 10 kHz<br />
were utilized. The starting and the end point of a burst were<br />
defined by a count rate of 5 kHz. For the case that two count<br />
rate maxima fall into the same time interval, we split the<br />
bursts at the minimum count rate between them. For the<br />
following statistics we used more than 4000 single-molecule<br />
events measured at different applied voltages, respectively.<br />
Figures 6a–6c show the histograms of the burst sizes, the<br />
fluorescence lifetimes, and the burst lengths of Cy5-dCTP<br />
molecules measured in the microcapillary at 5 V with an<br />
integration time of 500 s/bin and an ADC resolution of 64<br />
channels à 0.25 ns. As shown in Figs. 6a and 6c, we<br />
determine an average burst size of 141 counts maximum<br />
frequency 110 counts and an average burst length of 5 ms<br />
maximum frequency 3.5 ms at an applied voltage of 5 V.<br />
Using this data, we calculate an average S/B of 14 S/B17<br />
using the frequency maxima for individual Cy5-dCTP measured<br />
in a microcapillary with an inner diameter of 500200<br />
nm. With a diameter of the detection area of 1 m, we calculate<br />
a flow speed of about 0.3 mm/s for Cy5-dCTP molecules<br />
in the described solvent at a voltage of 5 V. The<br />
fluorescence decay time determination of the single-
1840 Rev. Sci. Instrum., Vol. 70, No. 3, March 1999 Becker et al.<br />
FIG. 6. a Burst size, b fluorescence decay time, and c burst length<br />
distribution measured on a 10 11 M solution of Cy5-dCTP flowing through<br />
the microcapillary at an applied voltage of 5 V. Data acquisition was performed<br />
with PC-module SPC-430 with an integration time of 0.5 ms per<br />
decay curve, ADC resolution of 64 channels, number of decay curves in one<br />
memory bank: 2048, 100 cycles, corresponding to a time period of 102.4 s<br />
without any loss of data.<br />
molecule events was realized by a monoexponential maximum<br />
likelihood estimator MLE using the following<br />
relation: 26<br />
1e T/ 1 1 me mT/ 1 1 N 1 i1<br />
iN i ,<br />
m<br />
1<br />
where T is the width of each channel, m the number of utilized<br />
time channels, N the number of photon counts taken<br />
into account, and N i the number of photon counts in channel<br />
i. The parameters used to determine the decay time are<br />
m50, T0.25 ns. To calculate the experimental standard<br />
deviation exp the obtained fluorescence decay times were<br />
plotted against their frequency Fig. 6b. Applying a<br />
Gaussian fit to the fluorescence decay time distribution results<br />
in a fluorescence decay time of 1.45 ns with an<br />
experimental standard deviation exp 0.14 ns, which is in<br />
good agreement with the fluorescence decay time of Cy5-<br />
dCTP measured in bulk solutions in the same solvent ( bulk<br />
1.3 ns). 24<br />
In Fig. 7a, the number of detected bursts per second<br />
observed from a 10 11 M Cy5-dCTP solution in a microcapillary<br />
at different applied voltages are shown. As expected<br />
from Fig. 5 with increasing voltage the number of detected<br />
analyte molecules increases linear up to an applied voltage of<br />
30 V. In addition, also the velocity of the analyte molecules<br />
through the detection volume with a diameter of 1 m is<br />
proportional to the voltage Fig. 7b. Since in an open volume<br />
most analyte molecules pass at the edge of the detection<br />
volume, the measured average diffusion time of 0.9 ms 24<br />
corresponding to a velocity of 1.1 mm/s is shorter than the<br />
average value obtained from analyte molecules passing the<br />
detection volume in the microcapillary due to electrokinetic<br />
forces. In the microcapillary, all analyte molecules have to<br />
cross at the center of the detection volume with a diameter of<br />
1 m. This indicates that we deal essentially with a<br />
1-dimensional diffusion, i.e., our detection volume perpendicular<br />
to the flow direction is not defined by the confocal<br />
system but by the capillary walls. Hence, all analyte molecules<br />
cross the center of the detection area with a diameter<br />
of 1 m, i.e., the measured average diffusion time is longer<br />
corresponding to a slower velocity than in open volumes.<br />
FIG. 7. a Detected bursts per second, and b velocities of Cy5-dCTP<br />
molecules (10 11 M) measured in the microcapillary with a collection time<br />
of 0.5 ms pr decay curve at different applied voltages. The velocity of the<br />
analyte molecules through the detection volume was calculated from the<br />
maximum frequency obtained from the burst length distribution shown in<br />
Fig. 6b and a diameter of the detection area of 1 m.<br />
IV. DISCUSSION<br />
<strong>Counting</strong> and time-resolved identification of individual<br />
labeled analyte molecules in a microcapillary with an inner<br />
diameter of 500200 nm have been demonstrated. As<br />
shown, the characteristic flow velocity of negatively charged<br />
analyte molecules in the capillary is proportional to the applied<br />
electrical field and is slower than the velocity measured<br />
in an open volume element. 24 This behavior can be addressed<br />
to 1-dimensional diffusion characteristics indicating that the<br />
adsorption of the analyte molecules on the glass surface can<br />
be neglected by addition of Tween 20. Furthermore, the electroosmotic<br />
flow is drastically reduced allowing a control of<br />
the motion of negatively charged molecules towards the anode.<br />
By the use of a new PC plug-in card SPC-430 the<br />
fluorescence decay times, burst sizes, and burst lengths, i.e.,<br />
diffusion times, can be measured for each individual analyte<br />
molecule present in a given sample. The results presented<br />
demonstrate new possibilities for time-resolved single strand<br />
DNA sequencing 9 and other important bioanalytical applications<br />
such as highly sensitive detection of ribonucleic acid,<br />
DNA sequences or proteins due to different electrophoretic<br />
mobilities of bound and free labeled primers and antibodies,<br />
respectively, in the microcapillary.
Rev. Sci. Instrum., Vol. 70, No. 3, March 1999<br />
Becker et al.<br />
1841<br />
ACKNOWLEDGMENTS<br />
The authors would like to thank the Bundesministerium<br />
für Bildung, Wissenschaft, Forschung und Technologie for<br />
financial support under grants Nos. 0311371, 0310793A and<br />
the Duetsche Forschungsgemeinschaft under Grant No. Wo<br />
175/30-1. The financial support of Boehringer Mannheim<br />
GmbH is also gratefully acknowledged.<br />
1 D. C. Nguyen, R. A. Keller, J. H. Jett, and J. C. Martin, Anal. Chem. 59,<br />
2158 1987.<br />
2 K. Peck, L. Stryer, A. N. Glazer, and R. A. Mathies, Proc. Natl. Acad. Sci.<br />
USA 86, 4087 1989.<br />
3 E. B. Shera, N. K. Seitzinger, L. M. Davis, R. A. Keller, and S. A. Soper,<br />
Chem. Phys. Lett. 174, 553 1990.<br />
4 S. A. Soper, L. M. Davis, and E. B. Shera, J. Opt. Soc. Am. B 9, 1761<br />
1992.<br />
5 M. Eigen and R. Rigler, Proc. Natl. Acad. Sci. USA 91, 5740 1994.<br />
6 R. Rigler and Ü. Mets, J. Fluoresc. 4, 259 1994.<br />
7 S. Nie, D. T. Chu, and R. N. Zare, Science 266, 1018 1994.<br />
8 A. Castro and E. B. Shera, Appl. Opt. 34, 3218 1995.<br />
9 P. M. Goodwin, W. P. Ambrose, and R. A. Keller, Acc. Chem. Res. 29,<br />
607 1996.<br />
10 M. D. Barnes, C.-Y. Kung, W. B. Whitten, and J. M. Ramsey, Anal.<br />
Chem. 69, 2115 1997.<br />
11 C. Zander et al., Appl. Phys. B: Lasers Opt. 63, 517 1996.<br />
12 R. Müller et al., Chem. Phys. Lett. 262, 716 1996.<br />
13 M. Sauer, C. Zander, R. Müller, B. Ullrich, S. Kaul, K. H. Drexhage, and<br />
J. Wolfrum, Appl. Phys. B: Lasers Opt. 65, 427 1997.<br />
14 J. Enderlein, P. M. Goodwin, A. V. Orden, W. P. Ambrose, R. Erdmann,<br />
and R. A. Keller, Chem. Phys. Lett. 270, 464 1997.<br />
15 M. Sauer et al., Bioimaging 6, 141998.<br />
16 K. Dörre et al., Bioimaging 5, 139 1997.<br />
17 L. Edman, Ü. Mets, and R. Rigler, Proc. Natl. Acad. Sci. USA 93, 6710<br />
1996.<br />
18 Y. Jia, A. Sytnik, L. Li, S. Vladimirov, B. S. Cooperman, and R. M.<br />
Hochstrasser, Proc. Natl. Acad. Sci. USA 94, 7932 1997 .<br />
19 C. Eggeling, J. R. Fries, L. Brand, R. Günther, and C. A. M. Seidel, Proc.<br />
Natl. Acad. Sci. USA 95, 1556 1998.<br />
20 M. Sauer, K.-H. Drexhage, U. Lieberwirth, R. Müller, S. Nord, and C.<br />
Zander, Chem. Phys. Lett. 284, 153 1998.<br />
21 N. J. Dovichi, J. C. Martin, J. H. Jett, M. Trkula, and R. A. Keller, Proc.<br />
SPIE 426, 711983.<br />
22 C. Zander and K. H. Drexhage, J. Fluoresc. 7, 37S 1997.<br />
23 W. A. Lyon and S. Nie, Anal. Chem. 69, 3400 1997.<br />
24 C. Zander, K. H. Drexhage, K.-T. Han, J. Wolfrum, and M. Sauer, Chem.<br />
Phys. Lett. 286, 457 1998.<br />
25 J. K. Towns and F. E. Regnier, Anal. Chem. 63, 1126 1991.<br />
26 J. Tellinghuisen and C. W. Wilkerson, Jr., Anal. Chem. 65, 1240 1993.
Becker & Hickl GmbH<br />
Nahmitzer Damm 30<br />
D-1277 Berlin<br />
Tel. +49 30 787 56 32<br />
Fax +49 30 787 57 34<br />
email: info@becker-hickl.com<br />
http://www.becker-hickl.com<br />
spcmicr.doc printer hp 4500 ps<br />
January 2002<br />
TCSPC Laser Scanning Microscopy<br />
Upgrading laser scanning microscopes with the SPC-730 TCSPC lifetime<br />
imaging module<br />
Fluorescence Lifetime Imaging (FLIM) has become a new powerful method to investigate<br />
molecular interactions, metabolic reactions and fluorescence quenching or energy transfer in<br />
cells and subcellular structures [4-7]. These effects cause changes in the fluorescence quantum<br />
efficiency and thus in the fluorescence lifetime. Since the fluorescence lifetime does not<br />
depend on the unknown dye concentration it is a direct measure for the quantum efficiency. It<br />
therefore gives a more direct access to the investigated effects than the fluorescence intensity.<br />
Furthermore, the fluorescence lifetime can be used to separate the fluorescence of different<br />
luminophores in the cells if the components cannot be distinguished by their fluorescence<br />
spectra.<br />
Recording time-resolved fluorescence images can be achieved by combining a Laser Scanning<br />
Microscope with pulsed laser excitation and a new <strong>Time</strong>-<strong>Correlated</strong> <strong>Single</strong> <strong>Photon</strong> <strong>Counting</strong><br />
(TCSPC) Imaging technique introduced by Becker & Hickl [1, 6]. This note was written to<br />
assist upgrading of laser scanning microscopes for lifetime imaging.<br />
Introduction<br />
The Light Source<br />
Fluorescence Lifetime Imaging requires a pulsed excitation source with a repetition rate in the<br />
MHz range.<br />
Titanium-Sapphire Lasers<br />
The ultimate solution is the femtosecond Ti:Sa laser. These lasers deliver pulses with 70 to<br />
80 MHz repetition rate, 80 to 200 fs pulse width and up to 1 W average power. The<br />
wavelength is in the NIR from 780 nm to 950 nm. Tuneable and fixed wavelength versions<br />
are available. To excite the sample which usually absorbs below 500 nm, simultaneous two<br />
photon excitation is used. Due to the short pulse width and the high energy density in the<br />
focus of the microscope the two-photon process works very efficiently. Therefore the<br />
traditional frequency doubling of the Ti:Sa radiation is not normally used for laser scanning<br />
microscopes.<br />
Frequency Doubled Titanium-Sapphire Lasers<br />
Frequency doubled titanium-sapphire lasers can be used to excite the sample via the<br />
traditional one-photon absorption. Frequency doubling is achieved by a nonlinear crystal. The<br />
output power is in the mW range. Less than 50µW are required to excite a typical sample so<br />
that the available power is by far sufficient. Whether one-photon or two-photon excitation<br />
gives less photodamage is still under discussion. In a few cases we obtained considerably<br />
higher count rates and less photodamage for one-photon exciation.<br />
1
If a frequency doubled Ti:Sa laser is used, the NUV pulses should be stretched to a width of<br />
some ps. This avoids two-photon processes into the UV which are absolutely deadly for any<br />
biological sample.<br />
Fibre Lasers<br />
Another useful excitation source are fibre lasers. Fibre lasers are available for a wavelength of<br />
780 nm and deliver pulses as short as 100 to 180 fs [8]. The average power is 10 to 20 mW.<br />
This is less than for the Ti:Sa laser but well sufficient for two-photon excitation. As a rule of<br />
thumb, the maximum useful power for biological samples and fs NIR excitation is 1 to<br />
100 mW. A higher power kills the cells or cooks the sample. The benefit of the fibre laser is<br />
the small size, the high reliability and the lower price compared to the Ti:Sa laser. The<br />
drawback is the fixed wavelength.<br />
Pulsed Diode Lasers<br />
A reasonable cost solution for one-photon excitation are pulsed diode lasers which are<br />
available for the blue and red spectral range [9]. These lasers deliver pulses from 40 to 400 ps<br />
duration with up to 80 MHz repetition rate. The average power is a few mW. The beam<br />
quality of diode lasers is not very good. Therefore it can be difficult to obtain a diffractionlimited<br />
resolution. However, if only the central part of the beam is used, the result can be<br />
quite acceptable. Discarding a large fraction of the beam causes a considerable loss of power.<br />
This loss is, however, not substantial because 50 µW are absolutely sufficient to excite the<br />
sample.<br />
The microscope companies sometimes suggest to use a continuous laser and to modulate it<br />
with an electro-optical modulator. Don’t use this solution. It is unable to deliver sufficiently<br />
short pulses and more expensive than a good diode laser.<br />
The Microscope<br />
The general optical principle of a laser<br />
scanning microscope is shown in fig. 1.<br />
The laser is fed into the optical path via a<br />
dichroic mirror and focused into the sample by<br />
the microscope objective lens. In the<br />
traditional one-photon setup the light from the<br />
sample goes back through the objective lens,<br />
through the dichroic mirror and through a<br />
pinhole in the upper image plane of the<br />
objective lens. Light from outside the focal<br />
plane is not focused into the pinhole plane and<br />
therefore substantially suppressed.<br />
X-Y imaging is achieved by optically scanning<br />
the laser spot over the sample, Z imaging (optical sectioning) is possible by moving the<br />
sample or the microscope up and down.<br />
With a fs Ti:Sa laser the sample can be excited by two-photon absorption. Due to the short<br />
pulse duration and the small diameter of the Airy disk the photon density in the focus is very<br />
high, so that the two-photon excitation works with high efficiency. Excitation occurs only in<br />
the focus, so that no pinhole is required to reject light from outside the focal plane. For<br />
imaging biological samples, two-photon excitation can have several benefits:<br />
2<br />
Laser<br />
Excited<br />
Detector<br />
Pinhole<br />
Dichroic<br />
Mirror<br />
Objective<br />
Lens<br />
Sample<br />
One-<strong>Photon</strong> Excitation<br />
Laser<br />
NIR fs pulses<br />
Excited<br />
Detector<br />
Dichroic<br />
Mirror<br />
Objective<br />
Lens<br />
Sample<br />
Two-<strong>Photon</strong> Excitation<br />
Fig. 1: Principle of a laser scanning microscope (scanning<br />
setup not shown)
- Scattering and absorption coefficients at the near infrared excitation wavelength are small.<br />
Therefore, layers deeply in the sample can be excited [4].<br />
- If deep sample layers are imaged the scattering at the emission wavelength broadens the<br />
luminescent spot seen by the microscope objective. The absence of a pinhole allows to<br />
efficiently record the emitted light from a relatively large area while maintaining the optical<br />
sectioning capability.<br />
- Living cells are surprisingly stable under two-photon NIR excitation [7]. The reason is that<br />
the absorbed energy is far less than the energy in the excitation beam. Furthermore, there is<br />
no substantial absorption above and below the focal plane.<br />
The TCSPC Imaging Module<br />
The principle the SPC-730 TCSPC Imaging module [1] is shown in fig. 2.<br />
The module employs an advanced<br />
TCSPC technique featuring both high<br />
count rate and low differential<br />
nonlinearity [1]. It contains the usual<br />
building blocks (CFDs, TAC, ADC) in<br />
the ‘reversed start-stop’ configuration<br />
together with a scanning interface and a<br />
large histogram memory integrated on<br />
one board.<br />
The TCSPC module receives the single<br />
photon pulses from the photomultiplier<br />
(PMT) of the microscope, the reference<br />
pulses from the laser and the Frame<br />
Sync, Line Sync and Pixel Clock<br />
signals from the scanning unit of the<br />
microscope. For each PMT pulse, i.e.<br />
for each photon, the TCSPC module<br />
determines the time of the photon<br />
within the laser pulse sequence and the<br />
location within the scanning area.<br />
These values are used to address the<br />
histogram memory in which the events<br />
are accumulated. Thus, in the memory<br />
the distribution of the photon density<br />
over x, y, and the time within the<br />
From PMT<br />
Start<br />
From Laser<br />
Stop<br />
From Microscope<br />
Scanning Unit<br />
Frame Sync<br />
Line Sync<br />
Pixel Clock<br />
<strong>Time</strong><br />
Measurement<br />
Scanning Interface<br />
Location<br />
within<br />
scanning<br />
area<br />
fluorescence decay function builds up. The result can be interpreted as a two-dimensional<br />
(x, y) array of fluorescence decay curves or as a sequence of fluorescence images for different<br />
times (t) after the excitation pulse.<br />
Interestingly, there is practically no loss of photons in the TCSPC imaging process. As long as<br />
the photon detection rate is not too high all detected photons are processed and accumulated in<br />
the histogram, thus providing maximum sensitivity. This is a key advantage of the TCSPC<br />
Scanning Microscope over simple (single gate) gated photon counting or gated image<br />
intensifiers which gate away the majority of the fluorescence photons.<br />
Another benefit of TCSPC imaging is the high time resolution. The time channel width can be<br />
as small as 820 fs. Decay times down to 5 ps can be determined with fast detectors. On the<br />
CFD<br />
CFD<br />
TAC<br />
ADC<br />
Counter Y<br />
Counter X<br />
<strong>Time</strong><br />
within<br />
decay<br />
curve<br />
Y<br />
t<br />
Histogram<br />
Memory<br />
Fig. 1: Basic principle of the SPC-730 TCSPC Imaging<br />
module [1]<br />
Fig. 2: The Becker & Hickl SPC-730 TCSPC Imaging<br />
Module [1]<br />
X<br />
3
other hand, TCSPC imaging is flexible in that a large number of pixels can be measured with<br />
wide time channels or precision measurements can be done at a small number of pixels.<br />
Furthermore, the method can work with the fastest scanning speed of the microscope thus<br />
avoiding heat concentration in the excited spot of the sample.<br />
Advocates of gated photon counting or phase fluorometry sometimes claim that the count rate<br />
of the TCSPC method is too low for microscopy application. This ill reputation comes from<br />
older TCSPC devices built from nuclear instrumentation modules. The SPC-730 has a dead<br />
time of 180 ns yielding a maximum useful count rate of about 3 MHz. For comparison, living<br />
cells excited by two-photon excitation give a count rate of some 10,000 photons per second.<br />
Samples of non-living cells stained with highly fluorescent dyes can deliver up to 200,000<br />
photons per second. A higher excitation intensity kills the cells or destroys the sample.<br />
The Detector<br />
<strong>Time</strong>-correlated single photon counting requires a detector capable to deliver an electrical<br />
pulse for a single detected photon. The detector must be fast enough to resolve the<br />
fluorescence decay time of typically 100 ps to 5 ns. Only photomultipliers (PMTs) and singlephoton<br />
avalanche photodiode modules meet these requirements.<br />
Built-in PMTs<br />
Commercial scanning microscopes employ small side-window PMTs to detect the light from<br />
the sample. The PMTs are integrated in the scanning head. Usually there are several detection<br />
channels with separate PMTs. The PMTs are selected for optimum sensitivity, not for time<br />
resolution in the single photon mode. Thus, the built-in detectors can be used for TCSPC<br />
imaging, but do not deliver a good time resolution. Nevertheless, they can be used to<br />
distinguish between different dyes in multi-stained samples and to investigate other lifetime<br />
effects in the ns range. They are not useful for FRET measurements. The internal detectors<br />
should be operated at the maximum permissible supply voltage and with a HFAC26-10<br />
preamplifier of Becker & Hickl.<br />
PMH-100 PMT Module<br />
The PMH-100 of Becker & Hickl is a rugged PMT module with<br />
an internal high-voltage generator, preamplifier, and overload<br />
warning circuit. It is connected directly to the SPC-730 module.<br />
The PMH-100 delivers a system response of 150 to 220 ps<br />
FWHM and can be used to measure lifetimes down to 200 to<br />
300 ps. We recommend this detector as a startup solution. It is<br />
attached to the non-descanned port of the microscope or to the a<br />
fibre output from the scanning head. The PMH-100 is available<br />
with bialkali and multialkali cathodes. The reduced spectral<br />
range of the bialkali cathode can be a benefit in two-photon<br />
systems when blocking of the laser line is a problem. Typical<br />
FRET effects are well detectable with the PMH-100. However,<br />
for quantitative FRET experiments we recommend the R3809U<br />
MCP-PMT (see below).<br />
PMH-100, about 1/2 natural size<br />
4
H5783 Photosensor Module<br />
The Hamamatsu H5783P and H5773P Photosensor Modules<br />
incorporate a small size PMT and the HV power supply. They<br />
require a +12 V supply and some gain setting resistors only. The<br />
+12 V is available from the SPC-730 module or from the<br />
DCC-100 detector controller (see below). The time resolution is<br />
150 to 220 ps FWHM. The H5783P and H5773P are available<br />
with bialkali and multialkali cathodes. For optimum results, use<br />
H5783 module, natural size<br />
the '-P' type, which is specified for photon counting. Due to their<br />
small size, the H5783 and H7783 modules are a solution if a<br />
detector in the scanning head has to be replaced with a faster one. The modules should be<br />
operated with a HFAC-26-10 preamplifier of Becker & Hickl.<br />
R3809U MCP PMT<br />
The Hamamatsu R3809U MCP PMT [2, 3] achieves an FWHM<br />
below 30 ps. It is the ultimate solution for TCSPC scanning<br />
microscopes. It is clearly the best detector for FRET<br />
experiments. However, since MCPs are expensive and easily<br />
damaged it is neither a solution for beginners nor a low budget<br />
solution.<br />
The R3809U is connected to the SPC-730 via an HFAC-26-01<br />
preamplifier. Furthermore, it requires a 3 kV high voltage power<br />
R3809U MCP, about 2/3 natural size<br />
supply. Thus, the overall cost for one R3809U detection channel<br />
is in the order of $15,000 to $20,000. This is not very much<br />
compared to the price to the microscope and the laser, but a lot if the detector is damaged by<br />
maltreatment. Due to its relatively large size the R3809U should be attached to the nondescanned<br />
port of the microscope or to a fibre output from the scanning head.<br />
The R3809U is available in different cathode versions. The most versatile one is the<br />
R3809U-50 with a multialkali cathode for the wavelength range from 180 to 820 nm. The<br />
R3809U-52 has a bialkali cathode and can be used up to 650m [3]. This limitation of the<br />
spectral range can be a benefit for two-photon systems when blocking of the laser line is a<br />
problem.<br />
Gain control and overload shutdown of the R3809U can be achieved by the DCC-100 detector<br />
controller, see below.<br />
A cooler is available for the R3809U. Cooling substantially reduces the dark count rate and<br />
therefore makes possible long acquisition times. However, before you install a cooler, make<br />
sure that your background signal really comes from the detector and not from poor blocking of<br />
excitation light or even from insufficient shielding of daylight.<br />
SPCM-AQR Avalanche Photodiode Modules<br />
The SPCM-AQR Avalanche Photodiodes Modules of EG&G / Perkin Elmer have a high<br />
quantum efficiency in the NIR. This makes the modules exceptionally suitable for single<br />
molecule investigations. For precision decay time measurements they are less useful because<br />
the system response is 500 ps wide and slightly dependent on the count rate. The SPCM-AQR<br />
is connected to the SPC-730 via an adapter available from Becker & Hickl.<br />
5
Hamamatsu H7222 Modules<br />
The H7422 modules are a high speed, high sensitivity PMT modules. They contain a GaAs<br />
photomultiplier along with a thermoelectric cooler and a high voltage generator. The H7422<br />
modules feature excellent sensitivity in the red and near-infrared region. The resolution in the<br />
TCSPC mode is typically 250 ps. The H7422 comes in different cathode versions for the<br />
wavelength range up to 900 nm. For most microscope applications the H7422-40 is best. It<br />
has the highest quantum efficiency of all H7422 versions and is sensitive up to 750 nm.<br />
Above this wavelength the sensitivity drops rapidly. That means that the dyes typically used<br />
for cell staining can be measured, but there is a substantial suppression of the excitation line<br />
of a Ti:Sa laser for two-photon excitation.<br />
If you need sensitivity up to 900 nm - which requires one photon excitation in the red or NIR<br />
range - you can use the H7422-50.<br />
All H7422 modules must be handled with care because the cathodes can easily be damaged by<br />
overload. Exposure to daylight is not allowed even when the devices are switched off.<br />
Therefore, the H7422 should be used with an HFAC-26-1 preamplifier only. Gain control,<br />
overload shutdown and cooling can be achieved by using the bh DCC-100 detector controller<br />
(see below).<br />
The DCC-100 detector controller<br />
The DCC-100 module is designed to control<br />
detectors in conjunction with bhphoton counters.<br />
It can be used to control the gain of the<br />
Hamamatsu H7422, H5783, H6783, H7422 or<br />
similar Hamamatsu photosensor modules by<br />
software. The gain of MCPs and PMTs can be<br />
controlled via the FuG HCN-14 High Voltage<br />
Power Supply. In conjunction with bh<br />
preamplifiers, overload shutdown of the detectors<br />
can be achieved. Furthermore, the DCC-100<br />
delivers the current for thermoelectric coolers, e.g.<br />
for the Hamamatsu H7422. High current digital<br />
outputs are available for shutter or filter control.<br />
The DCC-100 is a PCI module for IBM<br />
compatible computers. It works under Windows<br />
95, 98, 2000 and NT.<br />
The figure right shows how a H7422 module is<br />
controlled via the DCC-100. For more<br />
to SPC module<br />
CFD in<br />
+12V<br />
HFAC-26-1<br />
/ovld<br />
PMT Out<br />
+12V<br />
Gain Cont 0..0.9V<br />
Peltier +<br />
Peltier -<br />
information, please see DCC-100 data sheet and DCC-100 manual, www.becker-hickl.com.<br />
DCC<br />
1<br />
2<br />
3<br />
gnd<br />
gnd<br />
+12V<br />
Fan<br />
H7422<br />
Power supply and gain control of H7422<br />
with overload shutdown<br />
Preamplifiers<br />
Most MCPs and PMTs deliver pulses of 20 to 50 mV when operated at maximum gain.<br />
Although these pulses can easily be detected by the input discriminators of the SPC modules a<br />
preamplifier can improve the time resolution, the noise immunity, the threshold accuracy and<br />
the safety against damaging the SPC input. Furthermore, it can extend the detector lifetime<br />
because the detector can be operated at a lower gain and a lower average output current.<br />
6
For TCSPC applications we recommend our HFAC-26<br />
preamplifier. The HFAC-26 has 20 dB gain and 1.6 GHz<br />
bandwidth. The maximum linear output voltage is 1 V. Therefore,<br />
it amplifies the single photon pulses of a typical PMT or MCP<br />
without appreciable distortions. Furthermore, the HFAC-26<br />
incorporates a detector overload detection circuit. This circuit<br />
measures the average output current of the PMT and turns on a<br />
LED and activates a TTL signal when the maximum safe detector<br />
HFAC-26 Amplifier<br />
current is exceeded.<br />
Thus, even if the gain of the amplifier is not absolutely required the overload warning function<br />
helps you to make your measurement setup ‘physicist proof’. If you use an MCP with your<br />
SPC module you should always connect it via an HFAC-26 preamplifier.<br />
The HFAC-26 is available with different overload warning thresholds from 100 nA (for<br />
MCPs) to 100 uA (for large PMTs).<br />
7
System Setup<br />
Attaching the detector<br />
Generally there are four options for the detection channel. You can<br />
- use one of the internal detectors of the microscope<br />
- replace one of the internal detectors with a faster one<br />
- use a fibre to feed the light from the scanning head to an external detector<br />
- attach a detector to the non-descanned port of the microscope<br />
Not all options are available in all microscopes. The following considerations can help to find<br />
the best solution for your microscope and your application.<br />
Using the built-in detectors<br />
The general principle of the scanning head of a laser scanning microscope is shown in the<br />
figure right.<br />
The laser beam is coupled into the setup via a dichroic<br />
mirror. Than it is deflected by the scan mirrors. The scan lens<br />
focuses an image of the scan mirror axis into the microscope<br />
objective. Thus, the direction the laser takes through the<br />
objective changes as the mirrors tilt back and forth thus<br />
scanning the laser focus over the sample. The fluorescence<br />
light from the sample goes back through the microscope<br />
objective, the scan lens, and the scan mirrors. If the setup is<br />
correctly aligned the motion of the returned light beam is<br />
exactly compensated by the scan mirrors. The fluorescence<br />
light is separated into several detection channels by one or<br />
several additional dichroics. Filters are used to block the<br />
scattered laser light and to select the correct fluorescence<br />
wavelength. Pinholes in front of the detectors are used to<br />
suppress the light from outside the focal plane of the<br />
microscope objective.<br />
Various modifications of this setup are used in different<br />
Objective<br />
microscopes. Transfer lenses or mirrors are used to image the<br />
rotation axis of the first scanning mirror into the axis of the<br />
Sample<br />
second one, the laser beam diameter is changed to fit the<br />
diameter of the microscope objective, monochromators are used instead of the filters, and the<br />
size of the pinholes can be adjustable. Depending on the application and on the setup of the<br />
scanning head, detection via the scanning head PMTs has benefits and drawbacks.<br />
- One-photon excitation requires the pinholes to suppress the fluorescence from outside the<br />
focal plane. Therefore, the detection path back through the scanning head is the only useful<br />
one for one-photon excitation.<br />
- Two-photon excitation does not require the pinholes. The pinholes can even be troublesome<br />
because they suppress some light that leaves the sample slightly scattered. Therefore, the<br />
pinhole size is adjustable in good scanning heads. If the pinholes can be made wide enough,<br />
there is no appreciable drawback of the detection path via the scanning head.<br />
- For two-photon excitation, the complicated optical path trough the scanning head can<br />
introduce some loss of intensity due to the large number of lens and mirror surfaces.<br />
However, the scanning heads of state-of-the-art microscopes are optically near perfect so<br />
8<br />
Laser<br />
Dichroic<br />
Scan<br />
Mirror<br />
PMT1<br />
Scan<br />
Lens<br />
Pinhole<br />
Filter<br />
Filter<br />
Dichroic<br />
Scanning Head<br />
Pinhole<br />
Scan<br />
Mirror<br />
PMT2
that there is no noticiable loss of photons. Furthermore, computer controlled selection of<br />
dichroics and filters or monochromators available in the scanning heads helps to select the<br />
best wavelength range and to suppress scattered laser light. This often compensates for<br />
possible loss in the optical path.<br />
- The pinhole - even a very large one - helps to suppress straylight and optical reflections that<br />
often show up in time resolved data obtained by non-descanned detection.<br />
- The most serious drawback of using the internal detectors is the poor time resolution.<br />
Unfortunately, replacing the detectors with faster ones is usually very difficult, if not<br />
impossible. The remedy is the fibre coupling option described in the next section.<br />
Fibre Coupling<br />
One of the internal detectors is removed and an optical<br />
fibre is attached instead. The light is fed to an external<br />
detector. Compared to the setup with all PMTs in the<br />
scanning head, this configuration has the benefit that any<br />
detector can be installed at the end of the fibre. There is no<br />
problem to use large detectors, coolers, or additional<br />
filters.<br />
The drawback is that<br />
- the coupling of the fluorescence light into the fibre can be<br />
inefficient, especially for a thin fibre in conjunction with<br />
two photon excitation and strongly scattering samples.<br />
Dichroic<br />
- the dispersion in the fibre can introduce some broadening<br />
of the system response. Due to the small aperture of the light beam behind the pinhole the<br />
effect is very small. We did not find a substantial loss of resolution of an R3809U MCP<br />
coupled trough a 1 m long fibre to a Zeiss LSM-510.<br />
Some microscope manufacturers (e.g. Zeiss) offer a fibre coupling option for their scanning<br />
heads. In this case fibre coupling is an excellent and easy-to-use solution that works for onephoton<br />
and two-photon excitation as well. Detectors for the Zeiss LSM-510 fibre output are<br />
available from bh, see figure below.<br />
Laser<br />
Scan<br />
Mirror<br />
PMT1<br />
Scan<br />
Lens<br />
Scanning Head<br />
Pinhole<br />
Filter<br />
Filter<br />
Dichroic<br />
Pinhole<br />
Scan<br />
Mirror<br />
Fibre<br />
External<br />
Detector<br />
PMH-100 H7422-40 R3809U<br />
Detector for the ‘Fibre Out’ version of the Zeiss LSM-510<br />
9
Non-Descanned Detection<br />
Microscope manufacturers claim that non-descanned<br />
detection (NDD) is the ultimate solution for two-photon<br />
excitation. The optical path is shown in the figure right.<br />
The fluorescence light is separated from the excitation<br />
by a dichroic mirror before it enters the scanning head.<br />
The light goes through a laser blocking filter and a<br />
wavelngthe selection filter directly to the detector.<br />
Although the principle is more or less the same in all<br />
microscopes, several modifications are possible. The<br />
setup of the dichroic can be reversed so that the scanned<br />
laser beam is reflected instead of the fluorescence signal.<br />
A demagnification lens can be used to shrink the<br />
illuminated area on the detector. Zeiss offers a ‘Non<br />
Descanned Detection Module’ with several detection<br />
channels and computer selectable dichroics and filters<br />
for the LSM-510.<br />
The benefits and drawbacks of non-descanned detection are:<br />
Detector<br />
- Two-photon excitation in conjunction with NDD allows imaging as deep as 100 um into<br />
biologic tissue.<br />
- For single cell layers there is no appreciable advantage in sensitivity compared to descanned<br />
detection. The scanning head optics in good microscopes works virtually without losses. If<br />
the pinhole diameter is adjustable (as it is in the Zeiss LSM-510) the advantage of NDD is<br />
questionable.<br />
- NDD can be reasonably used only for two-photon excitation<br />
- The selection of the dichroic and of the laser blocking filter is crucial. The scattered laser<br />
light is many orders of magnitude stronger than the fluorescence, and a suppression factor of<br />
10 6 to 10 10 is required. Therefore, make sure that the correct filters be inserted in your<br />
microscope and that your microscope supplier gives you appropriate support.<br />
- Since there is no pinhole the NDD setup is prone to optical reflections. Reflections between<br />
the filters or reflections from condensor lenses behind the sample are often found in the<br />
decay curves.<br />
- Since the detection path is relatively open to straylight the detector can easily be overloaded.<br />
Furthermore, NDD setups are often not safe in terms of operator errors. Often a mercury or<br />
halogen lamps used to adjust the sample visually. If the lamp can be switched on when the<br />
detection path is open the detector is immediately destroyed. Therefore, special care has to<br />
be taken in order not to damage the detector.<br />
Laser<br />
Filter<br />
Blocking<br />
Filter<br />
Scanning Head<br />
Dichroic<br />
Objective<br />
Sample<br />
Two-<strong>Photon</strong> <strong>Systems</strong><br />
Optical System<br />
Scattering of excitation light can be a serious problem in a two-photon microscope. Even if<br />
the optical system is perfect the excitation light scattered at the dichroic, at the microscope<br />
lens, and in the sample is many orders of magnitude stronger than the fluorescence light.<br />
10
Therefore proper blocking of the excitation light is essential for two-photon fluorescence<br />
imaging.<br />
10<br />
The key to two-photon operation is the Schott BG39<br />
Transmission<br />
filter. The characteristics of this filter is shown in the<br />
1mm BG39<br />
figure right. The filter efficiently blocks the<br />
1<br />
excitation between 780 and 900 nm. A minimum of<br />
1mm BG39 for bialkali detectors and a minimum of<br />
3mm BG39<br />
3mm for multialkali detectors is required.<br />
0.1<br />
Although dielectric filters have a sharper edge than<br />
the BG39 these filters usually fail to block the laser 0.01<br />
sufficiently. The reason may be that a dielectric filter<br />
reflects the light instead to absorb it. Therefore the<br />
0.001<br />
laser light is scattered through the microscope and<br />
eventually arrives at the detector. Therefore, a<br />
dielectric filter should always be used in conjunction<br />
300 400 500 600 700 nm<br />
with a BG39.<br />
Wavelength<br />
Even with the BG39 filter scattered laser light often<br />
Transmission of BG39 Filter<br />
impairs the results of lifetime measurements. If the<br />
light comes from the sample it shows up as a sharp peak at the top of the fluorescence decay<br />
curves. If it comes from parts of the optical system the peak appears in a different position. If<br />
you see such effects although you have enough BG39 filters in the light path the reason may<br />
be:<br />
Scattering at the microscope objective. To get diffraction limited resolution, the cross section<br />
of the laser beam is usually made larger than the microscope lens. A part of the laser beam<br />
hits the lens mount and is scattered into the detection path. Solution: Keep the beam diameter<br />
as small as possible - if you can. Or - if you are designing your own system - use a transfer<br />
lens and a diaphragm in front of the detector.<br />
Reflection at a condensor lens. Usually the microscope has a condensor lens on the opposite<br />
side of the sample. Laser light that penetrates the sample can be reflected at this lens and<br />
directed back into the detection path. A simple solution is to shed the condensor during the<br />
measurement.<br />
Dielectric blocking filters. In dielectric (dichroic) filters, the blocked light is reflected. That<br />
means, it is scattered through the microscope. Therefore, the first filter should be an<br />
absorptive filter, e.g. a BG 39.<br />
Stacks of dielectric Filters. Do not stack dichroic filters to improve the blocking factor. The<br />
blocked light is reflected and bounces between the filters so that the blocking factor is less<br />
than the product of the blocking factors of the two filters. If dichroic filters have to be stacked,<br />
place absorptive filters (BG glass filters) between.<br />
Insufficient Baffling: As far as possible, block straylight out of the detection path. The most<br />
critical places are the area around the microscope lens and the area behind the dichroic mirror.<br />
Excitation light from these areas can be diverted directly into the detection path. Make sure<br />
that the critical areas are black and insert baffles so that they are not directly seen by the<br />
detector.<br />
A well-designed optical system for non-descanned detection and a design with features to be<br />
more or less avoided are shown in the figure below.<br />
11
from<br />
scanner<br />
Scan Lens<br />
Microscope<br />
Lens<br />
Excitation Beam<br />
Dichroic<br />
Absorptive Filter<br />
Dielectric Filter<br />
Transfer Lens, projecting<br />
image of microscope<br />
lens into diaphragm<br />
Trap<br />
(BG39)<br />
(Short Pass)<br />
from<br />
scanner<br />
Scan Lens<br />
Excitation Beam<br />
Dielectric Filter<br />
Dielectric Filter<br />
Microscope<br />
Lens<br />
large beam diameter<br />
increases scattering<br />
at microscope lens mount<br />
Dichroic<br />
Light bounces<br />
between filters,<br />
inefficient blocking<br />
Light scattered<br />
off lens mount<br />
can reach<br />
detector<br />
not black<br />
Light reflected<br />
off filter is scattered<br />
back to the detector<br />
(Short Pass)<br />
(Short Pass)<br />
Diaphragm,<br />
cuts off light<br />
scattered from<br />
microscope<br />
lens mount<br />
Full detector area<br />
detects scattered<br />
excitation light<br />
PMT<br />
PMT<br />
Well-designed NDD system (left) and features to be avoided (right)<br />
Selection of Detectors<br />
For most detectors two cathode versions exist - the<br />
bialakali and the multialkali cathode. The quantum<br />
efficiency and the spectral response function mainly<br />
depends on the cathode type. The sensitivity variation<br />
between different tubes of the same type is usually in<br />
the same order as the differences between tubes of<br />
different types. The typical spectral response for the two<br />
cathode versions is shown right.<br />
The dark count rate for the bialkali cathode is typically<br />
20 to 80 counts per second. The mutialkali cathode<br />
usually has 200 to 600 dark counts per second.<br />
The sensitivity of the bialkali cathode drops sharply<br />
above 650nm. Therefore a 1 mm BG39 blocking filter<br />
is enough for this cathode. The multialkali tube has a<br />
sensitivity range up to 820nm and usually requires 3mm<br />
BG39. The figure right shows the spectral response of<br />
the bialkali cathode with 1mm BG39 and of the<br />
multialkali cathode with 3mm BG39.<br />
Interestingly, there is almost no difference in the<br />
wavelenth range for the two cathode/filter<br />
combinations. It is probably better to sacrify a few<br />
nanometers in the red and take advantage of the higher<br />
blue sensitivity and the lower dark count rate of the<br />
bialkali cathode.<br />
10<br />
Relative Sensitivity<br />
Multialkali<br />
1<br />
Bialkali<br />
0.1<br />
0.01<br />
0.001<br />
300 400 500 600 700 nm<br />
10<br />
Bialkali + 1mm BG39<br />
Multialkali + 3mm BG39<br />
1<br />
1mm BG39<br />
3mm BG39<br />
0.1<br />
0.01<br />
0.001<br />
Transmission or Relative Sensitivity<br />
300 400 500 600 700 nm<br />
Wavelength<br />
12
System Connections<br />
The typical setup of the TCSPC microscope is shown in the figure below. A Ti:Sa laser<br />
delivers femtosecond pulses in the wavelength range from 780 nm to 950 nm.<br />
Scanning Head<br />
TiSa Laser<br />
200 fs, 76 MHz<br />
780 nm to 900 nm, 200fs<br />
Preamp<br />
P1 .. P4:<br />
internal PMTs,<br />
descanned<br />
P4<br />
P3<br />
P1<br />
P2<br />
SPC-730 TCSPC Imaging Module<br />
SYNC<br />
Stop<br />
Start<br />
Preamp<br />
scan<br />
mirrors<br />
P5<br />
external PMT,<br />
non-descanned<br />
System Computer<br />
Pixel Clock, Line Sync, Frame Sync<br />
Scan Control<br />
Unit of<br />
Microscope<br />
Confocal Microscope<br />
General setup of the TCSPC Laser Scanning Microscope<br />
The microscope scans the sample in the x-y plane providing an image in the focal plane of the<br />
objective lens. 3 D imaging is achieved by changing the depth of the focus in the sample.<br />
Data acquisition is accomplished by the Becker & Hickl SPC-730 TCSPC Imaging module<br />
[1]. The CFD input receives the single photon pulses of the PMT. Synchronisation with the<br />
laser pulse sequence is achieved by the SYNC signal from the reference diode of the Ti:Sa<br />
laser.<br />
The SPC-730 module gets the scan control signals, Pixel Clock, Line Sync, and Frame Sync,<br />
from the scan controller of the microscope. Connecting the TCSPC module does not require<br />
any modification in the microscope electronics and software. The scan parameters are<br />
controlled in the usual way via the microscope software. The normal scan speed, the zoom<br />
function, region of interest setting, etc. can be used also when recording lifetime images.<br />
Furthermore, the SPC-730 can be run in parallel with the standard image recording electronics<br />
of the microscope. Basically, steady state images and lifetime images in different spectral<br />
ranges can be obtained at the same time.<br />
Due to the simple interfacing the SPC-730 TCSPC imaging module can be adapted to almost<br />
any laser scanning microscope. The only requirement is that Frame Sync and Line Sync<br />
signals with TTL or CMOS levels can be made available. The Pixel Clock signal is not<br />
absolutely required. If a pixel clock is not available it can be generated in the SPC-730<br />
module.<br />
13
Detector Signals<br />
Detectors in the Scanning Head<br />
In most microscopes the internal PMTs are connected to preamplifiers designed for video<br />
signal bandwidth. The output signals of these amplifiers are too slow for photon counting.<br />
Therefore, the PMT output must be made directly available. The PMT output is always<br />
connected to a 50 Ω coaxial cable. Best case, there is a small coaxial connector (SMB, SMA,<br />
MCX, Lemo, etc.) that you can use to disconnect the PMT from the internal amplifier and to<br />
connect it via a HFAC-26-10 preamplifier to the SPC-730 module. Worst case, you have to<br />
desolder the cable either from the PMT assembly or from the internal amplifier board. We<br />
recommend to insert a connector into the cable so that you can easily connect the detector<br />
either to the scanning head electronics or to the SPC-730 system.<br />
PMT<br />
Assembly<br />
SMA, SMB or<br />
MCX Connectors<br />
HFAC-26-10<br />
out<br />
in<br />
to internal signal<br />
processing electronics<br />
internal amplifier<br />
board<br />
to SPC-730, CFD input<br />
+12V from SPC-730<br />
Warning: Do not connect or disconnect the PMT signal line when the PMT operating voltage<br />
is switched on. There is not only danger of electrical shock, you can also damage the<br />
preamplifiers.<br />
PMH-100 detector head<br />
Connecting the PMH-100 is very simple. Connect its +12V power supply<br />
to pin 10 of the lower sub-D connector of the SPC-720 module. Connect<br />
a 50 Ohm SMA cable from the detector output to the CFD input of the<br />
SPC-730. You need not make the cables yourself, they are delivered with<br />
the PMH-100 if it is ordered together with the SPC-730.<br />
The PMH-100 gives an optical and acoustical overload warning if the<br />
maximum output current of the PMT is exceeded. Please shut down the<br />
light or disconnect the +12 V immediately if you see the LED turning on<br />
or hear the overload beep.<br />
SPC-730,<br />
CFD<br />
SPC-730,<br />
SUB-D<br />
14
R3809U MCP<br />
The Hamamatsu R3809U MCP requires a high voltage power supply and an HFA-26-01<br />
preamplifier. The connections are shown in the figure below.<br />
-3000V<br />
HV Power Supply<br />
FuG HCN14-3500<br />
or<br />
Hamamatsu C3350<br />
R3809U<br />
HFAC-26-01<br />
out in<br />
+12V from SPC-730<br />
to SPC-730, CFD input<br />
Although the R3809U can be operated up to 3400 V a supply voltage of 3000 V is sufficient<br />
to get a system response below 30 ps and excellent counting efficiency. Therefore, an<br />
operating voltage of 3000V should not exceeded in order to achieve a maximum lifetime of<br />
the detector. Suitable power supplies are the Hamamatsu C3350 (available for 220 V and<br />
127 V) and the FuG HCN14-3500. If you connect another power supply, please make sure<br />
that the output voltage is negative.<br />
MCP PMTs are very sensitive to overload. The maximum permitted average output current is<br />
only 100 nA. Exceeding this value does not damage the MCP immediately but reduces the<br />
lifetime of the device if the overload persists for a longer time. The Becker & Hickl<br />
HFAC-26-01 preamplifier measures the output current of the MCP and turns on an overload<br />
warning LED if a current of 100 nA is exceeded.<br />
Warning: Do not connect or disconnect the output signal line when the MCP operating<br />
voltage is switched on. There is not only danger of electrical shock, you can also damage the<br />
preamplifier. Please make sure that the connection between the MCP and the amplifier is<br />
reliable. Moreover, make sure that the HV cable and the HV connectors be in a good<br />
condition. Any interruption in the ground return path of the HV supply can put the detector<br />
case, the signal cables, the preamplifier, etc. on high voltage. Therefore be careful please,<br />
since touching 3000 V can ruin you the whole day.<br />
Scan Control Signals<br />
The scan control signal synchronise the data acquisition in the SPC-730 module with the<br />
scanning action of the microscope. Three signals are required:<br />
- Frame Clock indicates the start of the next frame<br />
- Line Clock indicates the start of the next line<br />
- Pixel Clock indicates the start of the next pixel<br />
The SPC-730 needs TTL or CMOS compatible pulses. The duration and the polarity of the<br />
pulses are not essential. The signals are connected to the upper sub-D connector of the SPC-<br />
730 module. The pin assignment of this connector is shown below.<br />
15
1 +5V (max. 100mA)<br />
2 Routing Signal, /R 7 or ARMED 2<br />
3 Routing Signal, /R 8 or TRGD 2<br />
4 Routing Signal, /R 9 or MEASURE 2<br />
5 Ground<br />
6 -5V (max. 100mA)<br />
7 Routing Signal, /R 10<br />
8 Frame Clock<br />
9 Line Clock<br />
10 +12V (max. 60mA)<br />
11 -12V (max. 60mA)<br />
12 Pixel Clock<br />
13 TRIGGER 3<br />
14 CNTE2 (CNTE=CNTE1&CNTE2)<br />
15 Ground<br />
Frame Clock, Line Clock and Pixel Clock pulses are used in all scanning microscopes. The<br />
question is only whether they are available externally at an unused connector.<br />
Cables for the Zeiss LSM-510 Axiovert and LSM-510 Axioplan and the Leica SP2 are<br />
available from Becker & Hickl. For other microscopes please contact Becker & Hickl under<br />
info@becker-hickl.com or phone +49 / 30 787 56 32.<br />
Some microscopes have only the Frame Clock and the Line Clock available. In this case you<br />
can work with a pixel clock signal that is internally generated in the SPC module. This works<br />
since both the scanning speed of the microscope and the frequency of the synthetic pixel clock<br />
are constant. However, some microscopes use a non-uniform pixel clock to compensate for<br />
nonlinearity in the line scan. In this case you may find some distortion in the SPC image if<br />
you use a synthetic pixel clock.<br />
If you make your own cable, please make sure that you don’t accidentally connect the +12V or<br />
-12V of the SPC-730 to a scan control output of your microscope. This would almost surely<br />
damage the microscope electronics.<br />
Synchronisation with the Laser<br />
The synchronisation signal from the laser is required to provide a stop signal for the time<br />
measurement of the individual photon detection events (please see also SPC manual, [1]).<br />
Most Ti:Sa lasers deliver a monitor signal that can be used for synchronisation. The SPC-730<br />
module needs negative pulses of 100 to 500 mV amplitude and < 2ns risetime. The signal<br />
should have a stable amplitude and be free of AC components from the laser power supply<br />
and transients from the scanning head. If the pulses from your laser are positive, please use an<br />
inverting transformer available from Becker & Hickl.<br />
If there is no suitable signal from the laser please use the PHD-400-N photodiode module of<br />
Becker & Hickl. A reflection of the Ti:Sa laser beam at a glass surface focused to the diode<br />
chip is sufficient to generate pulses of -100 mV (please see also SPC manual, [1]).<br />
16
First Light<br />
Detecting the first <strong>Photon</strong>s<br />
If you have a minimum of experience with optical detectors it should be no problem for you to<br />
put the SPC system into operation. In this case proceed as described below. Otherwise please<br />
suppress your aversion against manuals and read the section ‘Getting Started’ in the SPC<br />
manual [1].<br />
Adjusting the Sync Signal<br />
Start the SPC software. Set ‘Sync Threshold’ = -50mV, ‘Sync Zero Cross’ = -20mV, ‘Sync<br />
Frequency Divider’ = 4<br />
If you use a photodiode module for synchronisation: Adjust the photodiode until 'SYNC OK'<br />
is displayed and the Sync rate corresponds to the repetition rate of your laser. If necessary,<br />
change ‘Sync Threshold’ and ‘Sync Zero Cross’. The current indicator at the photodiode<br />
module should go to about 10% of full scale for a 70 to 80 MHz laser. Caution: the current<br />
indicator of the PHD-100 is active only when the output is connected to the SPC module.<br />
If the Sync signal comes from the laser: If necessary, change ‘Sync Threshold’ and ‘Sync Zero<br />
Cross’ until the displayed Sync rate corresponds to the repetition rate of your laser. Make sure<br />
that the pulses from the laser are negative.<br />
Adjusting the detector<br />
Do not give any light to your sample. Darken the room in order not to overload the detector by<br />
daylight leaking into the optical path.<br />
Set ‘CFD limit low’ = 50mV, ‘CFD Zero Cross’ = 0<br />
PMH-100 detector: Connect the +12V from the SPC card to the detector. Make sure that there<br />
is no overload warning (LED turned on or overload alert beep). You should see a CFD count<br />
rate of 100 to 500 counts per second. If you have a much higher count rate you probably have<br />
room light leaking into the detector.<br />
R3809U MCP: Carefully increase the operating voltage. Watch the overload LEDs at the<br />
HFAC-26-01 amplifier. (Please make sure that you have the right amplifier. It must be the<br />
HFAC-26-01 with 100nA overload current.) Stop the procedure if the LED turns on and find<br />
the way the daylight leaks into the detector. If everything is correct you should have a CFD<br />
rate of 100 to 500 counts per second at -3000 V.<br />
Internal PMT: Proceed as described for the R3809U. The maximum supply voltage for the<br />
internal detectors is usually -900 to -1000V. The internal PMTs of some microscopes are<br />
prone to noise pickup from the scanning system. The effect shows up as a high count rate<br />
present only when the scanning is active. The count rate does not depend on the detector<br />
operating voltage. If you have effects like this, all you can do is to increase the CFD threshold<br />
until the false counts disappear and to operate the detector at a gain as high as possible.<br />
When the detector voltage has been set up, start the SPC measurement in the Oscilloscope<br />
Mode. Use the parameters shown below:<br />
17
System Parameters: System Parameters: Display Parameters: Trace Parameters:<br />
Operation Mode: Oscilloscope TAC Range: 50ns Scale Y: Linear Trace 1: Active, Curve 1, Page 1<br />
Overflow: Stop TAC Gain: 1 Max Count: 65535<br />
Trigger: None TAC Offset: 6% Baseline: 0<br />
Coll <strong>Time</strong>: 0.5s TAC limit Low: 8% Point Freq: 1<br />
Display <strong>Time</strong>: 100s TAC Limit High: 92% Style: Line<br />
CFD Limit L: 50mV ADC Resolution: 1024 or 4096 2D Display Mode: Curve<br />
CFD ZC Level: 0 Count Increment: 100<br />
SYNC: ZC Level -20mV Memory Offset: 0<br />
SYNC Threshold: -50mV Dith Rng: 1/16<br />
SYNC Freq Divider: 4 Routing Channels X,Y: 1<br />
Scan Pixels X,Y: 1 Page: 1<br />
As long as there is no excitation at the sample you should see virtually nothing except perhaps<br />
for some single photons scattered over the time axis. If you have more that a few thousand<br />
photons per second you are detecting daylight.<br />
Give light to the sample. Be careful with the intensity. Even if you use one of the internal<br />
detectors of the microscope you may be surprised of the sensitivity of the PMT in the photon<br />
counting mode. On the screen you should see three or four subsequent signal periods of your<br />
fluorescence signal. Adjust the light intensity to a count rate of 100,000 counts per second or<br />
less.<br />
Change CFD Limit Low. The count rate decreases with increasing threshold, but the shape of<br />
the system response improves. Set Limit Low that you get about 80% of the maximum count<br />
rate.<br />
Adjusting time scale and delay<br />
Set ‘Sync Frequency Divider’ = 1. It can happen that you see only a part of the decay curve<br />
now. Change the length of the SYNC cable until you see the decay curve well inside the last<br />
(right) 10 ns of the display window. 1 ns corresponds to a cable length of 20 cm. Alternatively<br />
you can change the length of the cable from the preamplifier or the position of the photodiode<br />
module in the optical path. Caution: Don’t connect or disconnect the PMT when the high<br />
voltage is switched on.<br />
Increase ‘TAC Gain’ to stretch the decay curve over the full display window. The most<br />
appropriate gain is 5. This gives a display window of 10 ns and covers nearly one laser period.<br />
You can use a higher TAC gain to get finer time bins. Use ‘TAC Offset’ to centre the decay<br />
curve in the display window.<br />
Save the result. Use ‘Main’, ‘Save’, options ‘SPC Data’, ‘All used data sets’. Advice: Please<br />
don’t name the file ‘test1.sdt’. Nine of ten files we receive for inspection are named ‘test1.sdt’<br />
- you might get a strange answer.<br />
18
Recording the first image<br />
If the scan control signals are not connected yet, connect them now. Except for the SYNC,<br />
CFD and TAC settings adjusted as shown in the last section, set the SPC-730 parameters as<br />
shown below:<br />
Pixel Clock from<br />
Microscope<br />
Pixel Clock generated<br />
in the SPC-730<br />
These settings give a full size TCSPC image of 128 × 128 pixels for a 512 × 512 resolution of<br />
the microscope. However, if you do not have a pixel clock from the microscope and thus have<br />
to generate the pixel clock in the SPC-730, the pixel time of 10 µs is only a rough estimate. It<br />
can happen that the real pixel dwell time is longer or shorter resulting in an image that is<br />
horizontally stretched or shrunk.<br />
When all parameters are set, start the measurement and wait. The measurement should stop<br />
after the specified ‘Collection <strong>Time</strong>’, i.e. after 30 seconds. In practice it can take a few<br />
seconds longer because after the end of the collection time the acquisition is continued until<br />
the current frame is completed. If the measurement stops correctly, the frame clock, line clock<br />
and pixel clock signals arrive at the SCP-730 module. If the measurement does not stop one or<br />
several clock signals are missing.<br />
If you do not see an image after the measurement has stopped, please reduce the ‘Max Count’<br />
setting in the display parameters. Some image should become visible.<br />
With the display parameter and window parameter configuration shown above, you get an<br />
image in the T Window 1 (specified in the ‘Display Parameters’). This window covers all<br />
19
time channels of the decay curves stored in the individual pixels. Another seven T windows<br />
are defined in the Window Parameters. With the setting above, the T Windows 2 through 8<br />
contain subsequent time intervals of the time axis. As you step through these T Windows by<br />
changing the T Window number in the display parameters you see the image appearing with<br />
the laser pulse and fading as the fluorescence decays.<br />
Do not forget to save the result. This saves also the setup parameters so that you can restore<br />
the system setup of the first successful measurement at any time.<br />
If you do not get a reasonable image, please make sure that the parameters are set as shown<br />
above and check the scan control signals with an oscilloscope.<br />
Adjusting image size and image location<br />
The first images recorded with the settings shown under ‘Recording the first images’ can still<br />
have a wrong size, show a wrong part of the scan or be reversed in X or Y. Some typical<br />
effects and the way of correction are shown below.<br />
Increase<br />
Left Border:<br />
Image in the Microscope<br />
SPC-730 Image<br />
SPC-730 Image<br />
Decrease<br />
Pixel Clock<br />
Predivider<br />
or<br />
Pixel <strong>Time</strong><br />
Image in the Microscope<br />
SPC-730 Image<br />
SPC-730 Image<br />
Decrease<br />
Pixel Clock<br />
Predivider<br />
or<br />
Pixel <strong>Time</strong><br />
Image in the Microscope<br />
SPC-730 Image<br />
SPC-730 Image<br />
Increase<br />
Pixel Clock<br />
Predivider<br />
or<br />
Pixel <strong>Time</strong><br />
Image in the Microscope<br />
SPC-730 Image<br />
SPC-730 Image<br />
20
Decrease<br />
Line Clock<br />
Divider<br />
Image in the Microscope<br />
SPC-730 Image<br />
SPC-730 Image<br />
Decrease<br />
Line Clock<br />
Divider and<br />
Pixel Clock<br />
Predivider<br />
or<br />
Pixel <strong>Time</strong><br />
Image in the Microscope<br />
SPC-730 Image<br />
SPC-730 Image<br />
Decrease<br />
Line Clock<br />
Divider and<br />
Pixel Clock<br />
Predivider<br />
or<br />
Pixel <strong>Time</strong><br />
Image in the Microscope<br />
SPC-730 Image<br />
SPC-730 Image<br />
Set<br />
Reverse X<br />
in Display<br />
Parameters<br />
Image in the Microscope SPC-730 Image SPC-730 Image<br />
Set<br />
Reverse Y<br />
in Display<br />
Parameters<br />
Image in the Microscope SPC-730 Image SPC-730 Image<br />
Some microscopes, e.g. the older Leica SP1, deliver pixel clock pulses both at the start and at<br />
the end of each line. The result is an image as shown in the figure below. If you have effects<br />
like this please contact BH. We have adapters to transform odd scan control signals into<br />
useful frame and line pulses.<br />
21
Contact<br />
BH for<br />
Adapter<br />
Image in the Microscope SPC-730 Image SPC-730 Image<br />
Assistance through bh<br />
Software updates, new manual versions and application notes about new applications are<br />
available from our web site www.becker-hickl.de. Furthermore, we are pleased to support you<br />
in all problems concerning the measurement of fast electrical or optical signals. This includes<br />
discussions of new applications, the installation of the SPC modules, their application to your<br />
measurement problem, the technical environment and physical problems related to short time<br />
measurement techniques. Simply call us or send us an email.<br />
Should there be a problem with your SPC module, please contact us. To fix the problem we<br />
ask you to send us a data file (.sdt) of the questionable measurement or (if a measurement is<br />
not possible) a setup file (.set) with your system settings. Furthermore, please add as much as<br />
possible of the following information:<br />
Description of the Problem<br />
SPC Module Type and Serial Number<br />
Software Version<br />
Type of the Microscope<br />
Detector type, Operating voltage of the detector, PMT Cathode type<br />
Preamplifier type, Gain, Bandwidth etc.<br />
Laser System: Type, Repetition Rate, Wavelength, Power<br />
SYNC Signal Generation: Photodiode, Amplitude, Rise <strong>Time</strong><br />
System Connections: Cable Lengths, Ground Connections. Add a drawing if necessary.<br />
Environment: Possible Noise Sources<br />
Your personal data: E-mail, Telephone Number, Postal Address<br />
The fastest way is to send us an email with the data file(s) attached. We will check your<br />
system settings and – if necessary – reproduce your problem in our lab. We will send you an<br />
answer within one or two days.<br />
Becker & Hickl GmbH<br />
Nahmitzer Damm 30<br />
12277 Berlin<br />
Tel. +49 / 30 / 787 56 32<br />
FAX +49 / 30 / 787 57 34<br />
http://www.becker-hickl.com<br />
email: info@becker-hickl.com<br />
or becker@becker-hickl.com<br />
22
Literature<br />
[1] SPC-134 through SPC-730 TCSPC Modules, Operating Manual. Becker & Hickl GmbH,<br />
www.becker-hickl.com.<br />
[2] Photomultiplier Tube, Principle to Application. Hamamatsu <strong>Photon</strong>ics 1994<br />
[3] R3809U Series data sheet. Hamamatsu <strong>Photon</strong>ics 1995, www.hamamatsu.com<br />
[4] K. König, Multiphoton microscopy in life sciences, Journal of Microscopy 200 (1999) 1-23<br />
[5] A. Schönle, Markus Glatz, Stefan Hell, Four-dimensional multiphoton microscopy with time-correlated<br />
single-photon counting, Appl. Opt. 39 (2000) 6306-6311<br />
[6] W. Becker, A. Bergmann, K. Koenig, U. Tirlapur, Picosecond fluorescence lifetime microscopy by TCSPC<br />
imaging. Proc. SPIE 4262, 414-419<br />
[7] K. König, P.T.C. So, W.W. Mantulin, B.J. Tromberg, E. Gratton, Two-<strong>Photon</strong> excited lifetime imaging of<br />
autofluorescence in cells during UVA and NIR photostress. J. Microsc. 183, 197-204<br />
[8] Femtolight series fiber lasers, IMRA America Inc., www.imra.com<br />
[9] Pulsed diode lasers, PicoQuant GmbH, www.picoquant.com<br />
23
Contents<br />
Introduction............................................................................................................................................................. 1<br />
The Light Source ................................................................................................................................................ 1<br />
Titanium-Sapphire Lasers.............................................................................................................................. 1<br />
Frequency Doubled Titanium-Sapphire Lasers.............................................................................................. 1<br />
Fibre Lasers ................................................................................................................................................... 2<br />
Pulsed Diode Lasers ...................................................................................................................................... 2<br />
The Microscope.................................................................................................................................................. 2<br />
The TCSPC Imaging Module ............................................................................................................................. 3<br />
The Detector....................................................................................................................................................... 4<br />
Built-in PMTs................................................................................................................................................ 4<br />
PMH-100 PMT Module ................................................................................................................................ 4<br />
H5783 Photosensor Module .......................................................................................................................... 5<br />
R3809U MCP PMT....................................................................................................................................... 5<br />
SPCM-AQR Avalanche Photodiode Modules............................................................................................... 5<br />
Hamamatsu H7222 Modules.......................................................................................................................... 6<br />
The DCC-100 detector controller .................................................................................................................. 6<br />
Preamplifiers.................................................................................................................................................. 6<br />
System Setup ........................................................................................................................................................... 8<br />
Attaching the detector......................................................................................................................................... 8<br />
Using the built-in detectors............................................................................................................................ 8<br />
Fibre Coupling............................................................................................................................................... 9<br />
Non-Descanned Detection ........................................................................................................................... 10<br />
Two-<strong>Photon</strong> <strong>Systems</strong> ........................................................................................................................................ 10<br />
Optical System............................................................................................................................................. 10<br />
Selection of Detectors.................................................................................................................................. 12<br />
System Connections.......................................................................................................................................... 13<br />
Detector Signals........................................................................................................................................... 14<br />
Scan Control Signals.................................................................................................................................... 15<br />
Synchronisation with the Laser.................................................................................................................... 16<br />
First Light.............................................................................................................................................................. 17<br />
Detecting the first <strong>Photon</strong>s................................................................................................................................ 17<br />
Adjusting the Sync Signal............................................................................................................................ 17<br />
Adjusting the detector.................................................................................................................................. 17<br />
Adjusting time scale and delay .................................................................................................................... 18<br />
Recording the first image.................................................................................................................................. 19<br />
Adjusting image size and image location..................................................................................................... 20<br />
Assistance through bh............................................................................................................................................ 22<br />
Literature............................................................................................................................................................... 23<br />
Index...................................................................................................................................................................... 25<br />
24
Index<br />
2-<strong>Photon</strong> <strong>Systems</strong> 10<br />
ADC 3, 13<br />
Adjusting the Image 20<br />
Adjusting the Sync Signal 17<br />
Adjusting, Delaye 18<br />
Adjusting, detector 17<br />
Adjusting, TAC Gain 18<br />
Adjusting, TAC Offset 18<br />
Adjusting, <strong>Time</strong> Scale 18<br />
Amplifiers, for detector signals 6<br />
Assistance through bh 22<br />
Avalanche Photodiodes 5<br />
Baffling 11<br />
Beam Diameter 11<br />
BG39 Filter 11<br />
Bialakali Cathode 12<br />
Blocking Filter 11<br />
Built-In Detectors, connecting 14<br />
Built-in PMT, adjusting CFD parameters 17<br />
Built-in PMTs 4, 8<br />
C3350s 15<br />
CFD 3, 13<br />
Condensor Lens, reflection at 11<br />
Count Rate 4<br />
<strong>Counting</strong> Efficiency 3<br />
Dark Count Rate 12<br />
DCC-100 detector controller 6<br />
Depth Resolution, 2-photon 2<br />
Depth resolution, by pinhole 2<br />
Descanned Detection 8, 9<br />
Detection, descanned 8, 9<br />
Detection, non-descanned 10<br />
Detection, trough fibre output 9<br />
Detection, trough scanning head 8, 9<br />
Detector Control 6<br />
Detector Overload 10<br />
Detectors 4<br />
Detectors, APDs 5<br />
Detectors, built-in PMTs 4, 8<br />
Detectors, connecting 14<br />
Detectors, for fibre coupling 9<br />
Detectors, H5783 5<br />
Detectors, H7222 6<br />
Detectors, MCPs 5<br />
Detectors, PMH-100 4<br />
Detectors, R3809U 5<br />
Detectors, selection for 2-photon microscope 12<br />
Detectors, spectral response 12<br />
Dielectric Filters 11<br />
Dielectric Filters, stacking 11<br />
Diode Laser 2<br />
Fibre Coupling, of detector 9<br />
Fibre Laser 2<br />
Fibre Output, detectors for 9<br />
Fibre Output, LSM-510 9<br />
Filter, BG39 11<br />
Filter, dielectric 11<br />
Filter, stacks of 11<br />
First Image 19<br />
First Light 17<br />
Frame Sync 3, 13, 15<br />
H5783 Detector Module 5<br />
H7222 Detector Module 6<br />
HCN14-3500 15<br />
HFAC-26 Preamplifier 6, 14, 15<br />
High Voltage Power Supplies 15<br />
IRF, peaks by scattering 11<br />
Laser, beam diameter 11<br />
Laser, Fibre 2<br />
Laser, Pulsed Diode 2<br />
Laser, Titanium-Sapphire 1<br />
Line Sync 3, 13, 15<br />
Max Count 19<br />
MCP PMTs 5<br />
Microscope, Scanning principle 2<br />
Multialkali Cathode 12<br />
NDD 10<br />
Non-Descanned Detection 10<br />
Overload, of detector 10<br />
Overload, warning 14, 15<br />
PHD-400 Photodiode Module 16<br />
Photodiode, for synchronisation 16<br />
Pinhole 2, 8, 9<br />
Pixel Clock 3, 13, 15<br />
Pixel Clock, double 21<br />
Pixel Clock, internal 16, 19<br />
Pixel <strong>Time</strong> 19<br />
PMH-100 Detector Module 4<br />
PMH-100, adjusting CFD parameters 17<br />
PMH-100, connecting the 14<br />
Preamplifiers 6<br />
R3809U 5<br />
R3809U, adjusting CFD parameters 17<br />
R3809U, connecting the 15<br />
Reflections, at condensor lens 11<br />
Scan Control Signals 3, 13, 15<br />
Scan Control Signals, missing 19<br />
Scan Control, cables 16<br />
Scanning Microscope, principle 2<br />
Scattering, at microscope lens 11<br />
Scattering, in 2-<strong>Photon</strong> <strong>Systems</strong> 11<br />
Scattering, peaks in IRF 11<br />
SPC-730 TCSPC Module 13<br />
SPCM-AQR 5<br />
Spectral Response, of detector 12<br />
Sync Frequency Divider 18<br />
Synchronisation, with laser 16<br />
Synchronisation, with scanning 15<br />
TAC 3, 13<br />
TAC Gain 18<br />
TAC Offset 18<br />
TCSPC 3<br />
TCSPC Imaging 3, 13<br />
TCSPC, count rate 4<br />
TCSPC, time resolution 4<br />
<strong>Time</strong> Resolution 4<br />
<strong>Time</strong>-<strong>Correlated</strong> <strong>Single</strong> <strong>Photon</strong> <strong>Counting</strong> 3<br />
Titanium-Sapphire Laser 1<br />
T-Window 20<br />
Two-<strong>Photon</strong> Absorption 2<br />
Two-<strong>Photon</strong> <strong>Systems</strong> 10<br />
Window Parameters 20<br />
25
Becker & Hickl GmbH Dec. 2001 Printer HP 4000 PS<br />
Intelligent Measurement<br />
and Control <strong>Systems</strong><br />
Tel. +49 / 30 / 787 56 32<br />
FAX +49 / 30 / 787 57 34<br />
http://www.becker-hickl.de<br />
email: info@becker-hickl.de<br />
DCC-100<br />
Detector Control Module<br />
PCI compatible detector control module for single photon counting experiments<br />
- Power supply and gain control for Hamamatsu H7422, H5783 or H5773modules<br />
- Gain control for Hamamatsu R3809U MCP via FuG power supplies<br />
- Overload shutdown of detectors in conjunction with bh HFAC-26 preamps<br />
- Power supply for thermoelectric coolers, particularly for H7422<br />
- Short circuit protected +12V, +5V and -5V power supply for preamps and detectors<br />
- Software switched +12V, +5V and -5V power supply outputs for detector on/off control<br />
- High current digital outputs for shutter and filter control<br />
- PCI card, software for Windows 95, 98, 2000 and NT<br />
1
Introduction<br />
The DCC-100 module is used to control detectors in conjunction with bhphoton counters. It<br />
can be used to control the gain of the Hamamatsu H7422, H5783, H6783 or similar photosensor<br />
modules by software. The gain of MCPs and PMTs can be controlled via the FuG HCN-14 High<br />
Voltage Power Supply. In conjunction with EK preamplifiers, overload shutdown of the detectors can<br />
be achieved. Furthermore, the DCC-100 delivers the current for thermoelectric coolers, i.e. for the<br />
Hamamatsu H7422. High current digital outputs are available for shutter or filter control. The DCC-<br />
100 is a PCI module for IBM compatible computers. It works under Windows 95, 98, 2000 and NT.<br />
Structure of the DCC-100<br />
The block diagram of the DCC-100 is shown in the figure below.<br />
Detector Control<br />
Connector 1<br />
Power Switches<br />
Connector 2<br />
Detector Control<br />
Connector 3<br />
on/off<br />
shdn<br />
on/off<br />
on/off<br />
Vcont<br />
shdn<br />
+12V<br />
Short Protection<br />
+12V<br />
on/off +12V<br />
Short Protection<br />
+12V<br />
on/off<br />
shdn<br />
+12V<br />
Short Protection<br />
+5V<br />
+5V<br />
+5V<br />
+5V<br />
+5V<br />
on/off<br />
on/off<br />
Short Protection<br />
Short Protection<br />
Short Protection<br />
-5V<br />
-5V<br />
-5V<br />
-5V<br />
-5V<br />
on/off<br />
on/off<br />
Short Protection<br />
Short Protection<br />
Short Protection<br />
0..0.9V<br />
12 bit DAC Power Switches<br />
Vcont 12 bit DAC<br />
Detector Gain 0..10V<br />
on/off<br />
shdn<br />
Detector Gain<br />
+12V<br />
+5V<br />
-5V<br />
0..0.9V<br />
0..10V<br />
reset<br />
Overload<br />
Flip-Flop<br />
/OVLD<br />
DCC-100 Block Diagram<br />
shdn<br />
Jumper<br />
shdn<br />
reset<br />
Vpel<br />
Ipel<br />
on/off<br />
Overload<br />
Flip-Flop<br />
Peltier Power<br />
Supply<br />
0..5V 0..2A<br />
/OVLD<br />
Pel+<br />
Pel-<br />
The DCC-100 contains two detector control blocks and one general purpose power switch<br />
block.<br />
Detector control blocks<br />
The detector control blocks contain power supply outputs for detectors, a digital-to analog<br />
converter (DAC) for detector gain control, and an overload shutdown circuit.<br />
The power supply outputs are short-circuit-protected and deliver +12 V, +5 V and -5 V. The<br />
outputs can be switched on an off by software.<br />
A 12 bit DAC is used to control the gain of the detector. It delivers the 0 to +0.9 V control<br />
voltage required for Hamamatsu photosensor modules (H7422, H5783, H57783 etc.) and a<br />
0 to +10 V control voltage for FuG high voltage power supplies.<br />
Both detector control block have a detector overload shutdown function. The shutdown<br />
function works in conjunction with bh HFAC-26 preamplifiers. If the preamplifier detects an<br />
overload condition it sends an active low overload signal (/ovld) to the DCC-100. This signal<br />
sets the overload flip-flop which shuts down the detector control voltage and the +12 V<br />
detector power supply. Furthermore, it can be used to deactivate the switches in the power<br />
switch block (see below).<br />
One of the detector control blocks contains a power supply for thermoelectric coolers.<br />
2
Power switch block<br />
The power switch block contains power supply outputs for detectors and preamplifiers and<br />
eight high-current MOSFET switches to operate shutters, motors or magnetic actuators.<br />
The power supply outputs are short-circuit-protected and deliver +12 V, +5 V and -5 V. The<br />
outputs can be switched on an off by software.<br />
The MOSFET switches are able to switch currents up to 2A and voltages up to 20V. One side<br />
of each switch is connected to ground, the other side is available at the output connector. The<br />
switches are not short circuit protected.<br />
The power switches can be shut down (i.e. set into the non-conducting state) by one or both<br />
overload signals from the detector control blocks. The configuration is set by jumpers on the<br />
DCC-100 board.<br />
Power supply for thermoelectric cooler<br />
Power supply for thermoelectric coolers is available at connector 3. The output can supply up<br />
to 5 V and 2 A. Both voltage and current can be selected by software. The device<br />
automatically controls either the output voltage or the output current. Voltage control is active<br />
as long as the current through the load is smaller than the current limit set by the software.<br />
When the current through the load reaches the current limit the device automatically switches<br />
to current control. A block diagram is shown in the figure below.<br />
+12V<br />
from PC<br />
reference<br />
'voltage'<br />
Switching<br />
Regulator<br />
R1<br />
A1<br />
D1<br />
feedback -<br />
+<br />
reference<br />
'current'<br />
PEL+<br />
PEL-<br />
+<br />
Cooler<br />
-<br />
R2<br />
R3<br />
0.25 Ohm<br />
Power supply for cooler<br />
A switching regulator is used to generate the supply current for the cooler. The cooling current<br />
flows through the sensing resistor R3. As long as the voltage at R3 is smaller than the<br />
reference voltage at A1 (‘current’ reference) A1 is inactive and the switching regulator works<br />
as a normal voltage stabiliser. If the voltage at R3 exceeds the reference voltage at A1, the<br />
amplifier becomes active, and, via D1, overwrites the feedback voltage of the switching<br />
regulator. This causes the regulator to reduce the output voltage until the voltage at R3 equals<br />
the reference of A1.<br />
Please note that the current control can work only if the cooling current flows back into the<br />
’PEL-‘ pin of the DCC-100. Therefore make sure that the ‘-‘ side of the cooler is not<br />
connected to ground.<br />
3
Applications<br />
Some applications of the DCC-100 are described below.<br />
Controlling the H7422<br />
The H7422 is a high speed, high sensitivity PMT<br />
module of Hamamatsu. It contains a GaAs<br />
photomultiplier along with a thermoelectric<br />
cooler and a high voltage generator. The<br />
resolution in the TCSPC (time-correlated single<br />
photon counting) mode is typically 250 ps. The<br />
H7422 comes in different cathode versions for the<br />
wavelength range up to 1100 nm.<br />
The recommended connection to the DCC-100 is<br />
shown in the figure right. The H7422 is connected<br />
to ‘Connector 3’ of the DCC-100. The DCC-100<br />
delivers the +12 V operating voltage, the<br />
0 to 0.9 V gain control voltage, and the current for the thermoelectric cooler. The output signal<br />
of the PMT is amplified by the HFAC-26-1 preamplifier. The single photon pulses at the<br />
output of the amplifier have a few 100 mV amplitude and are used to trigger the CFD input of<br />
a EK TCSPC module (SPC-300 through SPC-730, see manual at www.becker-hickl.de).<br />
The HFAC-26-1 amplifier monitors the output current of the H7422. If an average current of<br />
1 uA is exceeded the /ovld signal of the HFAC-26 goes to ‘low’. This sets the overload<br />
flip-flop in the DCC, and the gain control voltage and the +12 V at connector 3 are shut down.<br />
Notice: The H7422 has its own overload shutdown. The H7422 may shut down if the gain<br />
control voltage changes at a rate faster than 10 V/s. The changing rate of the gain control<br />
voltage in the DCC-100 is kept below the critical value. If the H7422 shuts down internally<br />
for whatever reason, it can be re-activated by cycling the +12 V operating voltage.<br />
Don’t connect or disconnect the signal cable from the detector to the preamplifier when the<br />
detector is switched on. This can destroy the amplifier. Make sure that the +12 V at<br />
connector 2 is switched on. Otherwise the HFAC does not work, and the overload protection<br />
is inactive.<br />
Controlling H5783 and H5773 photosensor modules<br />
The H5783 and the H5773 are high speed miniature PMT<br />
DCC<br />
modules of Hamamatsu. The modules contain a small<br />
to SPC module<br />
photomultiplier along with high voltage generator. The<br />
1<br />
CFD in<br />
resolution in the TCSPC (time-correlated single photon<br />
+12V<br />
counting) mode is typically 150 to 200 ps. The H5783<br />
gnd<br />
2<br />
HFAC-26-10<br />
comes in various cathode versions for the wavelength<br />
/ovld<br />
range up to 820 nm. The H5783 can be controlled in a<br />
PMT Out<br />
H5783P<br />
+12V<br />
similar way as the H7422. The connections are shown in<br />
+12V<br />
3<br />
Gain Cont 0..0.9V<br />
the figure right. A HFAC-26-10 preamplifier with a<br />
gnd<br />
10 µA overload threshold is used to amplify the single<br />
Power supply and gain control of H5783<br />
photon pulses and to send an overload signal to the DCC-<br />
with overload shutdown<br />
100.<br />
A second H5783 can be controlled separately via connector 1. In this case the power supply<br />
for both HFAC amplifiers should be derived from connector 2.<br />
4<br />
DCC<br />
1<br />
2<br />
3<br />
gnd<br />
to SPC module<br />
CFD in<br />
+12V<br />
HFAC-26-1<br />
/ovld<br />
PMT Out<br />
+12V<br />
Gain Cont 0..0.9V<br />
Peltier +<br />
Peltier -<br />
gnd<br />
+12V<br />
Fan<br />
H7422<br />
Power supply and gain control of H7422<br />
with overload shutdown
Don’t connect or disconnect the signal cable from the detector to the preamplifier when the<br />
detector is switched on. This can destroy the amplifier. Make sure that the +12 V at connector<br />
2 is switched on. Otherwise the HFAC does not work, and the overload protection is inactive.<br />
Controlling an R3809U MCP PMT<br />
The Hamamatsu R3809U is the fastest photon counting detector currently available. It uses a<br />
microchannel plate for electron multiplication. In the TCSPC mode a time resolution of less<br />
than 30 ps (fwhm) can be achieved. MCP PMTs are extremely sensitive to overload. Because<br />
the microchannels are continuously destroyed by sputtering the lifetime of the detector is<br />
limited. The degradation effect is not noticeable under normal operating conditions. However,<br />
overloading the detector can rapidly exhaust the residual lifetime. Therefore, MCP PMTs<br />
should always be operated with overload protection, or at least with an overload indicator.<br />
The figure right shows how an R3809U MCP can be<br />
operated with overload protection. An FuG HCN-14 is<br />
used as an high voltage power supply for the R3809U.<br />
The HCN-14 is available with a 0 to 10 V control input.<br />
The high voltage is proportional to the control voltage.<br />
Therefore, the detector operation voltage can be controlled<br />
by the DCC-100 and be shut down on overload.<br />
For overload detection, the HFAC-26-01 preamplifier<br />
(with an overload threshold of 0.1 µA) is used.<br />
Notice: Please observe the usual safety rules when<br />
working with high voltage. Make sure that there is a<br />
reliable ground connection between the detector and the<br />
HFAC-26-01<br />
to SPC module<br />
CFD in<br />
MCP Out<br />
HV power supply. Don’t use broken cables, loose connectors or cables with insufficient<br />
insulation.<br />
Don’t connect or disconnect the signal cable from the detector to the preamplifier when the<br />
detector is switched on. This can destroy the amplifier. Make sure that you connected all<br />
ground connections. Missing ground connections can result in an high voltage instability or<br />
unreliable overload shutdown.<br />
Make sure that the +12 V at connector 2 is switched on. Otherwise the HFAC does not work,<br />
and the overload protection is inactive.<br />
DCC<br />
+12V<br />
gnd<br />
/ovld<br />
/ovld<br />
HV Cont 0..10V<br />
gnd<br />
HV<br />
R3809U<br />
FuG<br />
HCN<br />
Overload shutdown for R3809U MCP<br />
Controlling PMH-100 detectors<br />
The PMH-100 of bh is a simple detector head that<br />
contains a Hamamatsu photosensor module, a<br />
preamplifier, and an optical and acoustical overload<br />
indicator. Since there is no overload signal available<br />
from the PMH-100 it cannot be automatically shut<br />
down on overload. Up to three detectors can,<br />
however, switched on and off via the DCC-100. By<br />
connecting the detectors to an bh SPC module via a<br />
HRT-41 or HRT-81 router, the signals of all<br />
detectors can be recorded simultaneously. Or, by<br />
switching only one detector on, the desired detector<br />
can be selected for measurement. The configuration<br />
is exceptionally useful for laser scanning<br />
microscopes which normally use several detectors in<br />
different light paths.<br />
DCC<br />
1<br />
2<br />
3<br />
+12V switchable<br />
gnd<br />
+12V switchable<br />
gnd<br />
+12V switchable<br />
gnd<br />
HRT-41<br />
Routing<br />
Module<br />
PMH-100<br />
PMH-100<br />
PMH-100<br />
to SPC, CFD<br />
Switching on/off PMH-100 detectors<br />
5
Controlling Shutters<br />
Shutters can be controlled via the power<br />
switches of connector 2. The switches can<br />
operate a voltage up to 20 V and up to 2 A.<br />
The power supply for the external load can be<br />
taken from connector 2 if a current of 100 mA<br />
at +12 V or 200 mA at +5 V is not exceeded.<br />
For higher currents an external power supply<br />
must be used.<br />
Since shutters and other magnetic devices are<br />
inductive loads a flyback diode must be<br />
connected across the load. For supply voltage<br />
up to 12 V a resistor can be connected in series<br />
with the flyback diode to achieve a faster turnoff<br />
time. The value of the resistor should be about the DC resistance of the actuator or shutter<br />
coil.<br />
The switches can automatically be shut down (i.e. set into the non-conducting state) when an<br />
overload condition occurs at connector 1 or connector 2. Which of the overload inputs is used<br />
for shutdown can be selected by jumpers on the DCC-100 board.<br />
Sometimes it is required to lock a shutter in the<br />
‘closed’ state as long as a potential overload<br />
condition persists. An example is a microscope<br />
with a mercury or halogen lamp. When the<br />
lamp is on, opening the shutter must be<br />
inhibited. A solution is shown in the figure<br />
right. The photodiode detects the light from the<br />
lamp, and the amplifier sends an ‘/ovld’ to the<br />
DCC-100. The signal can be connected<br />
parallel to the /ovld from the amplifier.<br />
As long as the lamp is on, /ovld remains ‘low’<br />
and the shutter cannot be opened. This gives<br />
additional safety against detector damage.<br />
It must, however, be pointed out that an<br />
absolute safety against detector damage cannot be achieved in this way. If the lamp is<br />
switched on when the shutter is open it takes a few milliseconds until the overload is detected<br />
and the shutter closes. This can be enough to cause severe detector damage. Therefore, the<br />
best way is always an mechanical interlock so that the lamp path is closed when the detection<br />
path is opened.<br />
DCC<br />
1<br />
2<br />
3<br />
DCC<br />
1<br />
2<br />
3<br />
b0 Out<br />
b1 Out<br />
b0<br />
+12V<br />
/ovld<br />
Actuator<br />
Shutter<br />
+12V<br />
Filter<br />
+12V<br />
Controlling shutters and filters<br />
HFAC26<br />
BC850<br />
Detector<br />
1k<br />
shutter<br />
off-closed<br />
AD820<br />
+12V<br />
10p<br />
100M<br />
-<br />
+<br />
+12 to +20V<br />
to switch<br />
Pin Assignment<br />
Connector 1<br />
15pin HD-SubD<br />
Pin Signal<br />
1 +5V out switchable<br />
2<br />
3<br />
4<br />
5 GND<br />
6 -5V out switchable<br />
7<br />
8<br />
9<br />
10 +12V out switchable, ovld sdwn<br />
11 -12V out<br />
12 0...+10V HV cont., ovld sdwn<br />
13 0...+0.9V gain cont., ovld sdwn<br />
14 /OVLD1 input<br />
15 GND<br />
Connector 2<br />
15pin HD-SubD<br />
Pin Signal<br />
1 +5V out switchable<br />
2 Bit0 open drain out<br />
3 Bit1 open drain out<br />
4 Bit2 open drain out<br />
5 GND<br />
6 -5V out switchable<br />
7 Bit3 open drain out<br />
8 Bit4 open drain out<br />
9 Bit5 open drain out<br />
10 +12V out switchable<br />
11 -12V out<br />
12 Bit6 open drain out<br />
13 Bit7 open drain out<br />
14<br />
15 GND<br />
Connector 3<br />
15pin HD-SubD<br />
Pin Signal<br />
1 +5V out switchable<br />
2 Peltier +<br />
3 Peltier +<br />
4 Peltier +<br />
5 GND<br />
6 -5V out switchable<br />
7 Peltier -<br />
8 Peltier -<br />
9 Peltier -<br />
10 +12V out, switchable, ovld sdwn<br />
11 -12V out<br />
12 0...+10V HV cont., ovld sdwn<br />
13 0...+0.9V gain cont., ovld sdwn<br />
14 /OVLD3 input<br />
15 GND<br />
Installation<br />
Requirements to the Computer<br />
The computer must be a Pentium PC with a graphics card of 1024 by 628 resolution or more.<br />
There must be enough free PCI slots to insert the required number of DCC-100 modules.<br />
Although computer speed is usually not an issue for the DCC-100 we recommend a computer<br />
with a speed of at least 300 MHz.<br />
Installation of the DCC-100 Software<br />
The installation of the DCC-100 Standard Software is simple - start setup.exe from the<br />
installation disk.<br />
You can install the software also from the Becker & Hickl web site, e.g. if you want to<br />
upgrade your system with a new computer and a new DCC software version has been released<br />
in the meantime. In this case proceed as described under ‘Update from the Web’.<br />
The DCC software is based on 'LabWindows/CVI' of National Instruments. Therefore the socalled<br />
'CVI Run-<strong>Time</strong> Engine' is required to run the DCC software. The 'Run-<strong>Time</strong> Engine'<br />
contains the library functions of LabWindows CVI and is loaded together with the DCC<br />
software. The installation routine suggests a special directory to install the Run-<strong>Time</strong> Engine.<br />
If the required version of the Run-<strong>Time</strong> Engine is already installed for another application, it<br />
is detected by the installation program and shared with the existing LabWindows CVI<br />
applications.<br />
Software Update<br />
If you install a new DCC software version over an older one only the files are copied which<br />
have a newer date. This, to a certain extend, avoids overwriting setup files such as auto.set<br />
(the last system settings). Consequently, you cannot install an older software version in place<br />
of a newer one. If you want to do this (normally there is no reason why you should), run the<br />
‘Uninstall’ program before installing.<br />
7
Update from the Web<br />
The latest software versions are available from the Becker & Hickl web site. Open<br />
www.becker-hickl.de, and click on ‘Software’.<br />
Click on ‘Download’, ‘Windows 95/98/NT/2000’. Choose the DCC-100 software and get a<br />
ZIP file containing the complete installation. Unpack this file into a directory of your choice<br />
and start setup.exe. The installation will run as usual.<br />
For a new software version we recommend also to download the corresponding manual. Click<br />
on ‘Literature’, ‘Manuals’ and download the PDF file. Please see also under ‘Applications’ to<br />
find notes about typical applications of the DCC in conjunction with bh photon counters.<br />
Installation of the DCC-100 Module<br />
To install the DCC-100, switch off the computer and insert the DCC module(s). To avoid<br />
damage due to electrostatic discharge we recommend to touch the module at the metallic back<br />
shield. Then touch a metallic part of the computer with the other hand. Then insert the module<br />
into a free slot of the computer.<br />
The DCC-100 has a PCI interface. Windows has a list of PCI devices, and on the start of the<br />
system it automatically assigns the required hardware resources to the components of this list.<br />
When the computer is started first time with the DCC inserted Windows detects the DCC and<br />
updates the list of hardware components. Therefore it asks for driver information from a disk.<br />
Although this information is not actually required for the DCC you should select the driver<br />
information file from the driver disk delivered with the module.<br />
If you don’t have the driver disk, please download the driver file from www.becker-hickl.com<br />
or www.becker-hickl.de, ‘Software’, ‘Windows 95/98/NT/2000’ or ‘Windows 3.1’, ‘Device<br />
drivers for bh modules’.<br />
8
<strong>Boston</strong> Electronics Corporation, 91 Boylston St, Brookline MA 02445 USA * (800)3477-5445 or (617)566-3821 * fax (617731-0935 * tcspc@boselec.com<br />
Target Application<br />
SPC-630 SPC-730 SPC-830 SPC-134 <strong>Time</strong> Harp 200<br />
Standard lifetime experiments<br />
<strong>Single</strong> Molecule Detection<br />
Stopped Flow<br />
Correlation Experiments<br />
FCS Experiments<br />
Standard lifetime experiments,<br />
Lifetime imaging, Confocal<br />
and two-photon scanning<br />
Microscopy<br />
Multi parameter experiments<br />
Stopped Flow<br />
Standard lifetime experiments,<br />
Lifetime imaging, Confocal<br />
and two-photon scanning<br />
Microscopy<br />
Multi parameter experiments<br />
Stopped Flow<br />
<strong>Single</strong> Molecule Detection<br />
Correlation Experiments<br />
FCS Experiments<br />
Optical tomography<br />
<strong>Single</strong> Molecule<br />
Stopped Flow<br />
Correlation Experiments<br />
FCS Experiments<br />
No. of TCSPC Channels 1 1 1 4 1<br />
Modules operable in parallel 4 x SPC-630 4 x SPC-730 4 x SPC-830 1 x SPC-134<br />
TAC - ADC with error<br />
reduction<br />
TAC - ADC with error<br />
reduction<br />
TAC - ADC with error<br />
reduction<br />
TAC - ADC with error<br />
reduction<br />
Standard lifetime<br />
<strong>Single</strong> Molecule<br />
Microscope with scan stage<br />
Correlation Experiments<br />
FCS Experiments<br />
Conversion Principle<br />
<strong>Time</strong>-to-Digital Converter<br />
Patent DE 43 39 784 A1 Patent DE 43 39 784 A1 Patent DE 43 39 784 A1 Patent DE 43 39 784 A1<br />
Detector Channel<br />
Constant Fraction<br />
Constant Fraction<br />
Constant Fraction<br />
Constant Fraction<br />
Constant Fraction<br />
Sync Channel<br />
Constant Fraction<br />
Constant Fraction<br />
Constant Fraction<br />
Constant Fraction<br />
Level Trigger<br />
<strong>Time</strong> Resolution 820 fs per time channel 820 fs per time channel 820 fs per time channel 820 fs per time channel 40 ps per time channel<br />
Diff. nonlinearity 0.6% to 1% pp,
<strong>Boston</strong> Electronics Corporation, 91 Boylston St, Brookline MA 02445 USA * (800)3477-5445 or (617)566-3821 * fax (617731-0935 * tcspc@boselec.com<br />
Available multi-detector<br />
extension devices for<br />
Operating Modes<br />
SPC-630 SPC-730 SPC-830 SPC-134 <strong>Time</strong> Harp 200<br />
4 MCPs, 4 PMTs<br />
8 MCPs, 8 PMTs<br />
8 APDs<br />
16 channel pmt head<br />
<strong>Single</strong><br />
Oscilloscope<br />
2 dimensional f(xyt)<br />
Sequence f(t,T), fi(t,ext)<br />
Spectrum fi(T), fi(ext)<br />
Continuous Flow (unlimited<br />
seq.)<br />
<strong>Time</strong> Tag (FIFO)<br />
4 MCPs, 4 PMTs<br />
8 MCPs, 8 PMTs<br />
8 APDs<br />
16 channel pmt head<br />
<strong>Single</strong><br />
Oscilloscope<br />
2 dimensional f(xyt)<br />
Sequence f(t,T), fi(t,ext)<br />
Spectrum fi(T), fi(ext)<br />
Imaging (Sync In, Sync Out,<br />
XY in, XY out)<br />
4 MCPs, 4 PMTs<br />
8 MCPs, 8 PMTs<br />
8 APDs<br />
16 channel pmt head<br />
<strong>Single</strong><br />
Oscilloscope<br />
2 dimensional f(xyt)<br />
Sequence f(t,T), fi(t,ext)<br />
Spectrum fi(T), fi(ext)<br />
Imaging (Sync In, Sync Out,<br />
XY in)<br />
<strong>Time</strong> Tag (FIFO)<br />
4 MCPs, 4 PMTs<br />
8 MCPs, 8 PMTs<br />
8 APDs<br />
<strong>Single</strong><br />
Oscilloscope<br />
2 dimensional f(xyt)<br />
Sequence f(t,T), fi(t,ext)<br />
Spectrum fi(T), fi(ext)<br />
Continuous Flow (unlimited<br />
seq.)<br />
<strong>Time</strong> Tag (FIFO)<br />
4 APDs<br />
Integration<br />
Oscilloscope<br />
Sequence f(t,T)<br />
Contiuous<br />
<strong>Time</strong>-tag (Option)<br />
Experiment Trigger<br />
Triggered accumulation of<br />
sequences<br />
Detector / Experiment control<br />
(Own products only)<br />
Free Documentaion available<br />
on web site<br />
Related Products<br />
(Own products only)<br />
Start of measurement<br />
Start of sequence<br />
Each step of sequence<br />
Start of measurement<br />
Start of sequence<br />
Each step of sequence<br />
Frame Clock, Line Clock, Pxl<br />
Clock<br />
Start of measurement<br />
Start of sequence<br />
Each step of sequence<br />
Frame Clock, Line Clock, Pxl<br />
Clock<br />
Start of measurement<br />
Start of sequence<br />
Each step of sequence<br />
yes yes yes yes<br />
Preamplifiers with detector<br />
overload protection, PMH-100<br />
Detector modules, PML-16<br />
multichannel detector head,<br />
DCC-100 Detector Controller ,<br />
STP-340 Step Motor<br />
Controller,<br />
Routers for MCPs, PMTs,<br />
APDs, Dual ADC module for<br />
XY In operation<br />
Preamplifiers with detector<br />
overload protection, PMH-100<br />
Detector modules, PML-16<br />
multichannel detector head,<br />
DCC-100 Detector Controller ,<br />
STP-340 Step Motor<br />
Controller,<br />
Routers for MCPs, PMTs,<br />
APDs, Dual ADC module for<br />
XY In operation, Adapters for<br />
Zeiss, Leica, Olympus and<br />
Biorad laser scanning<br />
microscopes<br />
Preamplifiers with detector<br />
overload protection, PMH-100<br />
Detector modules, PML-16<br />
multichannel detector head,<br />
DCC-100 Detector Controller ,<br />
STP-340 Step Motor<br />
Controller,<br />
Routers for MCPs, PMTs,<br />
APDs, Dual ADC module for<br />
XY In operation, Adapters for<br />
Zeiss, Leica, Olympus and<br />
Biorad laser scanning<br />
microscopes<br />
Preamplifiers with detector<br />
overload protection, PMH-100<br />
Detector modules, PML-16<br />
multichannel detector head,<br />
DCC-100 Detector Controller ,<br />
STP-340 Step Motor<br />
Controller,<br />
Routers for MCPs, PMTs,<br />
APDs<br />
SPC Manual, 165 pages; TCSPC Introduction, 5 pages; Upgrading laser scanning microscopes for lifetime imaging; Controlling SPC<br />
modules; Protecting Photomultipliers; FRET measurements by TCSPC lifetime microscopy; Multi-wavelengthe TCSPC lifetime<br />
imaging; High count rate multichannel TCSPC for optical tomography; Optical Tomography: TCSPC Imaging of Female Breast;<br />
Setting up High Gain Detector Electronics for TCSPC Applications; Testing SPC Modules; 16 Channel Detector Head for TCSPC<br />
Modules; Routing Modules for <strong>Time</strong>-<strong>Correlated</strong> <strong>Single</strong> <strong>Photon</strong> <strong>Counting</strong>; Detector Control Module DCC100 Manual; TCSPC<br />
Software is available and FREE; Manual: Multi - SPC 32 bit Dynamic Link Library<br />
SPC-300, SPC-330 TCSPC; SPC-400, SPC-430 TCSPC; SPC-500, SPC-530 TCSPC; MSA-100 1ns multiscaler; MSA-300 5ns<br />
multisclaer; PMS-400 and PMM-328 Gated photon counters / multiscalers; Picosecond Diode Lasers<br />
Start of measurement<br />
Start of sequence<br />
Preamplifiers with detector<br />
overload protection, Routers<br />
for APDs<br />
Measurement examples<br />
<strong>Time</strong> Harp 100<br />
Picosecond Diode Lasers<br />
03/21/2003 Q:\Product Literature\Becker Hickl\Comparison SPC- & <strong>Time</strong>Harp.doc