TCSPC for FLIM and FRET in - Boston Electronics Corporation
TCSPC for FLIM and FRET in - Boston Electronics Corporation
TCSPC for FLIM and FRET in - Boston Electronics Corporation

Create successful ePaper yourself
Turn your PDF publications into a flip-book with our unique Google optimized e-Paper software.
<strong>Boston</strong> <strong>Electronics</strong> <strong>Corporation</strong>91 Boylston Street, Brookl<strong>in</strong>e MA 02445 USA(800)347-5445 or (617)566-3821 fax (617)731-0935www.boselec.com microscopy@boselec.com<strong>TCSPC</strong> <strong>for</strong> <strong>FLIM</strong><strong>and</strong> <strong>FRET</strong> <strong>in</strong>MicroscopyThe Becker & HicklS C-series Module FamilyPC BasedSystemsi n t e l l i g e n tmeasurement<strong>and</strong>control systemsBecker & Hickl GmbHNahmitzer Damm 3012277 Berl<strong>in</strong>, GermanyTel. +49 30 787 56 32Fax. +49 30 787 57 34www.becker-hickl.de<strong>in</strong>fo@becker-hickl.de
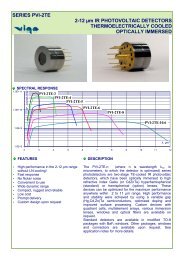
<strong>FLIM</strong> Upgrade Kits <strong>for</strong> Confocal MicroscopesFluorescence lifetime imag<strong>in</strong>g with ps resolutionExcitation by picosecond diode laserConfocal detectionSimultaneous detection <strong>in</strong> several wavelength <strong>in</strong>tervalsMulti-dimensional <strong>TCSPC</strong> techniqueExcellent time-resolution <strong>and</strong> sensitivityZoom <strong>and</strong> image rotation functions of microscope applicableWorks at any scan rateSeparation of fluorophores by lifetimeAutofluorescence<strong>FRET</strong> experimentsImag<strong>in</strong>g of pH, ion concentrations, or oxygen concentrationThe systems are based on a picosecond diodelaser of 405 nm or 473 nm wavelength withhigh-efficiency s<strong>in</strong>gle-mode fibre coupl<strong>in</strong>g, as<strong>in</strong>gle-, dual-, or multi-wavelength detectormodule, <strong>and</strong> BH’s proprietary multi-dimensional<strong>TCSPC</strong> technique. The pulsed laser light is fed<strong>in</strong>to the microscope via a st<strong>and</strong>ard s<strong>in</strong>gle-modeoptical fibre. A high speed detector assembly isattached to a suitable optical output of the scanhead. Both directly coupled <strong>and</strong> fibre-coupledversions are available. A large variety of detectormodules is available <strong>for</strong> s<strong>in</strong>gle-wavelength, dualwavelength,or multispectral detection <strong>in</strong> 16wavelength channels. The signals of all detectorchannels are recorded simultaneously by multidimensional<strong>TCSPC</strong>, result<strong>in</strong>g <strong>in</strong> excellent efficiency<strong>and</strong> time resolution. Typical applicationsare multi-spectral autofluorescence imag<strong>in</strong>g oftissue, pH imag<strong>in</strong>g <strong>in</strong> tissue, comb<strong>in</strong>ed <strong>FLIM</strong><strong>and</strong> SHG imag<strong>in</strong>g, <strong>and</strong> <strong>in</strong>vestigation of prote<strong>in</strong><strong>in</strong>teraction by <strong>FRET</strong>.The laser is a jo<strong>in</strong>t product of BH <strong>and</strong> LASOS<strong>TCSPC</strong> technique covered by patents DE 43 39 784 <strong>and</strong> DE 43 39 787Becker & Hickl GmbHNahmitzer Damm 3012277 Berl<strong>in</strong>, GermanyTel. +49 30 787 56 32Fax +49 30 787 57 34<strong>in</strong>fo@becker-hickl.comwww.becker-hickl.comLASOS Lasertechnik GmbHCarl-Zeiss-Promenade 1007745 Jena, GermanyTel. +49 3641-2944-54Fax +49 3641 2944-17lasos<strong>in</strong>fo@lasos.comwww.lasos.comUK Representative:Photonic SolutionsPLCTel. +44 1316648122sales@psplc.comwww.psplc.comUS Representative:<strong>Boston</strong> <strong>Electronics</strong> Corp91 Boylston Street, Brookl<strong>in</strong>e.Massachusetts 02445 USATel: (800) 347 5445 or (617) 566 3821Fax: (617) 731 0935tcspc@boselec com, www.boselec.com
<strong>FLIM</strong> Upgrade Kits <strong>for</strong> Confocal MicroscopesComputer Options<strong>TCSPC</strong> cards, to be placed <strong>in</strong> any Pentium computerLaptop-based systems, fully <strong>in</strong>stalledSPC-830 <strong>TCSPC</strong> moduleDCC-100 detector controllerDetector OptionsPMC-100 / M-SHUT H7422-40 / M-SHUT R3809U / M-SHUT R3809U / M-SHUT-DUAL PML-16 / MW-<strong>FLIM</strong>Cooled PMT Cooled GaAsP PMT Multichannel plate PMT Two multichannel plate PMTs Spectrograph <strong>and</strong> 16 channel multi-anode PMTIRF width 150 to 180 ps IRF width 300 to 350 ps IRF width < 30 ps Simultaneous detection Simultaneous detection <strong>in</strong> 16 wavelength channelsFor lifetimes down to 100 ps For lifetimes down to 200 ps For lifetimes down to 50 ps <strong>in</strong> two wavelength <strong>in</strong>tervals For lifetimes down to 100 psPMC-0: 340 to 650 nm 340 to 690 nm, ultra-high sensitivity R3809U-52: 340 to 650 nm R3809U-52: 340 to 650 nm PML-16-0: 340 to 650 nmPMC-1: 340 to 820 nm R3809U-50: 340 to 820 nm R3809U-50: 340 to 820 nm PML-16-1: 340 to 820 nmOther comb<strong>in</strong>ations: Please call bhDirectly Supported Microscopes<strong>FLIM</strong> Data AnalysisManufacturer / TypeZeiss LSM 510Zeiss LSM 510 METALeica SP2Olympus FV1000Biorad RadianceJenlab Tau-MapOther MicroscopesRemarksFibre out requiredFibre out requiredComplete <strong>FLIM</strong> systemsavailable from LeicaFibre out or directlycoupled detectorsFibre out requiredAvailable from Jenlabplease call bhSPCImage Data AnalysisS<strong>in</strong>gle <strong>and</strong> multi exponentialdecay analysisLifetime <strong>in</strong> pixels displayedas colourLifetime distribution<strong>FRET</strong> <strong>in</strong>tensity by doubleexponentialanalysis of donordecay functionFor more <strong>in</strong><strong>for</strong>mation please download or call <strong>for</strong>SPC-134 through SPC-830 <strong>TCSPC</strong> modules, Manual <strong>and</strong> <strong>TCSPC</strong> compendiumUpgrad<strong>in</strong>g <strong>TCSPC</strong> laser scann<strong>in</strong>g microscopes with the SPC-730 <strong>and</strong> SPC-830 <strong>TCSPC</strong> imag<strong>in</strong>g modulesW. Becker, A. Bergmann, Lifetime imag<strong>in</strong>g techniques <strong>for</strong> optical microscopyW. Becker, A. Bergmann, Detector assemblies <strong>for</strong> picosecond microscopyDCC-100 manualSPCImage manualSPC-830, DCC-100, PMC-100, MW-<strong>FLIM</strong>, Simple-Tau data sheetsBecker & Hickl GmbHNahmitzer Damm 3012277 Berl<strong>in</strong>, GermanyTel. +49 30 787 56 32Fax +49 30 787 57 34<strong>in</strong>fo@becker-hickl.comwww.becker-hickl.comLASOS Lasertechnik GmbHCarl-Zeiss-Promenade 1007745 Jena, GermanyTel. +49 3641-2944-54Fax +49 3641 2944-17lasos<strong>in</strong>fo@lasos.comwww.lasos.comUK Representative:Photonic SolutionsPLCTel. +44 1316648122sales@psplc.comwww.psplc.comUS Representative:<strong>Boston</strong> <strong>Electronics</strong> Corp91 Boylston Street, Brookl<strong>in</strong>e.Massachusetts 02445 USATel: (800) 347 5445 or (617) 566 3821Fax: (617) 731 0935tcspc@boselec com, www.boselec.com
Febr 2003 Pr<strong>in</strong>ter HP4500PS TCVGBH1.DOCLifetime Imag<strong>in</strong>g Techniques <strong>for</strong> Optical MicroscopyWolfgang Becker, Axel BergmannBecker & Hickl GmbH, Berl<strong>in</strong>, becker@becker-hickl.com, bergmann@becker-hickl.com1
ContentsIntroduction.........................................................................................................................................................................3Biological Applications of Lifetime Techniques ...............................................................................................................3Fluorescence Quench<strong>in</strong>g ................................................................................................................................................3Resonance Energy Transfer............................................................................................................................................4Separation of Different Chromophores ..........................................................................................................................5Diffusion <strong>in</strong> Cells ...........................................................................................................................................................5Microscopy Techniques......................................................................................................................................................6Wide-Field Fluorescence Microscopy............................................................................................................................6Laser Scann<strong>in</strong>g Microscopy ...........................................................................................................................................6Optical Near-Field Microscopy......................................................................................................................................7Light Sources ......................................................................................................................................................................8Titanium-Sapphire Lasers ..............................................................................................................................................8Frequency Doubled Titanium-Sapphire Lasers ..............................................................................................................8Fibre Lasers....................................................................................................................................................................8Pulsed Diode Lasers.......................................................................................................................................................8Modulated CW Lasers....................................................................................................................................................9Mode-locked CW Lasers................................................................................................................................................9Pulse Pickers <strong>and</strong> Cavity Dumpers.................................................................................................................................9Detectors.............................................................................................................................................................................9Photomultiplier Tubes (PMTs) ......................................................................................................................................9Image <strong>in</strong>tensifiers .........................................................................................................................................................11Avalanche photodiodes ................................................................................................................................................12Cornerstones of Fluorescence Lifetime Imag<strong>in</strong>g...............................................................................................................13Time Resolution...........................................................................................................................................................13Signal-to-Noise Ratio...................................................................................................................................................13Detection efficiency .....................................................................................................................................................13Record<strong>in</strong>g efficiency ....................................................................................................................................................14Sample Saturation ........................................................................................................................................................14Photobleach<strong>in</strong>g.............................................................................................................................................................14Signal Process<strong>in</strong>g Techniques...........................................................................................................................................15Gated Image Intensifiers ..............................................................................................................................................15Modulation Techniques................................................................................................................................................17S<strong>in</strong>gle Channel Modulation Techniques..................................................................................................................18Modulated Image Intensifiers..................................................................................................................................20Gated Photon Counters ................................................................................................................................................23Time-Correlated S<strong>in</strong>gle Photon Count<strong>in</strong>g (<strong>TCSPC</strong>) ....................................................................................................26<strong>TCSPC</strong> Imag<strong>in</strong>g ......................................................................................................................................................27Multi Wavelength <strong>TCSPC</strong> Imag<strong>in</strong>g.........................................................................................................................29Features of the <strong>TCSPC</strong> imag<strong>in</strong>g techniques ............................................................................................................32Other <strong>TCSPC</strong> Techniques ............................................................................................................................................35Application of <strong>TCSPC</strong> to diffusion <strong>in</strong> cells.............................................................................................................35<strong>TCSPC</strong> Wide Field Imag<strong>in</strong>g....................................................................................................................................35Comparison of Signal Process<strong>in</strong>g Techniques ..................................................................................................................36Summary...........................................................................................................................................................................37References.........................................................................................................................................................................382
IntroductionS<strong>in</strong>ce their broad <strong>in</strong>troduction <strong>in</strong> the early 90s confocal <strong>and</strong> two-photon laser scann<strong>in</strong>g microscopeshave <strong>in</strong>itiated a breakthrough <strong>in</strong> biomedical imag<strong>in</strong>g [1-5]. The applicability of multi-photonexcitation, the optical section<strong>in</strong>g capability <strong>and</strong> the superior contrast of these <strong>in</strong>struments makethem an ideal choice <strong>for</strong> fluorescence imag<strong>in</strong>g of biological samples.However, the fluorescence of organic molecules is not only characterised by the emission spectrum,it has also a characteristic lifetime. Any energy transfer between an excited molecule <strong>and</strong> itsenvironment <strong>in</strong> a predictable way changes the fluorescence lifetime. S<strong>in</strong>ce the lifetime does notdepend on the concentration of the chromophore fluorescence lifetime imag<strong>in</strong>g is a direct approachto all effects that <strong>in</strong>volve energy transfer [6-10]. Typical examples are the mapp<strong>in</strong>g of cellparameters such as pH, ion concentrations or oxygen saturation by fluorescence quench<strong>in</strong>g, orfluorescence resonance energy transfer (<strong>FRET</strong>) [6,7,8] between different chromophores <strong>in</strong> the cell.Furthermore, comb<strong>in</strong>ed <strong>in</strong>tensity / lifetime imag<strong>in</strong>g is a powerful tool to dist<strong>in</strong>guish betweendifferent fluorescence markers <strong>in</strong> multi-sta<strong>in</strong>ed samples <strong>and</strong> between different natural fluorophoresof the cells themselves. These components often have ill-def<strong>in</strong>ed fluorescence spectra but are clearlydist<strong>in</strong>guished by their fluorescence lifetime [70].Fluorescence lifetime measurements require a pulsed or modulated excitation source, a sufficientlyfast detector <strong>and</strong> a suitable record<strong>in</strong>g electronics. This article gives an overview about applicabletime-resolved signal record<strong>in</strong>g techniques <strong>and</strong> their benefits <strong>and</strong> drawbacks.Biological Applications of Lifetime TechniquesWhen a dye molecule absorbs a photon it goes <strong>in</strong>to anexcited state from which it can return by the emissionof a fluorescence photon, by convert<strong>in</strong>g the absorbedenergy <strong>in</strong>ternally, or by transferr<strong>in</strong>g the energy to theenvironment (fig. 1) [6,9,10]. The probability that oneof these effects occurs is <strong>in</strong>dependent of the time afterthe excitation. If a large number of similar moleculeswith similar local environment is excited by a shortlaser pulse the fluorescence decay function is there<strong>for</strong>es<strong>in</strong>gle exponential. As long as no energy is transferredto the environment the lifetime is the ‘naturalfluorescence lifetime’, τ 0 which is a constant <strong>for</strong> a given molecule <strong>and</strong> refraction <strong>in</strong>dex of thesolvent. The fluorescence decay times of the fluorophores commonly used <strong>in</strong> microscopy are of theorder of a few ns.Fluorescence Quench<strong>in</strong>gIf energy is transferred to the environment the actualfluorescence lifetime, τ, is less than the natural lifetime,τ 0 . For almost all dyes the energy transfer rate dependsmore or less on the concentration of ions, on the oxygenconcentration, on the pH value or on the b<strong>in</strong>d<strong>in</strong>g toprote<strong>in</strong>s <strong>in</strong> a cell [6,9,10]. There<strong>for</strong>e, specifically designeddyes can be used to probe the concentration of biologicalrelevant ions such as Na + , Mg ++ , or Ca ++ , the oxygenconcentration or the pH value <strong>in</strong>side a cell. There is adirect relation between the lifetime <strong>and</strong> the quencherExcited StatePopulationLasere -t/Emission +Internal Conversione -t/ 0Energytransferred to EnvironmentTimeFig. 1: Return of molecules from the excited stateIntensityLasere -t/-t/ e 0unquenched lifetimequench<strong>in</strong>gFig. 2: Fluorescence quench<strong>in</strong>gTime3
concentration, fig. 2.Fluorescence markers used to reveal particular prote<strong>in</strong> structures <strong>in</strong> cells often b<strong>in</strong>d to a variety ofslightly different targets. Although this often does not cause significant changes <strong>in</strong> their spectralbehaviour the lifetime can be clearly different due to different quench<strong>in</strong>g efficiency. There<strong>for</strong>e thelifetime of markers can be used as an additional probe technique <strong>in</strong> cells [11, 12]. A wide variety ofchromophores <strong>in</strong>clud<strong>in</strong>g CFP, GFP <strong>and</strong> YFP clearly show variations <strong>in</strong> their fluorescence lifetimes.Although most of these effects are not <strong>in</strong>vestigated <strong>in</strong> detail yet there is probably a large potential<strong>for</strong> ‘<strong>in</strong>telligent’ markers based on lifetime changes.Fluorescence can be almost entirely quenched <strong>in</strong> aggregates of fluorophore molecules. Lifetimes asshort as 20 ps have been found. The fast relaxation is often considered unfavourable <strong>for</strong>photodynamic therapy applications. However, if the aggregates monomerise <strong>in</strong>side a tumor cell theeffect can be of particular <strong>in</strong>terest [52].Resonance Energy TransferA particularly efficient energy transfer process is fluorescence resonance energy transfer, or <strong>FRET</strong>.<strong>FRET</strong> occurs if two different dyes are present with the emission b<strong>and</strong> of one dye overlapp<strong>in</strong>g theabsorption b<strong>and</strong> of the other [6,7,8]. In this case the energy from the first dye, the donor, goesimmediately <strong>in</strong>to the second one, the acceptor. This results <strong>in</strong> an extremely efficient quench<strong>in</strong>g ofthe donor fluorescence <strong>and</strong>, consequently, decrease of the donor lifetime, see fig. 3.IntensityIntensityLaserDonor Donor Acceptor AcceptorAbsorption Emission Absorption EmissionLaserD D A AWavelengthEmission-t/ equencheddonor-t/ e 0<strong>FRET</strong>unquenched donorTime4Fig. 3: Fluorescence Resonance Energy Transfer (<strong>FRET</strong>)<strong>FRET</strong> works only over a distance shorter than a few nm. There<strong>for</strong>e, it can be used to probe thedistance between different subunits <strong>in</strong> the cell.It is difficult to obta<strong>in</strong> quantitative <strong>FRET</strong> results from steady-state images. The fluorescence<strong>in</strong>tensity does not only depend on the <strong>FRET</strong> efficiency but also on the unknown concentration of thedyes. Moreover, some of the acceptor molecules are excited directly, <strong>and</strong> the donor emission b<strong>and</strong>extends <strong>in</strong>to the acceptor emission. Up to eight measurements at different excitation wavelength<strong>and</strong> <strong>in</strong> different emission wavelength b<strong>and</strong>s are required to obta<strong>in</strong> calibrated <strong>FRET</strong> results fromsteady state data [4,5,7]. <strong>FRET</strong> results can also be obta<strong>in</strong>ed by measur<strong>in</strong>g the donor fluorescence,then photobleach<strong>in</strong>g the acceptor, <strong>and</strong> measur<strong>in</strong>g thedonor once more. The <strong>FRET</strong> efficiency is given by theratio of the two donor images. Although this procedurelooks reliable at first glance photobleach<strong>in</strong>g productsmay <strong>in</strong>duce damage <strong>in</strong> the cell, <strong>and</strong> <strong>in</strong> a liv<strong>in</strong>g celldiffusion may replace a part of the photobleachedacceptor molecules.In lifetime data, however, <strong>FRET</strong> shows up as adramatical decrease of the donor lifetime [6,8,68,72].The fluorescence decay functions conta<strong>in</strong> thefluorescence of quenched <strong>and</strong> of unquenched donorIntensitybaquenchedb e-t /<strong>FRET</strong>unquenched-t / 0a etimeFig. 4: Fluorescence decay components <strong>in</strong><strong>FRET</strong> systems
molecules <strong>and</strong> are there<strong>for</strong>e double-exponential, fig. 4. Qualitative <strong>FRET</strong> results can be obta<strong>in</strong>edfrom the lifetime of a s<strong>in</strong>gle exponential approximation of the decay curve. Quantitativemeasurements require double exponential decay analysis that delivers the lifetimes, τ 0 <strong>and</strong> τ <strong>FRET</strong>,<strong>and</strong> the <strong>in</strong>tensity factors, a <strong>and</strong> b, of the two decay components [68,72]. The relative numbers ofquenched <strong>and</strong> unquenched molecules is given by the ratio of the two <strong>in</strong>tensity components, b/a,while the average coupl<strong>in</strong>g efficiency of the <strong>FRET</strong> pairs is given by τ 0 / τ <strong>FRET</strong> . In pr<strong>in</strong>ciple, both theratio of quenched <strong>and</strong> unquenched molecules <strong>and</strong> the coupl<strong>in</strong>g efficiency can be derived from as<strong>in</strong>gle donor lifetime measurement.Separation of Different ChromophoresSteady-state multi-wavelength techniques have been developed that efficiently separate differentfluorescence markers by unmix<strong>in</strong>g their fluorescence spectra [13]. However, not all markercomb<strong>in</strong>ations can efficiently be resolved. Even the well known GFP <strong>and</strong> YFP are difficult to unmix.Autofluorescence images of cells <strong>and</strong> tissue show a wide variety of fluorescence components withill-def<strong>in</strong>ed, variable, <strong>and</strong> often unknown spectra. When spectral unmix<strong>in</strong>g fails the components canusually be dist<strong>in</strong>guished by their different lifetimes [70,75]. The relative concentration of twocomponents can be determ<strong>in</strong>ed by double-exponential decay analysis. Even if only a s<strong>in</strong>gleexponential approximation, i.e. an average lifetime is measured, the contrast <strong>in</strong> the fluorescenceimages can be considerably improved. [70,75]. Moreover, changes <strong>in</strong> the relative concentration <strong>and</strong>the lifetime of autofluorescence components can possibly be used as diagnostic tools.Significant progress can be expected from comb<strong>in</strong><strong>in</strong>g spectral unmix<strong>in</strong>g <strong>and</strong> lifetime analysis.Record<strong>in</strong>g of time- <strong>and</strong> wavelength resolved data is technically possible by <strong>TCSPC</strong> techniques (see‘Multi Wavelength <strong>TCSPC</strong> Imag<strong>in</strong>g’). Comb<strong>in</strong><strong>in</strong>g the two methods requires to develop suitabledata analysis software.Diffusion <strong>in</strong> CellsDiffusion time constants <strong>in</strong> cells are usually <strong>in</strong> the ms range <strong>and</strong> below. They are usually determ<strong>in</strong>edby fluorescence correlation (FCS) techniques [14,15,16]. The problem is that the correlationtechnique is a s<strong>in</strong>gle po<strong>in</strong>t measurement. Moreover, the measurement is usually not done <strong>in</strong> thesame setup as the cell imag<strong>in</strong>g. This makes it difficult to identify the measured spot <strong>in</strong> a particularcell with sufficient accuracy. Basically the photon count<strong>in</strong>g techniques used <strong>for</strong> lifetimemeasurement are able to run a comb<strong>in</strong>ed FCS <strong>and</strong> lifetime measurement at a s<strong>in</strong>gle, well def<strong>in</strong>edpo<strong>in</strong>t of the sample. This could not only help to solve the position<strong>in</strong>g problem but also to identifys<strong>in</strong>gle marker molecules [17] <strong>and</strong> to reveal con<strong>for</strong>mational changes of the diffus<strong>in</strong>g marker/prote<strong>in</strong>clusters [18]. Although appropriate photon counters are available [63] no comb<strong>in</strong>ed <strong>FLIM</strong> / FCSsetup has become known yet.5
Microscopy TechniquesWide-Field Fluorescence MicroscopyAs <strong>in</strong> any traditional microscope, the sample is uni<strong>for</strong>mlyillum<strong>in</strong>ated by the excitation light. The image is detected by aCCD camera (fig. 5). To obta<strong>in</strong> time resolution <strong>in</strong> a wide-fieldsetup the excitation light is pulsed or modulated <strong>and</strong> a ga<strong>in</strong>modulated or gated <strong>in</strong>tensified CCD camera is used [19,20,21,23].The restriction to a special detection technique with sub-optimalefficiency is a drawback of wide-field imag<strong>in</strong>g. Furthermore,wide-field imag<strong>in</strong>g does not have the <strong>in</strong>herent depth resolution ofthe scann<strong>in</strong>g techniques (see section below). However, there is aremarkable technique to obta<strong>in</strong> 3D images <strong>in</strong> whole-fieldmicroscopes [22], <strong>and</strong> a time-resolved solution with a gated CCDcamera is described <strong>in</strong> [23]. The most severe drawback of thewide-field technique is that it cannot be used <strong>for</strong> two-photonexcitation - a technique that allows deep tissue imag<strong>in</strong>g <strong>in</strong>scann<strong>in</strong>g microscopes.Gated ormodulated<strong>in</strong>tensifiedCCD CameraDichroicMirrorExcitedObjectiveLensSamplePulsed ormodulatedLight SourceFig. 5: Whole-field fluorescencelifetime imag<strong>in</strong>gA benefit of wide-field imag<strong>in</strong>g is that it probably causes less photobleach<strong>in</strong>g than the scann<strong>in</strong>gtechniques. Provided the same number of detected photons <strong>and</strong> the same detection efficiency, theoverall excitation dose <strong>for</strong> wide-field imag<strong>in</strong>g is the same as <strong>for</strong> the scann<strong>in</strong>g techniques describedbelow. However, the excitation density is much smaller because the light is not focused. S<strong>in</strong>ce the<strong>in</strong>crease of photobleach<strong>in</strong>g with the power is nonl<strong>in</strong>ear it should be expected that wide fieldimag<strong>in</strong>g is less affected by photobleach<strong>in</strong>g than scann<strong>in</strong>g techniques. Wide field techniques arethere<strong>for</strong>e superior <strong>for</strong> time-lapse imag<strong>in</strong>g, i.e. <strong>for</strong> record<strong>in</strong>g sequences of images <strong>in</strong> millisecond<strong>in</strong>tervals. For fluorescence lifetime imag<strong>in</strong>g the situation may be less favourable because thedetection techniques applicable <strong>for</strong> wide-field imag<strong>in</strong>g are not the most efficient ones [39].Laser Scann<strong>in</strong>g MicroscopyThe general optical pr<strong>in</strong>ciple of a laser scann<strong>in</strong>gmicroscope [1,2] is shown <strong>in</strong> fig. 6.P<strong>in</strong>holeThe laser is fed <strong>in</strong>to the optical path via adichroic mirror <strong>and</strong> focused <strong>in</strong>to the sample bythe microscope objective lens. In the traditionalDetectorconfocal setup used <strong>for</strong> one-photon excitation(fig. 6, left) the light from the sample goes backthrough the objective lens, through the scanner,is diverted by a dichroic mirror <strong>and</strong> goesthrough a p<strong>in</strong>hole <strong>in</strong> the upper image plane ofExcitedthe objective lens. Light from outside the focalplane is not focused <strong>in</strong>to the p<strong>in</strong>hole <strong>and</strong>there<strong>for</strong>e substantially suppressed. X-Y imag<strong>in</strong>gis achieved by optically scann<strong>in</strong>g the laser spotover the sample, Z imag<strong>in</strong>g (optical section<strong>in</strong>g)is possible by mov<strong>in</strong>g the sample or the microscope up <strong>and</strong> down.With a fs Ti:Sa laser the sample can be excited by two-photon absorption [3,54,78]. Excitationoccurs only <strong>in</strong> the focus, so that no p<strong>in</strong>hole is required to reject light from outside the focal plane.6LaserDichroicMirrorScannerObjectiveLensSampleOne-Photon ExcitationDetectorP<strong>in</strong>holeDetectorExcitedLaserfs PulsesDichroicMirrorScannerDichroicMirrorObjectiveLensSampleTwo-Photon ExcitationFig. 6: General setup of a laser scann<strong>in</strong>g microscope
There<strong>for</strong>e, the fluorescence light need not be fed back through the scanner <strong>and</strong> through the p<strong>in</strong>hole.It can be diverted by a dichroic mirror directly beh<strong>in</strong>d the microscope objective. This setup is called‘non-descanned detection’ <strong>in</strong> contrast to the ‘descanned detection’ shown above.Two-photon excitation <strong>in</strong> conjunction with non-descanned detection can be used to image tissuelayers as deep as 500 µm. S<strong>in</strong>ce the scatter<strong>in</strong>g <strong>and</strong> the absorption at the wavelength of the twophotonexcitation are small the laser beam penetrates through relatively thick tissue. Even if there issome loss on the way through the tissue it can easily compensated by <strong>in</strong>creas<strong>in</strong>g the laser power.The <strong>in</strong>creased power does not cause much photodamage because the power density outside thefocus is small. However, as long as there are enough ballistic (non-scattered) excitation photons <strong>in</strong>the focus the fluorescence is excited. Of course, the fluorescence photons are heavily scattered ontheir way out of the tissue <strong>and</strong> there<strong>for</strong>e emerge from a relatively large area of the sample surfacewhich is out of the focus of the objective. However, <strong>for</strong> non-descanned detection there is no need tofocus the fluorescence light anywhere. There<strong>for</strong>e the fluorescence photons can be efficientlytransferred to the detector.It is sometimes believed that lifetime imag<strong>in</strong>g is somehow connected to two-photon excitation. Thisis, of course, not correct. Depend<strong>in</strong>g on the signal process<strong>in</strong>g technique used, lifetime imag<strong>in</strong>grequires a pulsed or modulated laser. Although a Ti:Sa laser is the ideal source lifetime imag<strong>in</strong>g ispossible with the frequency doubled Ti:Sa laser, with pulsed diode lasers, or with modulated CWlasers.Optical Near-Field MicroscopyThe optical near-field microscope (SNOM or NSOM) comb<strong>in</strong>es the pr<strong>in</strong>ciples of the atomic <strong>for</strong>cemicroscope <strong>and</strong> the laser scann<strong>in</strong>g microscope [24-28]. A sharp tip is scanned over the sample <strong>and</strong>kept <strong>in</strong> a distance comparable to the diameter of a s<strong>in</strong>gle molecule. The tip can be the end of atapered fibre through which the laser is fed to the sample (fig. 7, left). Or, the tip is illum<strong>in</strong>ated byfocus<strong>in</strong>g the laser through the microscope objective on it <strong>and</strong> the evanescent field at the tip is usedto probe the sample structure (fig. 7, right). In any case, the fluorescence photons are collectedthrough the microscope objective.leverFibreLaserleverscanSamplescanSampleDetectionMicroscopeObjectiveDetectionMicroscopeObjectiveLaserFig. 7: Optical near-field microscopeThe optical near-field microscope reaches a resolution of a few 10 nm, i.e. about 10 times less thanthe laser scann<strong>in</strong>g microscope. Imag<strong>in</strong>g cells with this technique is difficult <strong>and</strong> possibly restrictedto special cases [27,28]. The realm of the optical near-field microscope are certa<strong>in</strong>ly applicationswhere fluoresc<strong>in</strong>g molecules or nano-particles are fixed on a flat substrate.Generally, the SNOM pr<strong>in</strong>ciple can be comb<strong>in</strong>ed with flourescence lifetime imag<strong>in</strong>g <strong>in</strong> the sameway as the normal laser scann<strong>in</strong>g microscope. S<strong>in</strong>ce only a small number of photons can beobta<strong>in</strong>ed from the extremely small sample volume photon count<strong>in</strong>g techniquesare used to obta<strong>in</strong>lifetime <strong>in</strong><strong>for</strong>mation [78]. The problem to be expected is that the proximity of the tip changes the7
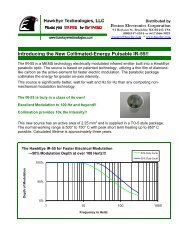
fluorescence lifetime of the sample. Whether this effect makes lifetime imag<strong>in</strong>g <strong>in</strong> a SNOM uselessor whether it can be exploited <strong>for</strong> completely new techniques is hard to say.Light SourcesDepend<strong>in</strong>g on the signal process<strong>in</strong>g technique used, fluorescence lifetime imag<strong>in</strong>g requires either apulsed excitation source with a repetition rate <strong>in</strong> the MHz range or a modulated light source with apossible variable modulation frequency of 50 MHz to 1 GHz <strong>and</strong> a near perfect modulation depth.Titanium-Sapphire LasersThe ultimate solution is the femtosecond Ti:Sa laser. These lasers deliver pulses with 70 to 80 MHzrepetition rate, 80 to 200 fs pulse width <strong>and</strong> up to several Watts average power. The wavelength is<strong>in</strong> the NIR from 780 nm to 950 nm. To excite the sample which usually absorbs below 500 nm,simultaneous two photon excitation is used. Due to the short pulse width <strong>and</strong> the high energydensity <strong>in</strong> the focus of the microscope the two-photon process works very efficiently. There<strong>for</strong>e thetraditional frequency doubl<strong>in</strong>g of the Ti:Sa radiation is not often used <strong>for</strong> laser scann<strong>in</strong>gmicroscopes.Frequency Doubled Titanium-Sapphire LasersFrequency doubled titanium-sapphire lasers can be used to excite the sample via the traditional onephotonabsorption. Frequency doubl<strong>in</strong>g is achieved by a nonl<strong>in</strong>ear crystal. The output power is <strong>in</strong>the mW range. Less than 50µW are required to excite a typical sample so that the available power isby far sufficient. Whether one-photon or two-photon excitation gives less photobleach<strong>in</strong>g is stillunder discussion. In a some cases considerably higher count rates <strong>and</strong> less photodamage <strong>for</strong> onephotonexcitation were reported [72].Fibre LasersAnother useful excitation source are fibre lasers. Fibre lasers are available <strong>for</strong> a wavelength of780 nm <strong>and</strong> deliver pulses as short as 100 to 180 fs [29]. The average power is 10 to 20 mW. This isless than <strong>for</strong> the Ti:Sa laser but still sufficient <strong>for</strong> two-photon excitation. As a rule of thumb, themaximum useful power <strong>for</strong> biological samples <strong>and</strong> fs NIR excitation is 5 to 10 mW. A higher powerkills the cells or cooks the sample. The benefit of the fibre laser is the small size, the high reliability<strong>and</strong> a lower price compared to the Ti:Sa laser. The drawback of the fibre laser is that it is nottuneable.Pulsed Diode LasersA reasonable cost solution <strong>for</strong> one-photon excitation arepulsed diode lasers which are available <strong>for</strong> the NUV, blue,red, <strong>and</strong> near-<strong>in</strong>frared range [30-32]. These lasers deliverpulses with 40 to 400 ps duration <strong>and</strong> up to 80 MHzrepetition rate. The average power is up to a few mW.However, the pulse width <strong>in</strong>creases with the power. Forpulses shorter than 100 ps the average power is of the orderof a few 100 µW. Fig. 8 shows the typical pulse shape of a405 nm picosecond diode laser.Puls<strong>in</strong>g diodes with less than 100ps width requires specialdriv<strong>in</strong>g techniques that are not commonly available.However, pulses as narrow as 300 ps from red diodes caneasily be obta<strong>in</strong>ed by connect<strong>in</strong>g a commercially availablepulse generator to a bare laser diode.8Fig. 8: Pulse shape of a blue diode laser. BDL-405, recorded with R3809U MCP <strong>and</strong> SPC-830<strong>TCSPC</strong> module. FWHM is 80 ps.
It has been shown that diode lasers can be used <strong>for</strong> time-resolved microscopy with good results [33,33a]. Un<strong>for</strong>tunately the beam quality of diode lasers is not very good. There<strong>for</strong>e it can be difficult toobta<strong>in</strong> a diffraction-limited resolution. However, if only the central part of the beam is used, theresult can be quite acceptable. Discard<strong>in</strong>g a large fraction of the beam causes a considerable loss ofpower. This loss is, however, not substantial because 50 µW <strong>in</strong> the focal plane are sufficient toexcite the sample.Modulated CW LasersFor signal process<strong>in</strong>g techniques based on phase measurement of modulated signals CW Ar+ <strong>and</strong>HeNe lasers <strong>in</strong> conjunction with an acousto-optical modulator can be used. However, care must betaken to avoid any crosstalk of the modulation frequency <strong>in</strong>to the detection system. The smallestamount of crosstalk makes an accurate phase measurement impossible.Us<strong>in</strong>g modulated CW lasers <strong>in</strong> conjunction with photon count<strong>in</strong>g techniques is not recommended.These techniques require pulses rather than s<strong>in</strong>ewave signals. Acousto-optical modulators areresonance systems unable to deliver sufficiently short pulses with high on/off ratio.Mode-locked CW LasersAr+ lasers can be actively mode-locked. By <strong>in</strong>troduc<strong>in</strong>g a modulator <strong>in</strong>to the laser cavity pulses asshort as 100 ps with 80 to 120 MHz repetition rate are obta<strong>in</strong>ed. The pulses can be used directly orto pump a jet-stream dye laser that delivers ps pulses at a wavelength tuneable from 500 to 600 nm .Although the light from these lasers can be used <strong>for</strong> fluorescence excitation [65] the systems areoften unstable <strong>and</strong> require permanent ma<strong>in</strong>tenance, check<strong>in</strong>g <strong>and</strong> re-adjustment. We stronglydiscourage to use these lasers as excitation sources <strong>for</strong> time-resolved microscopy.Pulse Pickers <strong>and</strong> Cavity DumpersPulse pickers <strong>and</strong> cavity dumpers are used to obta<strong>in</strong> a lower repetition rate from lasers runn<strong>in</strong>g at ahigh, fixed repetition rate. For fluorescence measurements they are sometimes used to measurelifetimes longer than the orig<strong>in</strong>al period of the laser. The problem of the devices is the poor on-offratio <strong>and</strong> the electrical noise they often produce. It is by far better to take some <strong>in</strong>complete decay<strong>in</strong>to regard <strong>in</strong> the data analysis than to cope with electrical noise <strong>and</strong> satellite pulses. Furthermore, alow repetition rate reduces the useful count rate <strong>in</strong> photon count<strong>in</strong>g setups <strong>and</strong> possibly <strong>in</strong>creasesphotobleach<strong>in</strong>g. Don’t use pulse pickers if they are not absolutely necessary.DetectorsPhotomultiplier Tubes (PMTs)The most common detectors <strong>for</strong> low level detection of lightare photomultiplier tubes. A conventional photomultipliertube (PMT) is a vacuum device which conta<strong>in</strong>s aphotocathode, a number of dynodes (amplify<strong>in</strong>g stages) <strong>and</strong>Photoananode which delivers the output signal (fig. 9).CathodeD2D1D3D4D6D5D7D8 AnodeThe operat<strong>in</strong>g voltage builds up an electrical field thataccelerates the electrons from the photocathode to the firstFig. 9 Pr<strong>in</strong>ciple of a conventional PMTdynode D1, from D1 to D2, further to the next dynodes, <strong>and</strong>from D8 to the anode. When a photoelectron emitted from the photocathode hits D1 it releasesseveral secondary electrons. The same happens <strong>for</strong> the electrons emitted by D1 when they hit D2.The overall ga<strong>in</strong> reaches values of 10 6 to 10 8 . The secondary emission at the dynodes is very fast,there<strong>for</strong>e the secondary electrons result<strong>in</strong>g from one photoelectron arrive at the anode with<strong>in</strong> a few9
ns or less. Due to the high ga<strong>in</strong> <strong>and</strong> the short response a s<strong>in</strong>gle photoelectron yields a easilydetectable current pulse at the anode.A similar ga<strong>in</strong> effect is achieved <strong>in</strong> the channel plate of amicrochannel PMT, fig. 10. The channel plate consists ofmillions of narrow parallel channels. The channels have adiameter below 10 µm <strong>and</strong> are coated with a conductivematerial. When a high voltage is applied across the plate thewalls of the channels act as secondary emission targets. Withtwo plates <strong>in</strong> series, a ga<strong>in</strong> of the order of 10 6 is achieved.MCP PMTs deliver extremely fast pulses with low transittime jitter.CathodeChannelPlateAnodePhotoElectronChannel PlateElectrical FieldFig. 10 Multichannel PMTElectronstoAnodeThere are two parameters that characterise the time resolution of a photomultiplier - the ‘S<strong>in</strong>gleElectron Response’, SER, <strong>and</strong> the ‘Transit Time Spread’, TTS.The SER is the output pulse <strong>for</strong> the detection of a s<strong>in</strong>gle photon. The width of the SER limits theresolution of a PMT when it is used as a l<strong>in</strong>ear detector, i.e. a oscilloscope of fast digitizer. Sometypical SER shapes <strong>for</strong> PMTs are shown <strong>in</strong> fig. 11.Iout1ns/div1ns/div1ns/divSt<strong>and</strong>ard PMT (R928) Fast PMT (R5600, H5783) MCP-PMT (R3809U)Fig. 11: S<strong>in</strong>gle Electron Response (SER) <strong>for</strong> typical PMTsFor photon count<strong>in</strong>g applications the resolution is not limited by the width of the s<strong>in</strong>gle electronresponse. For these techniques only the Transit Time Spread (TTS), i.e. the uncerta<strong>in</strong>ty of the delaybetween the photon detection <strong>and</strong> the output pulse is important. The TTS can be 10 times smallerthan the width of the SER - a serious argument to use photon count<strong>in</strong>g techniques <strong>in</strong> conjunctionwith photomultipliers.Due to the r<strong>and</strong>om nature of the detector ga<strong>in</strong>, the pulse amplitude is notstable but varies from pulse to pulse. The pulse height distribution can bevery broad, up to 1:5 to 1:10. Fig. 12 (right) shows the SER pulses of anR5600 PMT. The pulse height jitter <strong>in</strong>troduces an additional noise factor<strong>in</strong>to all measurements that use the PMT as a l<strong>in</strong>ear detector. The signal-tonoiseratio of photon count<strong>in</strong>g measurements is not - or almost not -impaired by the pulse height jitter.If a PMT is operated near its full ga<strong>in</strong> the peak current of the SER pulses isof the order of a few mA. This is much more than the allowed cont<strong>in</strong>uousoutput current. Consequently, <strong>for</strong> high repetition rate signals or steady stateoperation the PMT delivers a tra<strong>in</strong> of r<strong>and</strong>om pulses rather than acont<strong>in</strong>uous signal. Because each pulse represents the detection of an<strong>in</strong>dividual photon the pulse density - not the pulse amplitude - is a measure<strong>for</strong> the light <strong>in</strong>tensity at the cathode of the PMT. Obviously, the pulseFig. 12: Amplitude jitter ofSER pulses (R5600)10
density is measured best by count<strong>in</strong>g the PMT pulses with<strong>in</strong> subsequent time <strong>in</strong>tervals. There<strong>for</strong>e,the application of photon count<strong>in</strong>g techniques is the logical consequence of the high ga<strong>in</strong> <strong>and</strong> thehigh speed of photomultipliers.The efficiency, i.e. the probability that a particular photon causes a pulse at the output of the PMT,depends on the efficiency of the photocathode. Un<strong>for</strong>tunately the sensitivity S of a photocathode isusually not given <strong>in</strong> units of quantum efficiency but <strong>in</strong> mA of photocurrent per Watt <strong>in</strong>cident power.The quantum efficiency QE ish c S W mQE = S ---- = ---- . 1.24 . 10 6 -----e λ λ AThe efficiency <strong>for</strong> the commonly usedphotocathodes is shown <strong>in</strong> fig. 13 (right). TheQE of the conventional bialkali <strong>and</strong>multialkali cathodes reaches 20 to 25 %between 400 <strong>and</strong> 500 nm. The recentlydeveloped GaAsP cathode reaches 45 %. TheGaAs cathode has an improved red sensitivity<strong>and</strong> is a good replacement <strong>for</strong> the multialkaliabove 600 nm.Sensitivity1000mA/WGenerally, there is no significant differencebetween the efficiency of similarphotocathodes <strong>in</strong> different PMTs <strong>and</strong> fromdifferent manufacturers. The differences are of 1300 400 500 600 700 800 900the same order as the variation betweenWavelengthnmdifferent tube of the same type. Reflectiontype cathodes are a bit more efficient than Fig. 13: Sensitivity of different photocathodes [34]transmission type photocathodes. However,reflection type photocathodes have non-uni<strong>for</strong>m photoelectron transit times to the dynode system<strong>and</strong> there<strong>for</strong>e cannot be used <strong>in</strong> ultra-fast PMTs. A good overview about the characteristics of PMTsis given <strong>in</strong> [34] <strong>and</strong> [79].10010GaAsPbia kaliGaAsmultialkaliQE=0.5QE=0.2QE=0.1Image <strong>in</strong>tensifiersImage <strong>in</strong>tensifiers are vacuum devices consist<strong>in</strong>g ofa photocathode, an acceleration <strong>and</strong>/ormultiplication system <strong>for</strong> the photoelectrons, <strong>and</strong> atwo-dimensional image detection system.First generation systems used a electron-opticalimag<strong>in</strong>g system that accelerates the photoelectronsto an energy of some keV <strong>and</strong> sends them to afluorescent screen. The image from the screen wasdetected by a traditional camera or later with aCCD camera. First generation devices had arelatively low ga<strong>in</strong> <strong>and</strong> strong image distortions.-HVPhotocathodeMultichannel PlateFluorescence ScreenCCD CameraFig. 14: Intensified CCD camera11
Second generation image <strong>in</strong>tensifiers use multichannel plates <strong>for</strong> electron multiplication (fig. 14).One plate gives a typical multiplication factor of 1000 so that a ga<strong>in</strong> of 10 6 can be achieved by twoplates <strong>in</strong> series.The CCD chip can be placed <strong>in</strong>side the tube to detect the electrons directly. These EBD CCDs(Electron Bombarded CCDs) give higher ga<strong>in</strong> than a CCD beh<strong>in</strong>d a fluorescent screen.Gat<strong>in</strong>g of an image <strong>in</strong>tensifier can be accomplished by a grid beh<strong>in</strong>d the photocathode. Ga<strong>in</strong>modulation can also be achieved by modulat<strong>in</strong>g the voltage between the cathode <strong>and</strong> the channelplate or the voltage across the multichannel plate.In general, image <strong>in</strong>tensifiers use the same photocathodes as photomultiplier tubes. There<strong>for</strong>e, thedetection efficiency is approximately the same. There can, however, be an appreciable loss ofphotons or signal-to-noise ratio due to gat<strong>in</strong>g or modulat<strong>in</strong>g.Avalanche photodiodesAvalanche photodiodes (APDs) use a multiplication effectdue to a strong electric field <strong>in</strong> a semiconductor structure(fig. 15). For use as a l<strong>in</strong>ear detector, a ga<strong>in</strong> factor of theorder of 100 can be achieved. However, cooled avalanchephotodiodes can be used to detect s<strong>in</strong>gle photons if they areoperated close to or slightly above the breakdown voltage.The generated electron-hole pairs <strong>in</strong>itiate an avalanchebreakdown <strong>in</strong> the diode. Active or passive quench<strong>in</strong>gcircuits must be used to restore normal operation after eachphoton [36]. There<strong>for</strong>e, a s<strong>in</strong>gle photon avalanchephotodiode (SPAPD) can only be used <strong>for</strong> photon count<strong>in</strong>g. The advantage of an APD is the highquantum efficiency that can reach 90% <strong>in</strong> the near <strong>in</strong>frared. S<strong>in</strong>gle photon avalanche photodiode(SPAPD) modules are available from Perk<strong>in</strong> Elmer [35]. Although a resolution as fast as 20 ps hasbeen reported <strong>for</strong> especially manufactured SPAPDs [36] the time resolution of these modules is <strong>in</strong>the order of 300 to 800 ps <strong>and</strong> depends on the count rate. This makes them less useful <strong>for</strong> lifetimemeasurements. SPAPDs are, however, excellently suited <strong>for</strong> fluorescence correlation measurementswhich do not require sub-ns resolution.200VPhotonQuench<strong>in</strong>g CircuitAvalancheOutputFig. 15: S<strong>in</strong>gle Photon Avalanche Photodiode(SPAPD)12
Cornerstones of Fluorescence Lifetime Imag<strong>in</strong>gTime ResolutionThe lifetimes of highly efficient fluorescence markers are typically <strong>in</strong> the region of a few ns.However, these dyes are selected <strong>for</strong> high quantum yield. Lifetimes of less efficient chromophorescan easily be below 100 ps. Quench<strong>in</strong>g effects can reduce the lifetime down to a few 10 ps, <strong>and</strong> thelifetime of the quenched donor fluorescence <strong>in</strong> <strong>FRET</strong> experiments is <strong>in</strong> the order of 100 to 300 ps.There<strong>for</strong>e, a good lifetime system should resolve fluorescence decay functions down to the order of10 ps.The fluorescence decay curves of <strong>in</strong> biological samples are often multi-exponential. There can beseveral chromophores <strong>in</strong> the same part of a cell, a s<strong>in</strong>gle chromophore can be quenched witch nonuni<strong>for</strong>mefficiency, or there can be quenched <strong>and</strong> unquenched molecules <strong>in</strong> the same part of the cell.There<strong>for</strong>e, the ability to resolve multi-exponential decay functions is an absolute requirement to getquantitative results. Resolv<strong>in</strong>g two or even more exponential terms <strong>in</strong> a decay function requires datawith an excellent signal-to-noise ratio.Signal-to-Noise RatioDue to the short lifetimes, the measurement of fluorescence decay functions requires a detectionb<strong>and</strong>width <strong>in</strong> the GHz range. The high b<strong>and</strong>width does not only dem<strong>and</strong> <strong>for</strong> very fast detectors <strong>and</strong>detection electronics, it poses also a noise problem. The noise <strong>in</strong> fast optical measurements is almostessentially shot noise, i.e. the fluctuation of the number of photons detected with<strong>in</strong> the resolv<strong>in</strong>gtime of the measurement system. The best signal-to-noise ratio, SNR, that can be achieved isSNR = n 1/2with n be<strong>in</strong>g the number of photons detected with<strong>in</strong> the resolved time <strong>in</strong>terval. Actually the SNRcan be even lower due to background signals orig<strong>in</strong>at<strong>in</strong>g <strong>in</strong> the detector or com<strong>in</strong>g from theenvironment, r<strong>and</strong>om ga<strong>in</strong> fluctuations <strong>in</strong> the detector, <strong>and</strong> <strong>in</strong>efficient acquisition of the detectedphotons <strong>in</strong> the subsequent signal process<strong>in</strong>g cha<strong>in</strong>.Acceptable steady state images can be obta<strong>in</strong>ed <strong>for</strong> less than 100 photons detected per pixel of theimage. However, lifetime measurements actually deliver a stack of images <strong>for</strong> - <strong>in</strong> case of timedoma<strong>in</strong>methods - different times after the excitation or - <strong>in</strong> case of frequency doma<strong>in</strong> methods - <strong>for</strong>different phases <strong>and</strong> modulation frequencies. There<strong>for</strong>e, the number of photons required to getlifetime <strong>in</strong><strong>for</strong>mation is much larger. Although rough lifetime <strong>in</strong><strong>for</strong>mation <strong>for</strong> s<strong>in</strong>gle exponential canbe obta<strong>in</strong>ed from only 100 detected photons high accuracy measurements <strong>for</strong> multi-exponentialdecay analysis can easily require 10.000 or 100.000 photons per pixel [80].Un<strong>for</strong>tunately the number of photons that can be emitted from the sample <strong>in</strong> a given time <strong>in</strong>terval islimited by the sample itself.Detection efficiencyThe detection efficiency <strong>for</strong> the photons emitted be the sample depends on the optical system <strong>and</strong> onthe detector. The efficiency of a microscope depends on the numerical aperture of the microscopeobjective, NA, <strong>and</strong> <strong>in</strong>creases with NA 2 . The effective NA can be doubled by us<strong>in</strong>g the 4Pi technique[37].It is often claimed that the efficiency <strong>for</strong> non-descanned detection is considerably higher than <strong>for</strong>descanned detection. This is certa<strong>in</strong>ly true <strong>for</strong> deep-tissue imag<strong>in</strong>g when the emission light isscattered <strong>in</strong> the sample <strong>and</strong> cannot be fed through a p<strong>in</strong>hole. However, state-of the art microscopeshave p<strong>in</strong>holes with adjustable diameter. For imag<strong>in</strong>g s<strong>in</strong>gle cells there is no noticeable differencebetween descanned <strong>and</strong> non-descanned detection.13
Appreciable loss of photons can occur <strong>in</strong> the filters used to select the desired emission wavelengthrange. Us<strong>in</strong>g the right filter <strong>for</strong> a particular chromophore can improve the efficiency considerably.Commonly used detectors <strong>for</strong> lifetime imag<strong>in</strong>g are described below. Although there is noappreciable difference between detectors of the same cathode type not all cathodes may be available<strong>for</strong> a particular detector. Techniques that are not restricted to a special detector, i.e. the photoncount<strong>in</strong>g techniques, can use high efficiency detectors, i.e. PMTs with GaAs cathodes or s<strong>in</strong>glephoton avalanche photodiodes.Record<strong>in</strong>g efficiencyDifferent signal process<strong>in</strong>g techniques differ considerably <strong>in</strong> terms of record<strong>in</strong>g efficiency, i.e. <strong>in</strong> theexploitation of the detected photons. Tak<strong>in</strong>g <strong>in</strong>to regard that the available number of photons islimited by photobleach<strong>in</strong>g <strong>in</strong> the sample, the record<strong>in</strong>g efficiency is the most important parameternext to the time resolution. The quality of a signal record<strong>in</strong>g technique can be described by a ‘figureof merit’ [38, 39], F , that describes the ratio of the signal-to-noise ratio SNR of an idealmeasurement to the signal-to-noise ration actually achieved, i.e.SNR idealF = -------------SNR actF values <strong>for</strong> different methods were determ<strong>in</strong>ed <strong>in</strong> [39]. S<strong>in</strong>ce the SNR is proportional to the squareroot of the number of detected photons, n, the efficiency of a technique <strong>in</strong> terms of photons requiredto obta<strong>in</strong> a given SNR isE = 1 / F 2The figure of merit <strong>and</strong> the efficiency will be used <strong>in</strong> the discussion of the commonly used lifetimetechniques.Sample SaturationThe sample volume from which the photons are detected <strong>in</strong> a laser scann<strong>in</strong>g microscope is of theorder of 1 fl. For a chromophore concentration of 10-6 mol/l this volume conta<strong>in</strong>s only 600molecules, <strong>and</strong> <strong>for</strong> 10-9 mol/l the number of molecules is of the order of 1. Lifetime measurementsrequire a pulsed or modulated light source. To avoid saturation effects <strong>for</strong> pulsed excitation only asmall fraction of the molecules can be excited by each pulse. There<strong>for</strong>e, lasers with repetition rates<strong>in</strong> the kHz range cannot reasonably be used <strong>in</strong> conjunction with scann<strong>in</strong>g. There is, however, nosaturation problem if lasers with a repetition rate above 50 MHz such as Ti:Sa lasers, YLF lasers orpulsed laser diodes are used.Photobleach<strong>in</strong>gThe most severe limit <strong>for</strong> the emission <strong>in</strong>tensity is set by photobleach<strong>in</strong>g <strong>in</strong> the sample. Thechromophores are not <strong>in</strong>f<strong>in</strong>itely stable but are destroyed after a large number of absorption <strong>and</strong>emission cycles. The reasons of photobleach<strong>in</strong>g are not clear <strong>in</strong> detail <strong>and</strong> are probably different <strong>for</strong>one-photon <strong>and</strong> two-photon excitation . Possible reasons are simultaneous multi-photon absorption,<strong>in</strong>tersystem cross<strong>in</strong>g, reactions from the triplet state <strong>and</strong> excited-state absorption [40-45].It is often claimed that photodamage <strong>and</strong> photobleach<strong>in</strong>g is smaller <strong>for</strong> two-photon excitation.Certa<strong>in</strong>ly, there is no absorption outside the focus <strong>and</strong> consequently above <strong>and</strong> below the focalplane. Moreover, a cell can withst<strong>and</strong> much more power <strong>in</strong> the NIR than <strong>in</strong> the NUV because thefraction of absorbed power is much smaller [46,47]. However, if the cell conta<strong>in</strong>s dyes with a strongabsorption around 400 nm <strong>and</strong> photobleach<strong>in</strong>g is compared <strong>for</strong> the same number of emitted14
fluorescence photons the situation is less clear. It has also been found that photobleach<strong>in</strong>g is morerapid <strong>for</strong> two-photon excitation [41,42].For two-photon excitation the dependence of the photobleach<strong>in</strong>g efficiency on the excitation poweris highly nonl<strong>in</strong>ear. For photobleach<strong>in</strong>g versus excitation power exponents of 2.5 [45] <strong>and</strong> from 3 to5 <strong>for</strong> have been found [43]. At the same time the emission followed the excitation <strong>in</strong>tensity by theexpected power of 2. That means photobleach<strong>in</strong>g <strong>in</strong>creases more than l<strong>in</strong>early with the emission<strong>in</strong>tensity. There<strong>for</strong>e two-photon excitation can easily cause 10 times faster photobleach<strong>in</strong>g than onephotonexcitation <strong>for</strong> the same emission <strong>in</strong>tensity [43].Although photobleach<strong>in</strong>g is the most crucial constra<strong>in</strong>t <strong>for</strong> scann<strong>in</strong>g microscopy the question aboutthe excitation method is still open. The consequence from the controversial situation is not to relyon two-photon excitation alone. For all lasers commonly used <strong>for</strong> two-photon excitation frequencydoubl<strong>in</strong>g is available <strong>and</strong> delivers sufficient power <strong>for</strong> one-photon excitation.Signal Process<strong>in</strong>g TechniquesGated Image IntensifiersGat<strong>in</strong>g an image <strong>in</strong>tensifier is achieved by plac<strong>in</strong>g agrid beh<strong>in</strong>d the photocathode. The pr<strong>in</strong>ciple issimilar as <strong>for</strong> the grid <strong>in</strong> a radio tube. As long as thegrid voltage is negative referred to thephotocathode the photoelectrons cannot pass thegrid. When a positive pulse is applied the electronspass through the meshes of the grid <strong>and</strong> areaccelerated towards the multichannel plate or <strong>in</strong>tothe acceleration system.Although gat<strong>in</strong>g of an image <strong>in</strong>tensifier looks straight<strong>for</strong>ward at fist glance it is anyth<strong>in</strong>g but simple,particularly if sub-ns resolution is to be achieved. Even if a sufficiently short gat<strong>in</strong>g pulse can begenerated electronically the electrical field between the photocathode <strong>and</strong> the grid must follow thepulse at the same speed. Because the conductivity of the photocathode is relatively low the timeconstant <strong>for</strong>med by the gate-cathode capacitance <strong>and</strong> the cathode resistance limits the switch<strong>in</strong>gspeed. Furthermore, a variable lateral field builds up <strong>in</strong> front of the photocathode that distorts theimage <strong>and</strong> impairs the image resolution. Manufacturers counteract these effects by us<strong>in</strong>g highconductivity photocathodes which, however, compromises sensitivity. High efficiency GaAs <strong>and</strong>GaAsP photocathodes as they are used <strong>in</strong> PMTs have particularly low conductivity <strong>and</strong> are mostlikely not applicable <strong>for</strong> gated image <strong>in</strong>tensifiers.Another RC time constant exists between the grid <strong>and</strong> the multichannel plate. Although the changeof the field <strong>in</strong> front of the plate has only small <strong>in</strong>fluence on the gat<strong>in</strong>g per<strong>for</strong>mance it <strong>in</strong>duces alateral current <strong>in</strong> the multichannel plate that heats the device at high gate repetition rates.The gat<strong>in</strong>g resolution can also be impaired be electron-optical effects. When the gate voltage <strong>in</strong> thesetup of fig. 16 is negative a cloud of photoelectrons builds up between the cathode <strong>and</strong> the grid.When a gate pulse is applied to the grid these electrons pass the grid <strong>and</strong> enter the detection system.Depend<strong>in</strong>g on the grid geometry, the lifetime of the photoelectrons between the grid <strong>and</strong> the cathodecan be of the order of some 100 ps.The effects described above can be reduced by additional grids. Even then a lateral change of thegate delay due to the wave propagation <strong>in</strong> the grid structure rema<strong>in</strong>s. This effect is, however,predictable <strong>and</strong> can be corrected <strong>in</strong> the recorded data.Gatepulse-HVPhotocathodeGateMultichannel PlateFluorescence ScreenCCD CameraFig. 16: Gated Image Intensifier15
St<strong>and</strong>ard gated image <strong>in</strong>tensifier devices have a m<strong>in</strong>imum gate width of the order of a few ns. Adevice with 5ns gate width has been used to determ<strong>in</strong>e s<strong>in</strong>gle exponential decay constants down to afew ns by deconvolution [33]. The shortest gate width obta<strong>in</strong>ed with gated image <strong>in</strong>tensifiers is 50ps <strong>for</strong> low repetition rate applications <strong>and</strong> 200 ps at a repetition rate of 80 MHz [20,51].The general setup of a wide field <strong>and</strong> a scann<strong>in</strong>g microscope with a gated image <strong>in</strong>tensifier is shown<strong>in</strong> fig. 17.PulsedLaserReferencePulsedLaserReferenceTelescopeVariableDelayGateGeneratorGateScanControlScanMirrorScanLensScann<strong>in</strong>g HeadScanMirrorVariableDelayGateGeneratorGateScanControlGateGateImageofSample-HVMicroscopeObjectiveSample+ MCP -CCDGatedImageIntensifierObjectiveSampleImageofSample-HVCCDGatedImageIntensifier+ MCP -16Fig. 17: Wide field microscope (left) <strong>and</strong> scann<strong>in</strong>g microscope (right) with gated image <strong>in</strong>tensifierFor time-resolved imag<strong>in</strong>g a series of images is recorded <strong>for</strong> different delays of the gate pulsereferred to the laser pulse (fig. 18).In a wide field microscope with a high repetition rate laser,such as a Ti:Sa or YLF laser with frequency doubler, the gatedelay can be controlled idependently of the laser pulsesequence. The acqusition time <strong>for</strong> each image is simplychosen to get a sufficient signal-to-noise ratio. If a laser withkHz repetition rate is used, the gate scan has to besynchronised with the laser, i.e. <strong>for</strong> each image a def<strong>in</strong>ednumber of laser shots has to be acquired.If a gated image <strong>in</strong>tensifier is used <strong>in</strong> conjunction with ascann<strong>in</strong>g microscope [20,33], the gate scan must besynchronised with the frame scan rate of the microscope.Gate pulseRecordedphotonsFluorescenceA serious drawback of the gated image <strong>in</strong>tensifier is the lowcount<strong>in</strong>g efficiency. Due to the gat<strong>in</strong>g process, most of the photons collected from the sample aregated off. The count<strong>in</strong>g efficiency is about the ratio of the gate width to the fluorescence lifetime<strong>and</strong> becomes more <strong>and</strong> more significant <strong>for</strong> shorter gate width. For a lifetime of 3.5 ns <strong>and</strong> a gatewidth of 200 ps [20] the efficiency is only 5.7 %. The F value [39], i.e. the ratio of the ideal to theactual SNR is 4.18.The low efficiency must be compensated by a longer acqusition time with correspond<strong>in</strong>gly morephotobleach<strong>in</strong>g <strong>in</strong> the sample. Although the multiple beam technique [48, 49] can be used toconsiderably reduce the acquisition time it does not really improve the detection efficiency.GateDelayGate ScanFig. 18: Scann<strong>in</strong>g a fluorescence decayfunction with the gate pulse
The count<strong>in</strong>g efficiency can be improved by us<strong>in</strong>g a very wide gate <strong>and</strong> measur<strong>in</strong>g the fluorescencewith only two gate delays. S<strong>in</strong>gle exponential decay constants can be derived from the <strong>in</strong>tensities <strong>in</strong>the two time w<strong>in</strong>dows analog to multi-gate photon count<strong>in</strong>g [50]. S<strong>in</strong>ce the measurements <strong>for</strong> thetwo gates have to be done one after another the count<strong>in</strong>g efficiency of such a measurement is closeto 0.5, i.e. by a factor of two less than <strong>for</strong> multi-gate photon count<strong>in</strong>g.In scann<strong>in</strong>g microscope applications the gated image <strong>in</strong>tensifier narrowly beats the multiple gatephoton count<strong>in</strong>g method <strong>for</strong> time resolution. The Pico Star System of La Vison [51] has a m<strong>in</strong>imumgate width of 200 ps compared to 500 ps of the gated photon count<strong>in</strong>g method [57,58]. However,the multiple gate photon count<strong>in</strong>g method has a near-ideal count<strong>in</strong>g efficiency, result<strong>in</strong>g <strong>in</strong> acorrespond<strong>in</strong>gly higher signal to noise ratio (SNR) <strong>for</strong> a given sample exposure.In a scann<strong>in</strong>g microscope the image <strong>in</strong>tensifier cannot compete with time-correlated photoncount<strong>in</strong>g (<strong>TCSPC</strong>) imag<strong>in</strong>g [67,68,69] <strong>in</strong> terms of time resolution <strong>and</strong> count<strong>in</strong>g efficiency. <strong>TCSPC</strong>currently achieves 25 ps resolution <strong>and</strong> an F value <strong>and</strong> a count<strong>in</strong>g efficiency close to one. <strong>TCSPC</strong> iseven able to record <strong>in</strong> several wavelength <strong>in</strong>tervals simultaneously [68] - a feature that pushes theefficiency of <strong>TCSPC</strong> beyond the theoretical limit of any s<strong>in</strong>gle channel detection technique.A gated image <strong>in</strong>tensifier can be used <strong>for</strong> wide field illum<strong>in</strong>ation, <strong>for</strong> scann<strong>in</strong>g with one-photonexcitation <strong>and</strong> <strong>for</strong> scann<strong>in</strong>g with two-photon excitation. However, it cannot be used <strong>in</strong> a confocalsetup, <strong>and</strong> deep tissue two-photon images are blurred by scatter<strong>in</strong>g.The realm of gated image <strong>in</strong>tensifiers is clearly the wide field microscope [23]. If wide fieldillum<strong>in</strong>ation has to be used <strong>for</strong> whatever reason, there is currently no replacement <strong>for</strong> the image<strong>in</strong>tensifiers.Modulation TechniquesModulation techniques use modulated light to excitethe fluorescence. Referred to the excitation light, thefluorescence light has a phase shift <strong>and</strong> a reducedmodulation degree (fig. 19). Both depend on thefluorescence lifetime <strong>and</strong> on the modulationfrequency:ExcitationSampleExcitation FluorescenceFluorescencetan ϕ f = ω τ fM f / M ex = 1 / sqrt ( 1 + ω 2 τ f 2 )ω angular frequency of modulation,M ex modulation of excitation , M f modulation offluorescence, ϕ f phase lag of fluorescence,τ f fluorescence lifetimeBoth the phase <strong>and</strong> the modulation can be used to determ<strong>in</strong>e the fluorescence lifetime. However,phase measurements are much more accurate than measurements of the modulation degree.There<strong>for</strong>e normally the phase is used <strong>for</strong> lifetime measurements. The optimum frequency dependson the lifetime <strong>and</strong> isω = 1 / τ <strong>for</strong> f = 1 / 2Π τ fFig. 19: Modulation techniqueS<strong>in</strong>ce fluorescence lifetimes are of the order of nanoseconds or picoseconds a modulation frequencybetween 50 MHz <strong>and</strong> several 100 MHz is used. To resolve the components of multi-exponentialdecay functions phase measurements at different frequencies are necessary.t17
If a frequency between 100 MHz <strong>and</strong> 1 GHz is used the modulation method gives a time resolution<strong>in</strong> the ps range. For one-photon excitation the light source can be a modulated laser diode or a CWlaser with an external modulator. For two-photon excitation a Ti:Sa laser is used <strong>and</strong> the phase ismeasured at the fundamental pulse frequency of the laser <strong>and</strong> at its harmonics.Tak<strong>in</strong>g <strong>in</strong>to consideration the high frequency, the wide amplitude range of the fluorescence signal<strong>and</strong> the low signal-to noise ratio the phase measurement is anyth<strong>in</strong>g but simple. Consequently, thereare several modifications of the method depend<strong>in</strong>g on different excitation sources, detectors <strong>and</strong>phase measurement methods.S<strong>in</strong>gle Channel Modulation TechniquesThe general pr<strong>in</strong>ciple of the s<strong>in</strong>gle channel modulationtechnique is shown <strong>in</strong> fig. 20.The light from the laser is modulated at a frequency <strong>in</strong> therange of 30 MHz to 1 GHz. The fluorescence light from thesample is detected by a PMT or a photodiode. The ACcomponent of the detector signal is amplified <strong>and</strong> fed <strong>in</strong>totwo mixers that mix the signal with the modulationfrequency at 0° <strong>and</strong> 90° phase shift. Mix<strong>in</strong>g means actually amultiplication of the signals, there<strong>for</strong>e the outputs of themixers deliver a DC component that represents the 0° <strong>and</strong>90° components of the amplified detector signal. After lowpass filter<strong>in</strong>g the phase can be calculated from the mixersignals. The pr<strong>in</strong>ciple is analog to a dual-phase lock-<strong>in</strong>amplifier <strong>and</strong> often called lock-<strong>in</strong> detection [52,53].The modulation technique can be used to record the fluorescence of several chromophoressimultaneously <strong>in</strong> several parallel mixer systems. Several lasers which are modulated at differentfrequencies provide different excitation wavelengths. The emission of the sample is split <strong>in</strong>toseveral wavelength ranges <strong>and</strong> detected by separate detectors. The detector signals are mixed withthe modulation frequencies of the <strong>in</strong>dividual lasers <strong>in</strong> several parallel groups of mixers [52, 53].Un<strong>for</strong>tunately high frequency mixers do not work well <strong>for</strong>DC output signals. There<strong>for</strong>e, often a heterodyne pr<strong>in</strong>ciple,similar to that <strong>in</strong> a radio, is used (fig. 21). The detectorsignal <strong>and</strong> the modulation frequency are mixed with anoscillator frequency slightly different from the modulationfrequency. The result are two signals at the differencefrequency. The phase shift between the two signals is thesame as between the detector signal <strong>and</strong> the modulationsignal. Depend<strong>in</strong>g on the frequency difference, the outputsignals of the mixers are usually <strong>in</strong> the kHz range. There<strong>for</strong>ethey can directly be digitised. The results of the ADconversion are filtered <strong>and</strong> used <strong>for</strong> phase measurement. Theadvantage of direct digitis<strong>in</strong>g is that effective digital filter<strong>in</strong>galgorithms can be applied <strong>and</strong> the phase can be determ<strong>in</strong>edvia fast Fourier trans<strong>for</strong>m [54, 55].Cont<strong>in</strong>uous Laser Modulator SampleGeneratorMixerPhaseCalculationDetectorAmplifier0° 90° MixerFig. 20: Modulation techniqueLaser Modulator SampleGeneratorf modOscillatorMixerf osc f mod - f oscdigitiserA/DDetectorA/Ddigital filterphase calculationMixerdigitiserFig. 21: Heterodyne pr<strong>in</strong>ciple18
A phase fluorometer of this type can be built up by us<strong>in</strong>g a commercially available network analyser<strong>and</strong> a laser diode. The setup is very simple - unless you have to build the network analyser. Thepr<strong>in</strong>ciple is shown <strong>in</strong> fig. 22. The network analyser runs afrequency sweep over a selectable frequency <strong>in</strong>terval. Theoutput signal of the network analyser drives a laser diodethat is used to excite the sample. The detected fluorescencesignal is fed back <strong>in</strong>to the signal analyser. The measurementdelivers the phase <strong>and</strong> the amplitude of the signal as afunction of the frequency. The network analyser is even ableto correct the results by us<strong>in</strong>g reference data recorded with ascatter<strong>in</strong>g solution <strong>in</strong> place of the sample.The mixers used <strong>in</strong> fig. 20 <strong>and</strong> 21 can be replaced with amodulated detector (fig. 23). A setup of this type has beenused <strong>for</strong> lifetime imag<strong>in</strong>g <strong>in</strong> a two-photon laser scann<strong>in</strong>gmicroscope [54]. A commercially available frequencysynthesiser generates the modulation frequency, theoscillator frequency <strong>and</strong> the difference of both with a highfrequency <strong>and</strong> phase stability. Mix<strong>in</strong>g is accomplished bymodulat<strong>in</strong>g the ga<strong>in</strong> <strong>in</strong> a photomultiplier. The mixed signalat the output of the PMT has a frequency of 25 kHz <strong>and</strong> isdirectly digitised. Further filter<strong>in</strong>g <strong>and</strong> phase calculation isdone digitally.The benefit of the detector modulation is that the modulationfrequency is not limited by the b<strong>and</strong>width of the ga<strong>in</strong> systemof the PMT. There<strong>for</strong>e relatively high modulationfrequencies can be used. The drawback is that the detector isa very poor mixer. This results <strong>in</strong> a poor efficiency of thedetector ga<strong>in</strong> modulation technique.If a Ti:Sa laser is used <strong>in</strong> a modulation system, e.g. <strong>for</strong> twophotonexcitation, the 80 MHz fundamental repetitionfrequency of the laser <strong>and</strong> its harmonics can be used asmodulation frequency. Due to the short pulse width theAmplifierspectrum of the laser modulation is actually a frequency comb that extends up to THz frequencies.By proper tun<strong>in</strong>g of the frequency synthesiser, any of the harmonics of the fundamental repetitionfrequency with<strong>in</strong> the detector b<strong>and</strong>width can be used <strong>for</strong> the phase measurement.A heterodyne system with a Ti:Sa laser, two-photon excitation <strong>and</strong> modulated PMT delivered alifetime accuracy of ± 300 ps <strong>for</strong> lifetimes between 2.4 <strong>and</strong> 4.2 ns [54]. This relatively pooraccuracy is probably due to the short acquisition time of only 160 µs per pixel or 10 seconds <strong>for</strong> a256 x 256 pixel image. Although the photon detection rate was estimated to be more than 10 8photons/s - which is probably an overestimation - the accuracy is of the same order as <strong>for</strong> <strong>TCSPC</strong>imag<strong>in</strong>g with 10 6 photons per second <strong>and</strong> the same acquisition time <strong>and</strong> pixel number.The efficiency of the s<strong>in</strong>gle channel modulation technique <strong>in</strong> terms of photon counts stronglydepends on the operat<strong>in</strong>g conditions. Results of Monte-Carlo simulations of the efficiency <strong>for</strong>s<strong>in</strong>gle-exponential decay are given <strong>in</strong> [39]. The simulations yield ‘F values’, i.e. the ratio of theideal SNR to the SNR achieved by the <strong>in</strong>vestigated method.For a setup with separate detector <strong>and</strong> mixer, s<strong>in</strong>e-wave-modulated excitation, s<strong>in</strong>e-wave mix<strong>in</strong>g<strong>and</strong> 100% modulation of the excitation F was found to be 3.7. If the modulation is less than 100% aLaserDiodeNetwork AnalyserRF outDiode BiasSampleRF <strong>in</strong>DetectorAmplifierFig. 22: Phase fluorometer with a networkanalyserFrequencySynthesiserLaser Modulator Samplef modf oscf mod - f oscdigitiserA/DGa<strong>in</strong>modulatedDetectorA/Ddigital filterphase calculationf mod - f oscdigitiserFig. 23: Mix<strong>in</strong>g by ga<strong>in</strong>-modulat<strong>in</strong>g the detector19
fraction of unmodulated light is detected which contributes to the noise, but not to the phasemeasurement signal. The SNR drops dramatically <strong>for</strong> less than 75% modulation [39]. Interest<strong>in</strong>gly,<strong>in</strong> the same setup 100 % square-wave modulation of the excitation gives an F = 1.2, <strong>and</strong> Dirac pulseexcitation even F = 1.1. This is a strong argument to use pulsed lasers, i.e. Ti:Sa or diode lasersrather than modulat<strong>in</strong>g CW lasers.For a ga<strong>in</strong>-modulated detector the efficiency is much worse than <strong>for</strong> a detector <strong>and</strong> a separatemixer. The reason is that a ga<strong>in</strong> modulated detector is a very bad mixer. True mix<strong>in</strong>g means tomultiply the detected signal with a s<strong>in</strong>e wave, i.e. to <strong>in</strong>vert the polarity of the signal <strong>for</strong> the negativehalf-period of the mix<strong>in</strong>g signal. Of course, ga<strong>in</strong> modulation at best means to change the ga<strong>in</strong>between 100% <strong>and</strong> 0. There<strong>for</strong>e a large fraction of the <strong>in</strong>put signal rema<strong>in</strong>s unused, but contributeswith its shot noise to the noise of the result. The F values <strong>for</strong> the modulated detector are around 4.That means, the technique needs 16 times more photons than techniques with a near-ideal F.For extremely low light levels the situation can be even worse. A high ga<strong>in</strong> detector, such as a PMT,delivers a tra<strong>in</strong> of extremely short current pulses rather than a cont<strong>in</strong>uous signal. The pulses are dueto the detection of the r<strong>and</strong>omly arriv<strong>in</strong>g photons. If this pulse tra<strong>in</strong> is fed to a phase measurementcircuitry described above a phase signal is produced only <strong>for</strong> a short time after the detection of aphoton. In the times between the phase detector is unable to deliver a reasonable signal. What thenhappens depends on the phase detection electronics or the equivalent software algorithm. A normalphase detector <strong>in</strong> the absence of a signal delivers a huge noise. This noise is averaged with ther<strong>and</strong>omly appear<strong>in</strong>g phase signals <strong>for</strong> the <strong>in</strong>dividual photons. The result is a dramatic drop of thesignal-to-noise ratio <strong>for</strong> low photon rates.For application with a scann<strong>in</strong>g microscope it must be taken <strong>in</strong>to regard that phase measurementsare not compatible with the fast scann<strong>in</strong>g speed of a state-of-the art laser scann<strong>in</strong>g microscope. Forthe lock-<strong>in</strong> method the low pass filters must have time to settle, <strong>and</strong> the heterodyne method requiresto record at least some periods of the difference frequency f mod - f osc . There<strong>for</strong>e, m<strong>in</strong>imum pixeldwell times are <strong>in</strong> the order of 40 to 160 µs. It is not clear whether a long pixel dwell time <strong>in</strong>creasesthe photodamage <strong>in</strong> the sample. At least, the implementation of s<strong>in</strong>gle channel modulationtechniques <strong>in</strong> commercial scann<strong>in</strong>g microscopes requires changes <strong>in</strong> the scan control of themicroscope.Another problem can arise <strong>for</strong> deep tissue imag<strong>in</strong>g with a confocal or two-photon microscope. Inthis case the presumption that the time-doma<strong>in</strong> response of the sample is a sum of exponentials isquestionable. Scattered excitation light <strong>and</strong> broaden<strong>in</strong>g of the fluorescence decay functions byscatter<strong>in</strong>g rema<strong>in</strong> unnoticed unless a cont<strong>in</strong>uous sweep over wide frequency <strong>in</strong>terval is per<strong>for</strong>med.The conclusion is that the s<strong>in</strong>gle channel modulation technique is not the best lifetime technique <strong>for</strong>scann<strong>in</strong>g microscope applications. The true realm of the s<strong>in</strong>gle channel modulation technique is <strong>in</strong>the <strong>in</strong>frared where no detectors with s<strong>in</strong>gle photon sensitivity are available.Modulated Image IntensifiersThe modulated image <strong>in</strong>tensifier technique uses the same vacuum device as the gated image<strong>in</strong>tensifier technique. However, the grid is driven by a s<strong>in</strong>e wave or square wave signal rather thanby a short gat<strong>in</strong>g pulse [55,56]. Modulation can also be achieved without a grid by modulat<strong>in</strong>g thevoltage between the photocathode <strong>and</strong> the channel plate.As <strong>for</strong> the gated image <strong>in</strong>tensifier, the problem is the low conductivity of the photocathode. Thetime constant <strong>for</strong>med by the gate-cathode capacitance <strong>and</strong> the cathode resistance limits themodulation frequency <strong>and</strong> <strong>in</strong>troduces lateral phase variation across the image. Furthermore, a20
variable lateral field builds up <strong>in</strong> front of the photocathode that distorts the image <strong>and</strong> impairs theimage resolution.Modulat<strong>in</strong>g the voltage across the channel plate [55] has also been attempted. The drawback of thismethod is the heat<strong>in</strong>g of the channel plate due to dielectric losses <strong>and</strong> the low degree of modulation.The microscope setup <strong>for</strong> a modulated image <strong>in</strong>tensifier is shown <strong>in</strong> fig. 24. The setup is verysimilar to that <strong>for</strong> the gated image <strong>in</strong>tensifier.CWLaserFreqencySynthes.PulsedLaserFreqencySynthes.AOMAOMDriverAOMAOMDriverTelescopeVariablePhase ShiftScanMirrorScann<strong>in</strong>g HeadScanMirrorVariablePhase ShiftAmplifierScanLensAmplifierGridGridImageofSample-HV + MCP -MicroscopeObjectiveSampleCCDImageIntensifierObjectiveSampleImageofSample-HV+ MCP -CCDImageIntensifierFig. 24: Modulated image <strong>in</strong>tensifier used at a wide field microscope (left) <strong>and</strong> at a scann<strong>in</strong>g microscope (right)A frequency synthesiser generates a modulation frequency which is typically <strong>in</strong> the range of50 MHz to 500 MHz. This frequency is used to modulate the excitation light <strong>and</strong> the image<strong>in</strong>tensifier. A variable phase shifter is used to change the phase relation between the modulation ofthe light source <strong>and</strong> the modulation of the image <strong>in</strong>tensifier. From three images acquired at differentphase shifts the phase of the fluorescence signal referred to the excitation can be calculated.Instead of the phase shifter a heterodyne technique can be used. In this case the image <strong>in</strong>tensifier ismodulated with a slightly different frequency than the laser. This causes the phase between the twomodulations to change cont<strong>in</strong>uously. If the difference frequency is a few Hz a sequence of imagescan be obta<strong>in</strong>ed <strong>for</strong> each period of the difference frequency [55]. The heterodyne technique requiresa good frequency synthesiser that delivers the two modulation frequencies <strong>and</strong> the difference of bothwith high frequency <strong>and</strong> phase stability.A s<strong>in</strong>gle phase measurement at a fixed frequency allows to determ<strong>in</strong>e the time constant of a s<strong>in</strong>gleexponential fluorescence decay function. To resolve the components of a multi-exponential decaymeasurements at different frequencies are required. Ideally, the modulation frequencies should be ofthe order off mod = 1 / 2Πτ f withf mod = Modulation Frequency, τ f = Fluorescence decay time constantAt this frequency the change of the phase is at maximum <strong>for</strong> a given change of the decay timeconstant. For decay components below a few 100 ps the optimum frequency is around 1 GHz.Modulation frequencies of this order are almost impossible to achieve with st<strong>and</strong>ard image21
<strong>in</strong>tensifiers. The dielectric losses cause heat dissipation <strong>in</strong> the <strong>in</strong>tensifier tube structures, <strong>and</strong> thereis a considerable phase shift between different parts of the image area.A modulated image <strong>in</strong>tensifier can be used <strong>for</strong> one-photon <strong>and</strong> multi-photon fluorescence imag<strong>in</strong>gwith high repetition rate pulsed fs laser. The pulse tra<strong>in</strong> of the laser conta<strong>in</strong>s all harmonics of thefundamental repetition frequency. In the frequency doma<strong>in</strong> the laser pulse tra<strong>in</strong> is actually afrequency comb that extends to THz range. Generally, by modulation the <strong>in</strong>tensifier at theharmonics of the laser frequency a multi-frequency measurement can be accomplished [55,56]. Aproblem associated with this technique is that the ga<strong>in</strong> modulation is nonl<strong>in</strong>ear <strong>and</strong> there<strong>for</strong>e notideally s<strong>in</strong>usoidal. There<strong>for</strong>e the measurement signal obta<strong>in</strong>ed at a particular harmonic of the laseralso conta<strong>in</strong>s a small fraction of higher harmonics.A drawback of the image <strong>in</strong>tensifier technique is that it cannot be used <strong>in</strong> a confocal scann<strong>in</strong>gmicroscope. There<strong>for</strong>e depth resolution can only be achieved by two-photon excitation with a fslaser [55]. Even then the spatial resolution is limited by scatter<strong>in</strong>g of the emission light <strong>in</strong> thesample. The multiple beam technique described <strong>for</strong> the gated image <strong>in</strong>tensifier <strong>in</strong> [48,49] is alsoapplicable <strong>for</strong> the modulated <strong>in</strong>tensifier technique.The efficiency of the modulated image <strong>in</strong>tensifier <strong>in</strong> terms of photon exploitation has been<strong>in</strong>vestigated theoretically by Monte-Carlo simulations [39]. The F value, i.e. the SNR of an idealmeasurement compared to the actually obta<strong>in</strong>ed SNR is 10 <strong>for</strong> s<strong>in</strong>e-wave modulated exciatation <strong>and</strong>4.3 <strong>for</strong> dirac modulation. That means the image <strong>in</strong>tensifier needs 18.5 to 100 times more photonsthan techniques with perfect exploitation of the photons, e.g. time-correlated s<strong>in</strong>gle photoncount<strong>in</strong>g.The reason <strong>for</strong> the high F values is that the ga<strong>in</strong> can only be modulated between 0 <strong>and</strong> 1. Idealmix<strong>in</strong>g requires ga<strong>in</strong> modulation between -1 <strong>and</strong> +1. Thus the modulation depth is only 50%. The Fvalues are even worse if the modulation of the ga<strong>in</strong> <strong>in</strong> the <strong>in</strong>tensifier tube is less than 50% - which iscerta<strong>in</strong>ly the case if a device without a grid is used. Moreover, the modulation is an efficiencymodulation rather than a ga<strong>in</strong> modulation - the photoelectrons from the photocathode are eitherrejected or transmitted <strong>in</strong>to the channel plate. There<strong>for</strong>e the efficiency is worse than <strong>for</strong> a detectorwith a subsequent mixer.The time resolution of the modulated image <strong>in</strong>tensifier technique was reported to be down to a few100 ps [55,56]. It is likely that much shorter lifetimes can be resolved if a sufficiently longacquisition time is used.Generally the resolution of frequency doma<strong>in</strong> techniques cannot directly be compared to theresolution of time doma<strong>in</strong> methods. The decay times are calculated from the phase (i.e. from a partof the Fourier spectrum) of the fluorescence signal. This calculation <strong>in</strong>cludes referencemeasurements <strong>for</strong> a reference sample or zero decay time <strong>for</strong> each frequency. Correctly, theresolution of frequency doma<strong>in</strong> methods should be compared with the resolution of time-doma<strong>in</strong>methods with deconvolution of the decay data. Deconvolution of <strong>TCSPC</strong> data obta<strong>in</strong>ed with anMCP PMT resolves s<strong>in</strong>gle exponential decay times down to a few ps.Due to the low efficiency the modulated image <strong>in</strong>tensifier technique it cannot be recommend as alifetime method <strong>for</strong> laser scann<strong>in</strong>g microscopes. However, the technique is applicable to wide fieldillum<strong>in</strong>ation. If wide field illum<strong>in</strong>ation has to be used <strong>for</strong> whatever reason there is currently noreplacement <strong>for</strong> the gated <strong>and</strong> modulated image <strong>in</strong>tensifier techniques.22
Gated Photon CountersAs all photon count<strong>in</strong>g techniques, gated photoncount<strong>in</strong>g uses a fast, high ga<strong>in</strong> detector that is usually a Pulsed LaserSamplePMT or a s<strong>in</strong>gle photon avalanche photodiode. Thes<strong>in</strong>gle photon pulses from the detector are countedDetectorwith<strong>in</strong> one or more time <strong>in</strong>tervals. Due to the moderateReferencetime resolution of the gat<strong>in</strong>g technique there are nospecial requirements to the transit time spread of the Variable Delaydetector. However, the transit time distribution shouldGate Counternot have a long tail, or bumps <strong>and</strong> prepulses orafterpulses <strong>and</strong> should be stable over the detection area.The pr<strong>in</strong>ciple of a gated photon counter with a s<strong>in</strong>gleGated Photon Count<strong>in</strong>g (s<strong>in</strong>gle gate)Fig. 25: Gated Photon counter with s<strong>in</strong>gle gategate is shown <strong>in</strong> fig. 25.To record the shape of a fluorescence decay function the gate pulse can be scanned over the time<strong>in</strong>terval of <strong>in</strong>terest by a variable delay generator. This method yields a decay curve with as manypo<strong>in</strong>ts as the delay unit has delay steps. However, the majority of the photons is discarded by thegat<strong>in</strong>g. Thus, the count<strong>in</strong>g efficiency is low <strong>and</strong> the F value is of the same order as <strong>for</strong> the gatedimage <strong>in</strong>tensifier. Although ready-to use gated photon counters are available nobody seriouslyconsiders to use this technique <strong>for</strong> lifetime imag<strong>in</strong>g.A count<strong>in</strong>g efficiency close to one can theoretically beachieved by a multiple gate architecture, fig. 26. The systemPulsed LaserSampleconta<strong>in</strong>s several parallel counters with <strong>in</strong>dividual gates. Thegates are controlled via separate gate delays <strong>and</strong> by separategate pulse generators. If the measured decay curve isDetectorcompletely covered by subsequent gate pulses all detectedphotons are counted. Moreover, the parallel counterstructure can be operated at extremely high count rates. EvenReferenceVariable DelayGate CounterVariable Delay<strong>for</strong> count rates of several MHz there is almost no count<strong>in</strong>gGate Counterloss due to the short dead time of the counters. The practicalimplementation of the method is described <strong>in</strong> [57, 58].Variable DelayGate CounterAnother benefit is that no special vacuum devices as <strong>for</strong> theVariable DelayGate Counterimage <strong>in</strong>tensifier technique are required. The methodimmediately benefits from new detector developments, e.g.PMTs with high efficiency cathode materials [59,60].Gated Photon Count<strong>in</strong>g (multiple gate)Fig. 26: Gated photon count<strong>in</strong>g with several gatesLimitations of the method result from the relatively long gate duration <strong>and</strong> from the limited numberof gate <strong>and</strong> counter channels. From the of signal-theory-po<strong>in</strong>t of view, the function of photondensity versus time is heavily ‘undersampled’. In other words, the maximum frequency detectable <strong>in</strong>the signal spectrum is sampled less than 2 times per signal period. Undersampled signals cannot bereconstructed from the sample values without presumptions about the signal shape.23
Fortunately, decay curves are either s<strong>in</strong>gle exponentialsor a sum of a few exponentials. Ideally, the lifetime of as<strong>in</strong>gle exponential decay can be calculated from thephotons collected <strong>in</strong> only two time w<strong>in</strong>dows, see fig. 27.The optimum gate width was determ<strong>in</strong>ed to be T = 2.5 τ f[38]. It has been shown that the components of multiexponentialdecay functions can be determ<strong>in</strong>ed if thenumber of gates is <strong>in</strong>creased [61].However, practically the photons distribution is theconvolution of the fluorescence decay function with the<strong>in</strong>strument response function (IRF), i.e. the excitationpulse shape, the detector TTS, the pulse dispersion <strong>in</strong> theoptical system, <strong>and</strong> the effective shape of the gat<strong>in</strong>gpulse. The result<strong>in</strong>g fluorescence signal cannot beconsidered to be a sum of exponentials (fig. 28). Toobta<strong>in</strong> the fluorescence lifetime from the <strong>in</strong>tensity <strong>in</strong> twotime w<strong>in</strong>dows these must be placed <strong>in</strong> a part of thefluorescence signal where the IRF has dropped below thenoise level, i.e. <strong>in</strong> a region where the fluorescence signalis exponential. This, however, reduces the count<strong>in</strong>gefficiency by discard<strong>in</strong>g the most <strong>in</strong>tense portion of thesignal. Practically it is probably better to tolerate someerror <strong>in</strong> the lifetime calculation <strong>and</strong> to calibrate thesystem by us<strong>in</strong>g known fluorescence lifetimes. However,<strong>for</strong> double- or multi-exponential decay functions acalibration appears difficult if not impossible.The shortest gate width that has practically been used is of the order of 500 ps. Although lifetimesdown to 70 ps have been measured with reasonable accuracy it is difficult to measure lifetimesbelow 200 ps. Double exponential decay functions of <strong>FRET</strong> systems with a fast component of 100to 300 ps probably cannot be resolved.Practical devices based on multi-gate photon count<strong>in</strong>g work with a direct readout of the countersafter the acquisition of each pixel of the image [57]. This sets a lower limit to the pixel dwell time<strong>in</strong> the 10 us range. Consequently, the maximum scan speed of a laser scann<strong>in</strong>g microscope cannotbe exploited. It is not clear whether this <strong>in</strong>creases the photobleach<strong>in</strong>g of the sample viaaccumulation of triplet states or heat concentration <strong>in</strong> the scanned spot. The problem - if it exists -could easily be overcome by implement<strong>in</strong>g a memory that accumulates the results <strong>in</strong> memorylocations accord<strong>in</strong>g to the x,y location of the laser spot <strong>in</strong> the scann<strong>in</strong>g area.For samples conta<strong>in</strong><strong>in</strong>g different chromophores the count<strong>in</strong>g efficiency <strong>and</strong> the amount of<strong>in</strong><strong>for</strong>mation <strong>in</strong> the data can be improved by record<strong>in</strong>g the fluorescence <strong>in</strong> several wavelengthchannels simultaneously. Steady-state multi-wavelength imag<strong>in</strong>g has been successfully used toseparate different chromophores <strong>in</strong> stead-state images [13]. The gated photon count<strong>in</strong>g techniquebasically can be used with several detectors if the number of gate <strong>and</strong> counter channels is <strong>in</strong>creased.Several gates can be driven by the same delay <strong>and</strong> gate pulse generator so that the <strong>in</strong>crease ofsystem complexity is less than proportional. Although a multi-wavelength gated SPC system has notbecome known yet it could improve the selectivity <strong>for</strong> different chromophores considerably.Theoretical <strong>in</strong>vestigation of the efficiency [39] delivers an F value of 1.5 <strong>for</strong> two gates of a width of2.5 τ. For 8 gates with unequal width F = 1.1 can be achieved. However, practically τ is unknown<strong>and</strong> varies throughout the image so that the gate width is usually not optimal. Furthermore, the first24IaTe -t/tauTtau =ln ( Ia / Ib )IbFig. 27: Calculation of fluorescence lifetime from<strong>in</strong>tensities <strong>in</strong> two time <strong>in</strong>tervals, ideal IRFInstrumentResponseFunction(IRF)Fluorescence SignalIaTTe -t/tau ~Ttau =ln ( Ia / Ib )Fig. 28: Calculation of fluorescence lifetime from<strong>in</strong>tensities <strong>in</strong> two time <strong>in</strong>tervals, real IRFIbT
part of the signal can probably not be used because it is convoluted with the system response.Assum<strong>in</strong>g a loss of a factor of two <strong>in</strong> the number of counted photons the +method ends up at F = 1.5to 2.1 which is much better than <strong>for</strong> the image <strong>in</strong>tensifiers <strong>and</strong> noticeably better than s<strong>in</strong>e-wavemodulation techniques.Acquisition times <strong>for</strong> biological samples sta<strong>in</strong>ed with highly fluorescent dyes are <strong>in</strong> the range 10 to100 seconds [58,11]. Generally the acquisition times <strong>for</strong> comparable lifetime accuracy should beexpected <strong>in</strong> the same range as <strong>for</strong> <strong>TCSPC</strong> imag<strong>in</strong>g (see below) unless count rates exceed<strong>in</strong>g 5 MHzare available. As <strong>for</strong> <strong>TCSPC</strong> imag<strong>in</strong>g, the acquisition time can be reduced by decreas<strong>in</strong>g the numberof pixels of the scan.Multi-gate photon count<strong>in</strong>g has its merits <strong>in</strong> applications that require to record lifetimes <strong>in</strong> the rangeof a few ns at high count rate <strong>and</strong> with short acquisition times. Typical applications are lifetimeimag<strong>in</strong>g with marker dyes <strong>for</strong> Ca++, Na+, O-- or other parameters with<strong>in</strong> cells <strong>and</strong> tissue [11b].Prob<strong>in</strong>g of DNA <strong>and</strong> RNA by the lifetime change of SYTO13 is described <strong>in</strong> [11, 11a].25
Time-Correlated S<strong>in</strong>gle Photon Count<strong>in</strong>g (<strong>TCSPC</strong>)Time-Correlated S<strong>in</strong>gle Photon Count<strong>in</strong>g is based on the detection of s<strong>in</strong>gle photons of a periodicallight signal, the measurement of the detection times of the <strong>in</strong>dividual photons <strong>and</strong> the reconstructionof the wave<strong>for</strong>m from the <strong>in</strong>dividual time measurements [62, 63]. The pr<strong>in</strong>ciple is shown <strong>in</strong> fig. 29.The fluorescence is excited by a pulsed laser with arepetition rate of typically 80 MHz. The fluorescencephotons are detected by a fast PMT, MCP or a s<strong>in</strong>glephoton avalanche photodiode. For precisionmeasurements these detectors allow count rates of theorder of a few MHz, i.e. much less than the laserrepetition rate. The <strong>TCSPC</strong> method makes use of thefact that the detection of several photons <strong>in</strong> one laserperiod is small enough to be neglected. When a photonis detected the time of the correspond<strong>in</strong>g detector pulse<strong>in</strong> the laser pulse sequence is measured. The measuredtimes are used to address a histogram memory <strong>in</strong> whichthe photons are accumulated. After acquir<strong>in</strong>g a largenumber of photons the photon density versus timebuilds up <strong>in</strong> the memory.Detector Signal:Period 1Period 2Period 3Period 4Period 5Period 6Period 7Period 8Period 9Period 10Period NResult aftercollect<strong>in</strong>g manyPhotonsOptical Wave<strong>for</strong>mTimeThe method may look circumstantial at first glance, butit has some strik<strong>in</strong>g benefits - a near-ideal count<strong>in</strong>gefficiency <strong>and</strong> an ultra-high time resolution.memory locationFig. 29: Time-correlated s<strong>in</strong>gle photon count<strong>in</strong>gAs long as the count rate is not so high that the conversion time of the time measurement <strong>and</strong>histogramm<strong>in</strong>g procedure becomes noticeable there is no loss of photons. The F value describ<strong>in</strong>gthe ratio of the ideal SNR to the actually obta<strong>in</strong>ed SNR is < 1.1 [38,39].The resolution is limited by the transit time spread <strong>in</strong> the detector, by the tim<strong>in</strong>g accuracy of thediscrim<strong>in</strong>ator that receives the detector pulses <strong>and</strong> by the accuracy of the time measurement. Withan MCP-PMT the width of the <strong>in</strong>strument response function is of the order of 25 to 30 ps. Thewidth of the time channels of the histogram can be made less than 1 ps [63]. There<strong>for</strong>e, the<strong>in</strong>strument response function is sufficiently sampled to determ<strong>in</strong>e lifetimes down to a few ps.The <strong>TCSPC</strong> technique is often believed to be extremely slow <strong>and</strong> unable to reach short acquisitiontimes. This ill reputation comes from older NIM systems used <strong>in</strong> conjunction with low repetitionrate light sources which are <strong>in</strong>deed not applicable <strong>for</strong> time-resolved imag<strong>in</strong>g.However, high count rate techniques exist [64] s<strong>in</strong>ce the late 80s. An early - probably the first -implementation of <strong>TCSPC</strong> <strong>in</strong> a microscope is described <strong>in</strong> [65].State-of-the-art <strong>TCSPC</strong> devices use a new conversion pr<strong>in</strong>ciple <strong>and</strong> achieve count rates of several10 6 photons per seconds [63]. A system with four parallel <strong>TCSPC</strong> channels <strong>and</strong> 20 MHz usefulcount rate is described <strong>in</strong> [66]. The system was used <strong>in</strong> a slow-scan setup <strong>for</strong> optical tomography<strong>and</strong> can be comb<strong>in</strong>ed with a multi-detector technique [63,66]. Although a comb<strong>in</strong>ation with ascann<strong>in</strong>g microscope has not become known yet the system is basically able to record images <strong>in</strong> upto 32 detector channels with slow scan rates at count rates comparable to multi-gate photoncount<strong>in</strong>g [57].26
<strong>TCSPC</strong> Imag<strong>in</strong>g<strong>TCSPC</strong> Imag<strong>in</strong>g is an advanced <strong>TCSPC</strong> technique used <strong>in</strong> conjunction with scann<strong>in</strong>g microscopes.The method builds up a three-dimensional histogram of the photon number over the time <strong>and</strong> thecoord<strong>in</strong>ates of the scan area. The pr<strong>in</strong>ciple is shown <strong>in</strong> figure 30. The record<strong>in</strong>g electronics consistsof a time measurement channel, a scann<strong>in</strong>g <strong>in</strong>terface, <strong>and</strong> a large histogram memory.The time measurement channel conta<strong>in</strong>s the usual <strong>TCSPC</strong> build<strong>in</strong>g blocks. Two constant fractiondiscrim<strong>in</strong>ators, CFD, receive the s<strong>in</strong>gle photon pulses from the detector <strong>and</strong> the reference pulsesfrom the laser. The time-to-amplitude converter, TAC, measures the time from the detection of aphoton to the next laser pulse. This ‘reversed start-stop‘ pr<strong>in</strong>ciple is the key to the process<strong>in</strong>g ofhigh laser repetition rates. The analog-digital converter, ADC, converts the TAC output voltage <strong>in</strong>toan address <strong>for</strong> the memory.DetectorTim<strong>in</strong>gStartStopfrom LaserTimeMeasurementCFDTAC ADCCFDtTime with<strong>in</strong> decay curveFrame SyncL<strong>in</strong>e SyncPixel ClockfromMicroscopeCounter YScann<strong>in</strong>gInterfaceCounter XyHistogramMemoryxLocation with<strong>in</strong> scann<strong>in</strong>g areaFig. 30: <strong>TCSPC</strong> Imag<strong>in</strong>gThe scann<strong>in</strong>g <strong>in</strong>terface is a system of counters. It receives the scan control pulses from themicroscope <strong>and</strong> determ<strong>in</strong>es the current position of the laser beam <strong>in</strong> the scann<strong>in</strong>g area.When a photon is detected the device determ<strong>in</strong>es the time, t, with<strong>in</strong> the fluorescence decay curve<strong>and</strong> the location of the laser spot with<strong>in</strong> the scann<strong>in</strong>g area, x, y. These values are used to address thehistogram memory. Consequently, <strong>in</strong> the memory the photon distribution versus t, x, <strong>and</strong> y buildsup. The result can be <strong>in</strong>terpreted as a stack of images <strong>for</strong> different times after the excitation pulse oras an array of pixels conta<strong>in</strong><strong>in</strong>g a complete fluorescence decay function each.The implementation of <strong>TCSPC</strong> imag<strong>in</strong>g <strong>in</strong>to Zeiss microscopes is described <strong>in</strong> [67-69]. Thedescribed <strong>in</strong>strument consist of a Zeiss LSM-510 NLO Laser scann<strong>in</strong>g microscope, a femtosecondTi:Sa laser, a fast PMT, <strong>and</strong> a Becker & Hickl SPC-730 <strong>TCSPC</strong> imag<strong>in</strong>g module [63]. The setup isshown <strong>in</strong> fig. 31.27
Zeissb&hSPC-730 <strong>TCSPC</strong> Imag<strong>in</strong>g ModulePMH-100 200psR3809U
presented <strong>in</strong> [67-75]. An example is shown <strong>in</strong> fig. 33. The sample is sta<strong>in</strong>ed with three differentdyes which are clearly dist<strong>in</strong>guished <strong>in</strong> the lifetime image.An application to <strong>FRET</strong> imag<strong>in</strong>g (after [68]) is shown <strong>in</strong> figure 34.11221ns 2ns 1Lifetime, s<strong>in</strong>gle exponentialapproximationRatio of <strong>in</strong>tensitycoefficients, fast/slow2Fig. 34: HEK cell conta<strong>in</strong><strong>in</strong>g CFP <strong>and</strong> YFP <strong>in</strong> the α <strong>and</strong> β subunits of the sodium channels.Left: Lifetime image of donor, CFP, centre: Decay curves of selected pixels, right: <strong>FRET</strong> image show<strong>in</strong>g ratio of<strong>in</strong>tensity coefficients of quenched <strong>and</strong> unquenched fluorescence componentsData from [68], Zeiss LSM-510, Becker & Hickl SPC-730The sample is an HEK cell conta<strong>in</strong><strong>in</strong>g CFP <strong>and</strong> YFP <strong>in</strong> the α <strong>and</strong> β subunits of the sodiumchannels. S<strong>in</strong>ce the emission spectrum of CFP overlaps the absorption spectrum of YFP <strong>FRET</strong> isexpected <strong>in</strong> regions where the subunits are close together. Fig. 34, left, shows a lifetime image ofthe donor, CFP, obta<strong>in</strong>ed from a s<strong>in</strong>gle exponential fit through the decay functions <strong>in</strong> the <strong>in</strong>dividualpixels.Fig. 34, centre, shows decay curves of two selected pixels from the yellow (short lifetime) <strong>and</strong> blue(long lifetime) area of the lifetime image. Double exponential decay analysis yields two decaycomponents of about 380 ps <strong>and</strong> 1.8 to 2 ns throughout the image. However, the <strong>in</strong>tensitycoefficients, a, differ considerably <strong>in</strong> different parts of the cell. Assum<strong>in</strong>g that the lifetimecomponents belong to the quenched <strong>and</strong> unquenched donor molecules the ratio of the <strong>in</strong>tensitycoefficients, a fast / a slow, should represent the ratio of the number of quenched <strong>and</strong> unquenched CFPmolecules. There<strong>for</strong>e the ratio of the coefficients can be used as a measure <strong>for</strong> the <strong>FRET</strong> <strong>in</strong>tensity.Fig. 34, right shows a <strong>FRET</strong> image display<strong>in</strong>g the number of photons as brightness <strong>and</strong> a fast /a slow ascolour.Multi Wavelength <strong>TCSPC</strong> Imag<strong>in</strong>gFor samples conta<strong>in</strong><strong>in</strong>g different chromophores the count<strong>in</strong>g efficiency <strong>and</strong> the amount of<strong>in</strong><strong>for</strong>mation <strong>in</strong> the data can be <strong>in</strong>creased by record<strong>in</strong>g the fluorescence <strong>in</strong> several wavelengthchannels simultaneously. Multi-wavelength imag<strong>in</strong>g has been successfully used to separate differentchromophores <strong>in</strong> stead-state images [13]. <strong>TCSPC</strong> detection of s<strong>in</strong>gle molecules <strong>in</strong> four wavelengthchannels considerably improves the selectivity <strong>for</strong> different molecules [17].<strong>TCSPC</strong> imag<strong>in</strong>g can be comb<strong>in</strong>ed with a multidetector technique [63,66,76,77] <strong>and</strong> be used torecord the photon density over time, wavelength <strong>and</strong> the coord<strong>in</strong>ates of the scann<strong>in</strong>g area [72]. Thepr<strong>in</strong>ciple of the multi-detector technique is shown <strong>in</strong> fig. 35.29
R5900L16Discrim<strong>in</strong>atorsEncoderDetectors Discrim<strong>in</strong>ators Encoder13 bitChannelNumber12122 bitChannelNumber16Don’tCount3 344Don’tCount’Photon PulseR3809UPhoton PulseInvert<strong>in</strong>g AmplifierSumm<strong>in</strong>g AmplifierFig. 35: Multi-detector technique <strong>for</strong> <strong>TCSPC</strong>. Left: Multichannel PMT, Right: Individual PMTsThe technique works both with a multichannel PMT [72a,77] <strong>and</strong> with several <strong>in</strong>dividual PMTs orMCPs [72b,66,76]. It makes use of the fact that the detection of several photons <strong>in</strong> different detectorchannels <strong>in</strong> one laser period is unlikely. There<strong>for</strong>e, the s<strong>in</strong>gle photon pulses from all detectorchannels can be comb<strong>in</strong>ed <strong>in</strong>to a common photon pulse l<strong>in</strong>e <strong>and</strong> send through the normal timemeasurement procedure of the <strong>TCSPC</strong> module. The output of each PMT channel is connected to adiscrim<strong>in</strong>ator. If the channel detects a photon the correspond<strong>in</strong>g discrim<strong>in</strong>ator responds <strong>and</strong> sends apulse to the subsequent encod<strong>in</strong>g logic. The encoder delivers the number of the PMT channel thatdetected the photon. The channel number is used as an additional dimension <strong>in</strong> the multidimensionalhistogramm<strong>in</strong>g process of the <strong>TCSPC</strong> imag<strong>in</strong>g technique.The record<strong>in</strong>g electronics <strong>for</strong> multi-wavelength <strong>TCSPC</strong> imag<strong>in</strong>g consists of a time measurementchannel, a scann<strong>in</strong>g <strong>in</strong>terface, a detector channel register, <strong>and</strong> a histogram memory (fig. 36).fromPolychromatorChannelDetectorTim<strong>in</strong>gStartStopfrom LaserChannel registerTimeMeasurementCFDTAC ADCCFDntChannel / WavelengthTime with<strong>in</strong> decay curveFrame SyncL<strong>in</strong>e SyncPixel ClockfromMicroscopeCounter YScann<strong>in</strong>gInterfaceCounter XyxHistogramMemoryDetectorchannel 1HistogramMemoryDetectorchannel ...Location with<strong>in</strong> scann<strong>in</strong>g areaHistogramMemoryDetectorchannel ...HistogramMemoryDetectorchannel 1630Fig. 36: Multi-wavelength <strong>TCSPC</strong> lifetime imag<strong>in</strong>gFor each photon, the time measurement channel determ<strong>in</strong>es the detection time (t) referred to thenext laser pulse. The scann<strong>in</strong>g <strong>in</strong>terface determ<strong>in</strong>es the current location (x <strong>and</strong> y) of the laser spot <strong>in</strong>the scann<strong>in</strong>g area. Synchronously with the detection of a photon, the detector channel number (n)<strong>for</strong> the current photon is read <strong>in</strong>to the detector channel register. If a polychromator is used <strong>in</strong> front ofthe detector, n represents the wavelength of the detected photon.The obta<strong>in</strong>ed values <strong>for</strong> t, x, y <strong>and</strong> n are then used to address the histogram memory. Thus, <strong>in</strong> thememory the distribution of the photons over time, wavelength, <strong>and</strong> the image coord<strong>in</strong>ates builds up.The result is a four-dimensional data array that can be <strong>in</strong>terpreted as a set of image stacks <strong>for</strong>
different wavelengths. Each stack conta<strong>in</strong>s a number of images <strong>for</strong> subsequent times after theexcitation pulse.Fig. 37 shows a HEK 293 cell express<strong>in</strong>g a hybrid prote<strong>in</strong> <strong>in</strong> which the cyan (CFP) <strong>and</strong> yellow(YFP) shifted mutants of the green fluorescent prote<strong>in</strong> are l<strong>in</strong>ked together by a short am<strong>in</strong>o acidcha<strong>in</strong>. The setup used <strong>for</strong> this measurement [72a] consisted of a laser scann<strong>in</strong>g microscope(LSM-510, Zeiss), a polychromator (250is, Chromex), <strong>and</strong> a 16 channel <strong>TCSPC</strong> detector head [77]connected to an SPC-730 <strong>TCSPC</strong> imag<strong>in</strong>g module [63]. The setup recorded the wavelength rangefrom 410 nm to 635 nm <strong>in</strong> 16 wavelength channels, cover<strong>in</strong>g the emission b<strong>and</strong>s of CFP <strong>and</strong> YFP.The image below was obta<strong>in</strong>ed by summ<strong>in</strong>g the photons from all time channels of the CFPfluorescence.CFPFig. 37: HEK 293 cell express<strong>in</strong>g a CFP-YFP hybrid prote<strong>in</strong>Left: Intensity image of CFP. Right: Fluorescence decay curves of CFP <strong>and</strong> YFP <strong>in</strong> a selected region (square).Fluorescence decay analysis <strong>in</strong> a selected region (small square) reveals a double-exponential decayboth <strong>for</strong> CFP <strong>and</strong> YFP. The <strong>in</strong>tensity coefficient of the fast component is positive <strong>for</strong> CFP <strong>and</strong>negative <strong>for</strong> YFP, <strong>in</strong>dicat<strong>in</strong>g that energy is transferred from CFP to YFP. In Fig. 38 the <strong>in</strong>tensity isrepresented by the brightness, the ratio of the coefficients by the colour of a pixel. The results areshown <strong>for</strong> the CFP <strong>and</strong> the YFP fluorescence.CFPYFP0.400.80-0.65 -0.15Fig. 38: <strong>FRET</strong> images <strong>for</strong> CFP (left) <strong>and</strong> YFP (right) of a HEK cell express<strong>in</strong>g a hybrid prote<strong>in</strong> <strong>in</strong> which CFP <strong>and</strong> YFP are l<strong>in</strong>kedtogether by a short peptide. The brightness represents the <strong>in</strong>tensity, the colour the ratio of the amplitudes of the fast <strong>and</strong> slow decaycomponents. From [72a]31
Features of the <strong>TCSPC</strong> imag<strong>in</strong>g techniquesIt should be po<strong>in</strong>ted out that neither s<strong>in</strong>gle wavelength nor multi-wavelength <strong>TCSPC</strong> imag<strong>in</strong>g useany time gat<strong>in</strong>g or wavelength scann<strong>in</strong>g. There<strong>for</strong>e, both techniques yield a near-perfect count<strong>in</strong>gefficiency <strong>and</strong> a maximum signal to noise ratio <strong>for</strong> a given acquisition time. Due to the short deadtime of the <strong>TCSPC</strong> imag<strong>in</strong>g electronics (125 to 180 ns ) [63] there is almost no loss of photons <strong>for</strong>count rates up to a few 10 5 /s as they are typical <strong>for</strong> cell imag<strong>in</strong>g.The time resolution of the <strong>TCSPC</strong> techniques is given by the transit time spread <strong>in</strong> the detector. Asystem response of only 25 ps FWHM is achieved with MCP PMTs. In conjunction with am<strong>in</strong>imum time channel width of the <strong>TCSPC</strong> modules of less than 820 fs [63] lifetimes down to afew ps can be measured.No special vacuum devices as <strong>for</strong> the image <strong>in</strong>tensifier technique are required. The methodimmediately benefits from new detector developments, e.g. ultra-fast MCP PMTs or new highefficiency cathode materials.Implement<strong>in</strong>g <strong>TCSPC</strong> imag<strong>in</strong>g <strong>in</strong>to a laser scann<strong>in</strong>g microscope requires no more changes thanattach<strong>in</strong>g a fast detector to the microscope. In most microscopes this is possible either via a fibreoutput or via the non-descanned port.<strong>TCSPC</strong> imag<strong>in</strong>g works at the full scan rate of the laser microscope, i.e. with pixel dwell times o<strong>for</strong>der of 1 µs. Due to the synchronisation via the scan control pulses the zoom <strong>and</strong> image rotationfunctions of the microscope can be used also <strong>for</strong> lifetime imag<strong>in</strong>g.Currently available <strong>TCSPC</strong> imag<strong>in</strong>g devices have a limited memory space. There<strong>for</strong>e, a tradeoffbetween the number of pixels, the number of time channels <strong>and</strong> the number of detector channels hasto be made. However, with the <strong>in</strong>troduction of the SPC-830 module of bh memory space is notlonger a severe constra<strong>in</strong>t. Some comb<strong>in</strong>ations of image size, <strong>and</strong> number of time <strong>and</strong> wavelengthchannels <strong>for</strong> the SPC-830 are given <strong>in</strong> the table below [63].32Detector Channels Resolution x,y Time Channels M<strong>in</strong>. Time Channel Width (ps)1 2048 x 2048 4 501 1024 x 1024 16 12.51 512 x 512 64 3.1251 256 x 256 256 0.81 128 x 128 1024 0.84 1024 x 1024 4 504 512 x 512 16 12.54 256 x 256 64 3.1254 128 x 128 256 0.816 512 x 512 4 5016 256 x 256 16 12.516 128 x 128 64 3.12516 64 x 64 256 0.8Parallel operation of two modules connected to the same detector can be used to simultaneouslyobta<strong>in</strong> images with high pixels resolution <strong>and</strong> moderate time resolution <strong>and</strong> images with moderatepixel resolution <strong>and</strong> high time resolution. Although no such system has become known yet theimplementation with current <strong>TCSPC</strong> modules is straight<strong>for</strong>ward.The maximum photon count rate of the <strong>TCSPC</strong> technique is limited by the time required to measurethe time of a detected photon <strong>and</strong> to store it <strong>in</strong> the histogram memory. This ‘dead time’ is of theorder of 125 to 180 ns <strong>for</strong> state-of-the art devices. Becker & Hickl def<strong>in</strong>e a ‘maximum useful countrate’ which means the recorded photon rate at which 50% of the photons are lost <strong>in</strong> the deadtime [63]. Maximum useful count rates are <strong>in</strong> the range of 3 to 4 MHz. The count<strong>in</strong>g efficiency <strong>and</strong>
the ‘figure of merit’ [39] as a function of the detector count rate <strong>for</strong> different techniques are shown<strong>in</strong> fig. 38. The values <strong>for</strong> the image <strong>in</strong>tensifiers <strong>and</strong> s<strong>in</strong>gle channel nmodulation techniques weretaken from [39], the value <strong>for</strong> multi-gate photon count<strong>in</strong>g from [81].1Efficiency0.8<strong>TCSPC</strong>, 1 ChannelModulation<strong>TCSPC</strong>, 4 Channels4FFigureof Merit3.43.2Image IntensifiersModulation0.632.80.4Multi Gate SPC2.62.42.220.21.81.6Multi Gate SPC<strong>TCSPC</strong>, 4 Channels010 kHzModulationImage Intensifiers100 kHz1 MHz10 MHzDetector Count Rate1.41.2110 kHzModulation100 kHz<strong>TCSPC</strong>, 1 Channel1 MHz10 MHzDetector Count RateFig. 38: Count<strong>in</strong>g efficiency <strong>and</strong> figure of merit F of <strong>TCSPC</strong> imag<strong>in</strong>g compared to other techniquesF is the ratio of theoretical SNR to obta<strong>in</strong>ed SNR, F=1 means ideal SNRSurpris<strong>in</strong>gly, <strong>TCSPC</strong> imag<strong>in</strong>g beats the other methods even <strong>for</strong> detector count rates of the order of 5to 10 MHz.It is unlikely that such high count rates can be obta<strong>in</strong>ed from liv<strong>in</strong>g cells. Anyway, a count rateabove 5 MHz imposes overload problems to most detectors. Although traditional PMTs still work at10 MHz the tim<strong>in</strong>g per<strong>for</strong>mance may not longer meet the high st<strong>and</strong>ard of the <strong>TCSPC</strong> method.MCP PMTs, i.e. the fastest detectors <strong>for</strong> <strong>TCSPC</strong>, are clearly overloaded above 1 MHz. If a system isto be operated at extremely high count rates the solution is the multidetector technique. If the lightis split <strong>in</strong>to several detection channels the load <strong>for</strong> the <strong>in</strong>dividual detectors is reduced.Another solution is to operate several <strong>TCSPC</strong> modules with <strong>in</strong>dividual detectors <strong>in</strong> parallel.Although no such application has become known yet the implementation is straight<strong>for</strong>ward. TheBecker & Hickl <strong>TCSPC</strong>s are designed to work <strong>in</strong> packages of up to four devices [63].The acquisition time <strong>for</strong> <strong>TCSPC</strong> lifetime measurements can vary <strong>in</strong> a wide range. In vivo lifetimemeasurements at the human ocular fundus <strong>in</strong> conjunction with an ophthalmologic scanner delivereds<strong>in</strong>gle exponential lifetimes <strong>for</strong> an array of 128x128 pixels with<strong>in</strong> a few seconds [75, 75b]. On theother h<strong>and</strong>, <strong>for</strong> the double exponential decay data of <strong>FRET</strong> measurements acquisition times from 5to 30 m<strong>in</strong>utes were used [68].In practice the acquisition time depends on the required lifetime accuracy, on the number oflifetime components to be resolved, on the number of pixels <strong>and</strong> wavelength channels <strong>and</strong> on thecount rate that can be obta<strong>in</strong>ed from the sample without photobleach<strong>in</strong>g or photodamage. Fig. 39shows the acquisition time as a function of the product of the number of pixels <strong>and</strong> the number ofwavelength channels. The left diagram is <strong>for</strong> a high count rate of 10 6 /s. Count rates of this order canbe obta<strong>in</strong>ed by one-photon excitation from cells conta<strong>in</strong><strong>in</strong>g high chromophore concentrations. Fortwo-photon excitation a count rate of 10 6 /s requires extremely stable samples sta<strong>in</strong>ed with veryefficient chromophores.The right diagram is <strong>for</strong> a very low count rate of 10 4 /s. Count rates of this order are typical <strong>for</strong>autofluorescence of cells <strong>and</strong> tissue <strong>and</strong> <strong>for</strong> samples with low photostability. An HEK cell33
conta<strong>in</strong><strong>in</strong>g CFP <strong>and</strong> YFP measured by two-photon excitation with 150 fs pulses at 820 nm [68]delivered only 10 4 photons/s. Nevertheless, it photobleached to 50% <strong>in</strong>tensity with<strong>in</strong> 10 m<strong>in</strong>utes.10000sAcquisitionTime1000s100sCount Rate10 6/s100,00010,00010000sAcquisitionTime1000s100sCount Rate104/s100,00010,000100010s100010s1001s100ms10ms100Photons/Pixel1s100ms10msPhotons/Pixel1ms1ms0.1ms1 10 100 1000 10,000 100,000Pixels x Wavelength Channels0.1ms1 10 100 1000 10,000 100,000Pixels x Wavelength ChannelsFig. 39: Acquisition times <strong>for</strong> a count rate of 10 6 /s (left) <strong>and</strong> 10 4 /s (right) <strong>for</strong> different numbers of photons per pixel.Photons per pixel range from 100 <strong>for</strong> rough s<strong>in</strong>gle exponential decay mapp<strong>in</strong>g to 10 5 <strong>for</strong> precision double exponentialdecay analysis.Fig. 39 shows that relatively long acquisition times must be expected, particularly <strong>for</strong> large numbersof pixels <strong>and</strong> precision measurements of samples at a low count rate. However, it should be po<strong>in</strong>tedout that long acquisition times are not a special feature of <strong>TCSPC</strong> imag<strong>in</strong>g - they simply result fromthe fact that much more photons per pixel are required to determ<strong>in</strong>e the lifetime than to record the<strong>in</strong>tensity.Shorter acquisition times can be achieved if the scann<strong>in</strong>g area is conf<strong>in</strong>ed to a few pixels or onlyone pixel is measured. For s<strong>in</strong>gle pixels the acquisition time can be <strong>in</strong> the ms or sub-ms range. Thatmakes it possible to <strong>in</strong>vestigate diffusion processes by monitor<strong>in</strong>g the lifetime change <strong>in</strong> a s<strong>in</strong>glepixel. Even fast <strong>FRET</strong> measurements appear feasible. <strong>FRET</strong> requires to resolve the components of adouble exponential decay function. This requires about 10,000 photons which can be obta<strong>in</strong>ed <strong>in</strong>10 ms.Even if the emission <strong>in</strong>tensity of biological samples is limited there is probably still some potentialto <strong>in</strong>crease the count rate by improv<strong>in</strong>g the detection efficiency. The transmission b<strong>and</strong> of filtersused to select the emission from a particular chromophore are often narrower than the emissionb<strong>and</strong>. Optimis<strong>in</strong>g the filters can easily yield a factor of two <strong>in</strong> sensitivity. Moreover, <strong>in</strong> a normalmicroscope the photons are collected from one side of the sample only. The 4Pi technique [37]collects the fluorescence from both sides <strong>and</strong> there<strong>for</strong>e gives a factor of two improvement <strong>in</strong>collection efficiency.In cases where the full diffraction-limited resolution of the objective is not required the count ratecan probably be <strong>in</strong>creased by <strong>in</strong>creas<strong>in</strong>g the excited sample volume. Photobleach<strong>in</strong>g is reported tobe highly nonl<strong>in</strong>ear, there<strong>for</strong>e the larger volume allows to use more excitation power <strong>and</strong>consequently to get more photons [43,45]. By <strong>in</strong>troduc<strong>in</strong>g def<strong>in</strong>ed distortions <strong>in</strong>to the wavefront ofthe excitation path or by under-illum<strong>in</strong>at<strong>in</strong>g the aperture of the objective the excited volume can be<strong>in</strong>creased without impair<strong>in</strong>g the photon collection efficiency.Recently new photomultiplier cathodes with a 3-fold improved sensitivity compared to traditionalbialkali <strong>and</strong> multialkali cathodes became available. Fast PMTs <strong>and</strong> MCPs with the new cathodeshave an IRF width of 300 ps <strong>and</strong> 100 ps respectively [59,60].34
Other <strong>TCSPC</strong> TechniquesApplication of <strong>TCSPC</strong> to diffusion <strong>in</strong> cellsDiffusion constants <strong>in</strong> cells are usually determ<strong>in</strong>ed byfluorescence correlation (FCS) techniques. Record<strong>in</strong>gan FCS function requires to detect the fluorescence<strong>in</strong>tensity <strong>in</strong> a fixed spot of the sample <strong>and</strong> to calculatethe autocorrelation function of the <strong>in</strong>tensity or of thephoton detection times [14,15,16]. Although FCS isnot an imag<strong>in</strong>g technique it is often used <strong>in</strong>comb<strong>in</strong>ation with imag<strong>in</strong>g to def<strong>in</strong>e the location <strong>in</strong> acell where an FCS measurement has to be run.Generally, the <strong>TCSPC</strong> technique is not only able torecord time-resolved images <strong>in</strong> laser scann<strong>in</strong>gmicroscopes, but also to recorded FCS data. An FCSmeasurement can even be comb<strong>in</strong>ed with a s<strong>in</strong>glepo<strong>in</strong>t lifetime measurement. The multi-detectortechnique described above <strong>for</strong> <strong>TCSPC</strong> imag<strong>in</strong>g is alsoavailable <strong>for</strong> FCS measurements. With the<strong>in</strong>troduction of the SPC-830 it is not longer necessaryto use <strong>in</strong>dependent modules <strong>for</strong> imag<strong>in</strong>g <strong>and</strong> FCS. TheSPC-830 works <strong>for</strong> imag<strong>in</strong>g <strong>and</strong> FCS record<strong>in</strong>g aswell.FCS data record<strong>in</strong>g does not build up histograms asthe <strong>TCSPC</strong> imag<strong>in</strong>g techniques do. Instead, it recordsthe full <strong>in</strong><strong>for</strong>mation about each photon. Each entryconta<strong>in</strong>s the time of the photon <strong>in</strong> the laser pulseps time from TAC / ADCmicro timeresolution 25 pssequence, the time from the start of the experiment, <strong>and</strong> the detector channel. The data structure isshown <strong>in</strong> Fig. 40. For each detector an <strong>in</strong>dividual correlation spectrum <strong>and</strong> a fluorescence decaycurve can be calculated. An <strong>in</strong>strument like this was used to detect <strong>and</strong> identify s<strong>in</strong>gle molecules ona substrate. By us<strong>in</strong>g four wavelength channels <strong>and</strong> a piezo scann<strong>in</strong>g stage different molecules couldbe identified <strong>in</strong> a time of the order of 1 ms [17]. Moreover, data from different detectors can becross-correlated. By detect<strong>in</strong>g different chromophores <strong>in</strong> different wavelength <strong>in</strong>tervals crosscorrelationcan show whether the molecules of both chromophores <strong>and</strong> the associated prote<strong>in</strong>structures are l<strong>in</strong>ked or diffuse <strong>in</strong>dependently.LaserFIFOBufferPhotonHistogram ofmicro timemicro timemicro time...micro timemicro timepicosecondsLaserFluorescencedecaycurvesDetectorChannelDet. NoDet. NoDet. NoDet. NoReadoutHard disktime from start of experimentStartofexperiment Photonsmacro timeresolution 50 nsmacro timemacro time...macro timemacro timeAutocorrelation ofmacro timens to secondsFluorescencecorrelationspectraFig. 40: Comb<strong>in</strong>ed liftime / FCS data acquisition by<strong>TCSPC</strong><strong>TCSPC</strong> Wide Field Imag<strong>in</strong>g<strong>TCSPC</strong> can be used <strong>for</strong> wide field imag<strong>in</strong>g if a special detector is used. The detector consists of theusual photocathode, a microchannel plate <strong>and</strong> a delay l<strong>in</strong>e system or a four-element anode system atthe output. By measur<strong>in</strong>g the delay of the output pulses at the ends of the delay l<strong>in</strong>es or the chargedistribution at the four anode sectors the location of a photon can be determ<strong>in</strong>ed, see fig. 41.35
CathodeCathodeMultichannelPlateMultichannelPlateA2 A1 A2A1Delay L<strong>in</strong>e AnodeA3Quadrant AnodeA4Fig 41 : Wide field detectors <strong>for</strong> <strong>TCSPC</strong>Wide-field <strong>TCSPC</strong> imag<strong>in</strong>g requires several <strong>TCSPC</strong> channels or one <strong>TCSPC</strong> channel with four lownoise charge detection channels. The technique features high count<strong>in</strong>g efficiency <strong>and</strong> relatively goodtime resolution. Because additional signal process<strong>in</strong>g is needed to obta<strong>in</strong> the position of a photon itis difficult to reach high count rates. The most severe drawback is that the technique depends oncomplex detectors that are not commonly available.Comparison of Signal Process<strong>in</strong>g TechniquesA comparison of the different lifetime techniques is given below.The figure of merit, F, was taken from [39]. Small F values <strong>in</strong>dicate high efficiency. For multiwavelengthtechniques it was assumed that two chromophores are measured which giveapproximately the same count rates. There<strong>for</strong>e, the efficiency, E, <strong>in</strong>creases by a factor of 2 <strong>and</strong> F isreduced by a factor of 1.4. The result<strong>in</strong>g F can be smaller <strong>and</strong> E greater than one because the valuesare referred to a s<strong>in</strong>gle detector measurement with ideal SNR.For the time resolution of the gated image <strong>in</strong>tensifier <strong>and</strong> the <strong>TCSPC</strong> technique it was assumed thatlifetimes down to 1/10 of the <strong>in</strong>strument response width can be de-convoluted, which is certa<strong>in</strong>ly aconservative assumption. The resolutions given <strong>for</strong> the modulation techniques are the practicallyobta<strong>in</strong>ed values from [19, 21,52-54]. The applicability to multi-exponential decay functions is moreor less theoretical. Resolution of double exponential decay functions <strong>in</strong> <strong>FRET</strong> systems has beenproved <strong>for</strong> <strong>TCSPC</strong> only.The maximum count rate of the <strong>TCSPC</strong> method was def<strong>in</strong>ed as the rate at which the count<strong>in</strong>gefficiency drops to 50%. There<strong>for</strong>e, the values are smaller that the reciprocal dead time.36
Technique F E Reso- Count Multi- Fast Con- RemarkFigure Effi- lution Rate Epon. Scan focalof Merit ciency ps MHz DecayGated Image Intensifier 200ps 4 0.057 20 unlim. yes yes no applicable <strong>for</strong>wide fieldS<strong>in</strong>gle Channel mod. S<strong>in</strong>ewave 3.7 0.07 300 unlim. yes no yes slow scan onlyTechnique Dirac 1.1 0.95 300 unlim. yes no yesModulated Image S<strong>in</strong>ewave 10 0.01 300 unlim. yes yes no applicable <strong>for</strong>Intensifier Dirac 4.3 0.054 300 unlim. yes yes no wide fieldMulti-Gate SPC 2 Gates 1.5-2.1 0.7-0.8 100 30 no no yes8 Gates 1.1-1.5 0.8-0.95 1 because 2 chromophores are detected simultaneously <strong>and</strong> the system is compared with a s<strong>in</strong>glechannel detect<strong>in</strong>g only 1 chromophoreSummaryA wide variety of lifetime imag<strong>in</strong>g techniques <strong>for</strong> time-resolved microscopy is available - gated <strong>and</strong>modulated image <strong>in</strong>tensifiers, s<strong>in</strong>gle channel modulation techniques <strong>and</strong> gated <strong>and</strong> time-correlateds<strong>in</strong>gle photon count<strong>in</strong>g. At the same time two generally different microscopy techniques exist - thewide field microscope <strong>and</strong> the confocal or two-photon laser scann<strong>in</strong>g microscope.For wide field microscopy the gated <strong>and</strong> modulated image <strong>in</strong>tensifiers <strong>and</strong> can be used. Wide-fieldlifetime systems do not have the <strong>in</strong>tr<strong>in</strong>sic depth resolution <strong>and</strong> optical section<strong>in</strong>g capability of theconfocal <strong>and</strong> two-photon scann<strong>in</strong>g systems.For laser scann<strong>in</strong>g microscopes the best results are achieved with multi-gate photon count<strong>in</strong>g <strong>and</strong>with the <strong>TCSPC</strong> imag<strong>in</strong>g technique. Multi-gate photon count<strong>in</strong>g can be used up to very high countrates <strong>and</strong> efficiently detects s<strong>in</strong>gle exponential lifetimes down to a few 100ps. It does, however, notreach the efficiency <strong>and</strong> the time-resolution of <strong>TCSPC</strong>. It is not clear how far the high count rate ofthe technique can be practically exploited because photobleach<strong>in</strong>g sets a limit to the fluorescence<strong>in</strong>tensity obta<strong>in</strong>ed from the excited sample volume.<strong>TCSPC</strong> is able to detect lifetimes down to a few ps <strong>and</strong> is able to resolve the components of multiexponentialdecay functions. It has a near-ideal efficiency <strong>and</strong> is able to detect <strong>in</strong> several wavelength<strong>in</strong>tervals simultaneously. Moreover, the <strong>TCSPC</strong> technique can be used to obta<strong>in</strong> comb<strong>in</strong>ed37
FCS / lifetime data <strong>in</strong> selected spots of a sample. <strong>TCSPC</strong> imag<strong>in</strong>g works at an extremely highscann<strong>in</strong>g speed <strong>and</strong> is there<strong>for</strong>e compatible to almost any laser microscope.Among all methods <strong>TCSPC</strong> imag<strong>in</strong>g with confocal or two-photon microscopes scann<strong>in</strong>gmicroscopes is most suitable to meet the requirements of cell imag<strong>in</strong>g - optical section<strong>in</strong>g, multiwavelengthrecord<strong>in</strong>g, high detection efficiency, high time resolution, resolution of multiexponentialdecay functions, <strong>and</strong> applicability of FCS techniques.References[1] M. M<strong>in</strong>sky : Memoir on <strong>in</strong>vent<strong>in</strong>g the confocal microscope. Scann<strong>in</strong>g 10, 128-138 (1988).[2] J.G. White, W.B. Amos, M. Fordham : An evaluation of confocal versus conventional imag<strong>in</strong>g of biologicalstructures by fluorescence light microscopy. J. Cell Biol. 105, 41-48 (1987).[3] W. Denk, J.H. Strickler, W.W. Webb, Two-photon laser scann<strong>in</strong>g fluorescence microscopy. Science 24 (1990) 73-76[4] A. Periasami, M. Elangovan, H. Wallrabe, J.N. Demas, M. Barroso, D.L. Brautigan, R.N. Day, Methods <strong>in</strong> cellularimag<strong>in</strong>g (ed. by A. Periasamy), 295-308, Ox<strong>for</strong>d University Press, New York[5] B. Herman, Fluorescence Microscopy, 2nd. edn. Spr<strong>in</strong>ger-Verlag, New York 1998[6] J.R. Lakowicz, Pr<strong>in</strong>ciples of Fluorescence Spectroscopy, 2nd. Ed., Plenum Press, New York 1999[7] A. Periasami, R.N. Day, Visualiz<strong>in</strong>g prote<strong>in</strong> <strong>in</strong>teractions <strong>in</strong> liv<strong>in</strong>g cells us<strong>in</strong>g digitized BFG imag<strong>in</strong>g <strong>and</strong> <strong>FRET</strong>microscopy, <strong>in</strong>: Green Fluorescent Prote<strong>in</strong>s, ed. by K.F. Sullivan, S.A Key, Academic Press, 1999[8] M. Elangovan, R.N. Day, A. Periasami, Nanosecond fluorescence resonance energy transfer-fluorescence lifetimeimag<strong>in</strong>g microscopy to localize the prote<strong>in</strong> <strong>in</strong>teractions <strong>in</strong> a s<strong>in</strong>gle cell. J. Microsc. 205 (2002) 3-14[9 ] W.R.G. Baeyens, D. de Keukeleire, K. Korkidis, Lum<strong>in</strong>escence techniques <strong>in</strong> chemical <strong>and</strong> biochemical analysis,M. Dekker, New York, 1991[10] M.R. Eft<strong>in</strong>k, Fluorescence quench<strong>in</strong>g: Theory <strong>and</strong> application, <strong>in</strong>: J.R. Lakowicz, Topics <strong>in</strong> fluorescencespectrocopy, Vol. 2 (1991) 53-126[11] M.A.M.J. van Z<strong>and</strong>voort, W. Engels, C.J. de Grauw, H.C. Gerritsen, D.W. Slaaf, Lifetime imag<strong>in</strong>g of the vitalDNA/RNA probe SYTO13 <strong>in</strong> helthy <strong>and</strong> apoptitic cells. Proc. SPIE 4626-83 (2002)[11a] Van Z<strong>and</strong>voort, M.A.M.J., de Grauw, C.J., Gerritsen, H.C., Broers, J.L.V., Egbr<strong>in</strong>k, M.G.A. Ramaekers, F.C.S.,Slaaf, D.W. Discrim<strong>in</strong>ation of DNA <strong>and</strong> RNA <strong>in</strong> cells by a vital fluorescent probe: Lifetime imag<strong>in</strong>g of SYTO13 <strong>in</strong>healthy <strong>and</strong> apoptotic cells. Cytometry 47 (2002) 226-223[11b] Gerritsen, H.C., S<strong>and</strong>ers, R., Draaijer, A., Lev<strong>in</strong>e, Y.K. Fluorescence lifetime imag<strong>in</strong>g of oxygen <strong>in</strong> cells. J.Fluoresc. 7 (1997) 11-16[12] Jens-Peter Knemeyer, Nicole Marmé, Markus Sauer, Probes <strong>for</strong> detection of specific DNA sequences at the s<strong>in</strong>glemolecule level. Anal. Chem. 72 (2000) 3717-3724[13] M. E. Dick<strong>in</strong>son, C.W. Waters, G. Bearman, R. Wolleschensky, S. Tille, S.E. Fraser, Sensitive imag<strong>in</strong>g ofspectrally overlapp<strong>in</strong>g fluorochromes us<strong>in</strong>g the LSM 510 Meta. Proc. SPIE 4620 (2002)[14] Thomson, N,L., Fluorescence Correlation Spectrocopy. Topics <strong>in</strong> Fluorescence Spectroscopy, Vol. 1, ed. by J.R.Lakowicz, 337-378. Plenum Press, New York, 1991[15] K.M. Berl<strong>and</strong>, P.T.C. So, E. Gratton, Two-photon fluorescence correlation spectroscopy: Method <strong>and</strong> applicationto the <strong>in</strong>tracellular environment. Biophys. J. 88 (1995) 694-701[16] P. Schwille, S. Kummer, A.H. Heikal, W.E. Moerner, W.W. Webb, Fluorescence correlation spectroscopy revealsfast optical excitation-driven <strong>in</strong>tramolecular dynamics of yellow fluorescent prote<strong>in</strong>s. PNAS 97 (2000) 151-156[17] Michael Prummer, Christian Hübner, Beate Sick, Bert Hecht, Alois Renn, Urs P. Wild, S<strong>in</strong>gle-MoleculeIdentification by Spectrally <strong>and</strong> Time-Resolved Fluorescence Detection. Anal. Chem. 2000, 72, 433-447[18] J. Schaffer, A. Volkmer, C. Eggel<strong>in</strong>g, V. Subramaniam, C. A. M. Seidel, Identification of s<strong>in</strong>gle molecules <strong>in</strong>aqueous solution by time-resolved anisotropy. Journal of Physical Chemistry A, 103 (1999) 331-33538
[19] P.T.C. So, T. French, E. Gratton, A frequency doma<strong>in</strong> microscope us<strong>in</strong>g a fast-scan CCD camera. Proc. SPIE 2137(1994) 83-92[20] M. Straub, S. W. Hell, Fluorescence lifetime three-dimensional microscopy with picosecond precision us<strong>in</strong>g amultifocal multiphoton mocroscope. Appl. Phys. Lett. 73 (1998) 1769-1771[21] A. Squire, P.J. Verveer, P.I.H. Bastiaens: Multiple frequency fluorescence lifetime imag<strong>in</strong>g microscopy. J.Microsc. 197, 136-149 (2000).[22] M.A. Neil, A. Squire, R. Juskaitas, P.I. Bastiaens, T. Wilson, Wide-field fluorescence microscopy with laserillum<strong>in</strong>ation. J. Microsc. 197 (2000) 1-4[23] M.J. Cole, J.Siegel, R. Dowl<strong>in</strong>g, M.J. Dayel, D. Parsons-Karavassilis, P.M. French, M.J. Lever, L.O. Sucharov,M.A. Neil, R. Juskaitas, T. Wilson, Time-doma<strong>in</strong> whole-field lifetime imag<strong>in</strong>g with optical section<strong>in</strong>g. J. Microsc.203 (2001) 246-257[24] Betzig, E., Trautmann, J.K., Near-field optics: Microscopy, spectroscopy <strong>and</strong> surface modification beyond thediffraction limit. Science 257, 189-195[25] Betzig, E., Trautmann, J.K.,Harris, T.D., We<strong>in</strong>er, J.S., Kostelak, R.L., Break<strong>in</strong>g the diffraction barrier: Opticalmicroscopy on a nanometric scale. Science 251 (1991) 1468-1470[26] Dunn, R.C. Near-field scann<strong>in</strong>g optical microscopy. Chem. Rev. 99 (1999) 2891-2928[27] Hollars, C.W., Dunn, R.C., Submicron fluorescence, topology, <strong>and</strong> compliance measurements of phase-separatedlipid monolayers us<strong>in</strong>g tapp<strong>in</strong>g-mode near-fiel scann<strong>in</strong>g optical microscopy. J. Phys. Chem. B. 101, 6313-6317[28] Kirsch, A.K., Subramaniam, V., Jenei, A., Jov<strong>in</strong>, T.M., Fluorescence Resonance transfer detected by scann<strong>in</strong>g nearfieldoptical microscopy. J. Microsc. 194 (1999) 448-454[29] Femtolight series fiber lasers, IMRA America Inc., www.imra.com[30] Pulsed diode lasers, PicoQuant GmbH, www.picoquant.com[31] BDL-450 picosecond diode laser. www.becker-hickl.com[32] BHL-250 pulsed diode lasers. www.becker-hickl.com[33] M. Kress, Th. Meier, T. A. A. El-Tayeb, R. Kemkemer, R. Ste<strong>in</strong>er, A. Rück, Short-pulsed diode lasers as anexcitation source <strong>for</strong> time-resolved fluorescence applications <strong>and</strong> confocal laser scann<strong>in</strong>g microscopy <strong>in</strong> PDT, Proc.SPIE 4431(2001)[33a] A. Rück, F. Dolp, C. Happ, R. Ste<strong>in</strong>er, M. Beil, Fluorescence lifetime imag<strong>in</strong>g (<strong>FLIM</strong>) us<strong>in</strong>g ps pulsed diodelasers <strong>in</strong> laser scann<strong>in</strong>g microscopy. Proc. SPIE 4962-44 (2003)[34] Hidehiro Kume (Chief Editor), Photomultiplier Tube, Hamamatsu Photonics K.K., 1994[35] SPCM-AQR series. www.perk<strong>in</strong>elmer.com/opto[36] S. Cova, S. Lacaiti, M.Ghioni, G. Ripamonti, T.A. Louis, 20-ps tim<strong>in</strong>g resolution with s<strong>in</strong>gle-photon avalanchephotodiodes, Rev. Sci. Instrum. 60, 1989, 1104-1110[37] M. Nagorni, S. W. Hell, 4Pi-confocal microscopy provides three-dimensional images of the microtubule networkwith 100- to 150-nm resolution. J. of Structural Biology 123 (1998) 236-247[38] Ballew, R.M., Demas, J.N., An error analysis of the rapid lifeetime determ<strong>in</strong>ation method <strong>for</strong> the evaluation ofs<strong>in</strong>gle exponential decays. Anal. Chem. 61 (1989) 30-33[39] K. Carlsson, J.P. Philip, Theoretical Investigation of the Signal-to-Noise ratio <strong>for</strong> different fluorescence lifetimeimag<strong>in</strong>g techniques. Proc. SPIE 4622-08 (2002)[40] J. Widengreen, R. Rigler, Mechanisms of photobleach<strong>in</strong>g <strong>in</strong>vestigated by fluorescence correlation spectroscopy.Bioimag<strong>in</strong>g 4 (1996) 149-157[41] A.A. Heikal, W.W. Webb, One- <strong>and</strong> two-photon time-resolved fluorescence spectroscopy of selected fluorescentmarkers: photobleach<strong>in</strong>g, triple-, <strong>and</strong> s<strong>in</strong>glet-state dynamics. Biophys. J. 73 (1999) 260[42 E.J. Sánchez, L. Novotny, G.R. Holtom, X.S. Xie. Room-Temperature fluorescence imag<strong>in</strong>g <strong>and</strong> spectroscopy ofs<strong>in</strong>gle molecules by two-photon fluorescence. J. Phys. Chem. A 101 (1997) 7019-7023[43] G.H. Patterson, D.W. Piston, Photobleach<strong>in</strong>g <strong>in</strong> two-photon exciatation microscopy. Biophys. J. 78 (2000) 2159-216239
[44]G. J. Brakenhoff, M. Müller, R.I. Grauharali, Analysis of efficiency of two-photon versus s<strong>in</strong>gle-photon absorption<strong>for</strong> fluorescence generation <strong>in</strong> biological objects. J. Microsc. 183 (1996) 140-144[45] Hopf, A., Neher, E., Highly nonl<strong>in</strong>ear Photodamage on two-photon fluorescence microscopy. Biophysical Journal80 (1002) 2029-2036[46] K. König, P.T.C. So, W.W. Mantul<strong>in</strong>, B.J. Tromberg, E. Gratton, Two-Photon excited lifetime imag<strong>in</strong>g ofautofluorescence <strong>in</strong> cells dur<strong>in</strong>g UVA <strong>and</strong> NIR photostress. J. Microsc. 183, 197-204[47] K. Koenig, T.W. Becker, P. Fischer, I. Riemann, K.-J. Halbhuber, Pulse-length dependence of cellular response to<strong>in</strong>tense near-<strong>in</strong>frared pulses <strong>in</strong> multiphoton microscopes. Opt. Lett. 24 (1999) 113-115[48] J. Bewesdorf, R. Pick, S. W. Hell, Multifocal multiphoton microscopy. Opt. Lett. 23 (1998) 655-657[49] A.H. Buist, M. Müller, J. Squier, G.J. Brakenhoff, Real time two-photon absorption microscopy us<strong>in</strong>g multi-po<strong>in</strong>texcitation. Journal of Microscopy 192 (1998) 21767-226[50] P. Urayama, J.A. Beamish, F.K. M<strong>in</strong>n, E.A. Hamon, M.-A. Mycek, A UV fluorescence lifetime imag<strong>in</strong>gmicroscope to probe endogenous cellular fluorescence. CLEO 2002, Technical Digest, CTh062[51] Pico Star Camera, www.lavision.com[52] K. Carlsson, A. Liljeborg, Simultaneous confocal lifetime imag<strong>in</strong>g of multiple fluorophores us<strong>in</strong>g the <strong>in</strong>tensitymodulatedmultiple-wavelength scann<strong>in</strong>g (IMS) technique. J. Microsc. 191 (1998) 119-127[53] K. Carlsson, A. Liljeborg, Confocal fluorescence microscopy us<strong>in</strong>g spectral <strong>and</strong> lifetime <strong>in</strong><strong>for</strong>mation tosimultaneaously record four fluorophores with high channel separation. J. Microsc. 185 (1997) 37-46[54] P.T.C. So, T. French, W.M. Yu, K.M. Berl<strong>and</strong>, C.Y. Dong, E. Gratton, Time-resolved fluorescence microscopyus<strong>in</strong>g two-photon excitation. Bioimag<strong>in</strong>g 3 (1995) 49-63[55] P.T.C. So, T. French, E. Gratton, A frequency doma<strong>in</strong> microscope us<strong>in</strong>g a fast-scan CCD camera. Proc. SPIE 2137(1994) 83-92[56] A. Squire, P.J. Verveer, P.I.H. Bastiens: Multiple frequency fluorescence lifetime imag<strong>in</strong>g microscopy. J. Microsc.197, 136-149 (2000).[57] E.P. Buurman, R. S<strong>and</strong>ers, A. Draaijer, H.C. Gerritsen, J.J.F. van Veen, P.M. Houpt, Y.K. Lev<strong>in</strong>e, Fluorescencelifetime imag<strong>in</strong>g us<strong>in</strong>g a confocal laser scann<strong>in</strong>g microscope. Scann<strong>in</strong>g 14, 155-159 (1992).[58] J. Sytsma, J.M. Vroom, C.J. de Grauw, H.C. Gerritsen, Time-gated fluorescence lifetime imag<strong>in</strong>g <strong>and</strong> microvolumespectroscopy us<strong>in</strong>g two-photon excitation. Journal of Microscopy, 191 (1998) 39-51[59] H7422 data sheet, Hamamatsu Photonics, www hamamatsu.com[60] R3809U data sheet, Hamamatsu Photonics, www hamamatsu.com[61] Scully, A.D., Ostler, R.B., Phillips, D., O’Neill, P.O., Townsend, K.M.S., Parker, A.W., McRobert, A.J.,Application of fluorescence lifetime imag<strong>in</strong>g microscopy to the <strong>in</strong>vestigation of <strong>in</strong>tracellular PDT mechanisms.Bioimag<strong>in</strong>g 5 (1997) 9-18[62] D.V. O’Connor, D. Phillips, Time Correlated S<strong>in</strong>gle Photon Count<strong>in</strong>g, Academic Press, London 1984[63] SPC-134 through SPC-730 <strong>TCSPC</strong> Modules, Operat<strong>in</strong>g Manual <strong>and</strong> <strong>TCSPC</strong> Compendium. Becker & HicklGmbH, www.becker-hickl.com[64] W. Becker, H. Stiel, E. Klose, Flexible Instrument <strong>for</strong> time-correlated s<strong>in</strong>gle photon count<strong>in</strong>g, Rev. Sci. Instrum. 62(1991) 2991-2996[65] I. Bugiel, K. König, H. Wabnitz, Investigations of cells by fluorescence laser scann<strong>in</strong>g microscopy withsubnanosecond resolution. Lasers <strong>in</strong> the Life Sciences 3 (1989) 47-53[66] W. Becker, A. Bergmann, H. Wabnitz, D. Grosenick, A. Liebert, High count rate multichannel <strong>TCSPC</strong> <strong>for</strong> opticaltomography. Proc. SPIE 4431, 249-254 (2001)[67] W. Becker, A. Bergmann, K. Koenig, U. Tirlapur, Picosecond fluorescence lifetime microscopy by <strong>TCSPC</strong>imag<strong>in</strong>g. Proc. SPIE 4262 (2001) 414-419[68] Wolfgang Becker, Klaus Benndorf, Axel Bergmann, Christoph Biskup, Karsten König, Uday Tirplapur, ThomasZimmer, <strong>FRET</strong> Measurements by <strong>TCSPC</strong> Laser Scann<strong>in</strong>g Microscopy, Proc. SPIE 4431(2001) 94-9840
[69] Wolfgang Becker, Axel Bergmann, Georg Weiss, Lifetime Imag<strong>in</strong>g with the Zeiss LSM-510. Proc. SPIE 4620(2002) 30-35[70] K. Koenig, C. Peuckert, I. Riemann, U. Woll<strong>in</strong>a, Optical tomography of human sk<strong>in</strong> with picosecond timeresolution us<strong>in</strong>g <strong>in</strong>tense near <strong>in</strong>frared femtosecond laser pulses, Proc. SPIE 4620-36[71] S. Ameer-Beg, P.R. Barber, R. Locke, R.J. Hodgkiss, B. Vojnovic, G.M. Tozer, J. Wilson, Application ofmultiphoton steady state <strong>and</strong> lifetime imag<strong>in</strong>g to mapp<strong>in</strong>g of tumor vascular architecture <strong>in</strong> vivo. Proc. SPIE 4620(2002) 85-95[72a] Wolfgang Becker, Axel Bergmann, Christoph Biskup, Thomas Zimmer, Nikolaj Klöcker, Klaus Benndorf, Multiwavelength<strong>TCSPC</strong> lifetime imag<strong>in</strong>g. Proc. SPIE 4620 (2002) 79-84[72b] Wolfgang Becker, Axel Bergmann, Christoph Biskup, Laimonas Kelbauskas, Thomas Zimmer, Nikolaj Klöcker,Klaus Benndorf, High resolution <strong>TCSPC</strong> lifetime imag<strong>in</strong>g. Proc. SPIE 4963-30 (2003)[73] A. Schönle, M. Glatz, S. W. Hell, Four-dimensional multiphoton microscopy with time-correlated s<strong>in</strong>gle photoncount<strong>in</strong>g. Appl. Optics 39 (2000) 6306-6311[74] S. Jakobs, V. Subramaniam, A. Schönle, Th. Jov<strong>in</strong>, S.W. Hell, EGFP <strong>and</strong> DsRed express<strong>in</strong>g cultures of escherichiacoli imaged by confocal, two-photon <strong>and</strong> fluorescence lifetime microscopy. FEBS Letters 479 (2000) 131-135[75] D. Schweitzer, A. Kolb, M. Hammer, E. Thamm, Tau-mapp<strong>in</strong>g of the autofluorescence of the human ocular fundus.Proc. SPIE Vol. 4164, 79-89[75b] D. Schweitzer, A. Kolb, M. Hammer, E. Thamm, Basic <strong>in</strong>vestigations <strong>for</strong> 2-dimensional time-resolvedfluorescence measurements at the fundus. International Ophthalmology 23 (2001) 399-404[76] HRT-41, HRT-81, HRT-82 Rout<strong>in</strong>g Devices, Operat<strong>in</strong>g Manual. Becker & Hickl GmbH, www.becker-hickl.com[77] PML-16 16 Channel Detector Head, Operat<strong>in</strong>g Manual. Becker & Hickl GmbH, www.becker-hickl.com[78] E-S. Kwak, T.J.Kang, A.A. V<strong>and</strong>en Bout, Fluorescence lifetime imag<strong>in</strong>g with near-field scann<strong>in</strong>g opticalmicroscopy. Anal. Chem. 73 (2001) 3257-3262[79] W. Hartmann, F. Bernhard, Fotovervielfacher und ihre Anwendung <strong>in</strong> der Kernphysik. Akademie-Verlag Berl<strong>in</strong>1957[80] M. Köllner, J. Wolfrum, How many photons are necessary <strong>for</strong> fluorescence-lifetime measurements? Phys. Chem.Lett. 200 (1992) 199-204[81] Gerritsen, H.C., Asselbergs, M.A.H., Agronskaia, A.V., van Sark, W.G.J.H.M., Fluorescence lifetime imag<strong>in</strong>g <strong>in</strong>scann<strong>in</strong>g microscopes: acquistition speed, photon economy <strong>and</strong> lifetime resolution. J. Microsc. 206 (2002) 218-224[82] L. Kelbauskas, W. Dietel, Internalization of aggregated photosensitizers by tumor cells: Subcellular time-resolvedfluorescence spectroscopy on derivates of pyropheophorbide-a ethers <strong>and</strong> chlor<strong>in</strong> e6 under femtosecond one- <strong>and</strong>two-photon excitation. Photochem. Photobiol. 76 (2002) 686-69441
Time-Correlated S<strong>in</strong>gle Photon Count<strong>in</strong>g ModuleSPC-140bh’s multi-dimensional <strong>TCSPC</strong> techniqueHigh-speed on-board data acquisitionMulti-detector capabilityWorks at any scan rate of CLSMs or MPLSMsPhoton distribution modes <strong>and</strong> time-tag modePicosecond resolutionUltra-high sensitivityTime channel width down to 813 fsLifetime image size up to 1024 x 1024 pixelsSteady-state image size up to 2048 x 2048 pixelsElectrical time resolution down to 8 ps fwhm / 4 ps rmsReversed start/stop: Laser repetition rates up to 150 MHzTotal useful recorded count rate up to 5 MHzDead time 100 ns, saturated count rate 10 MHzConventional fluorescence lifetime experimentsPicosecond fluorescence lifetime imag<strong>in</strong>gFluorescence correlation spectroscopyTransient fluorescence lifetime phenomena0.75 Lifetime, ns 2.25Becker & Hickl GmbHNahmitzer Damm 3012277 Berl<strong>in</strong>, Berl<strong>in</strong>Tel. +49 / 30 / 787 56 32Fax. +49 / 30 / 787 57 34email: <strong>in</strong>fo@becker-hickl.comwww becker-hickl comUS Representative:<strong>Boston</strong> <strong>Electronics</strong> Corptcspc@boselec.comwww boselec.comUK Representative:Photonic Solutions PLCsales@psplc comwww psplc comCovered by patents DE 43 39 784 <strong>and</strong> DE 43 39 787
Photon ChannelsPr<strong>in</strong>cipleConstant Fraction Discrim<strong>in</strong>ator (CFD)Time Resolution (FWHM / RMS, electr.)8 ps / 5 psOpt. Input Voltage Range- 50 mV to - 1 VM<strong>in</strong>. Input Pulse Width400 psLower Threshold- 20 mV to - 500 mVUpper Threshold -Zero Cross Adjust- 100 mV to + 100 mVSynchronisation ChannelsPr<strong>in</strong>cipleConstant Fraction Discrim<strong>in</strong>ator (CFD)Opt. Input Voltage Range- 50 mV to - 1 VM<strong>in</strong>. Input Pulse Width400 psThreshold- 20 mV to -500 mVFrequency Range0 to 200 MHzFrequency Divider 1-2-4Zero Cross Adjust-100 mV to + 100 mVTime-to-Amplitude Converters / ADCsPr<strong>in</strong>cipleRamp Generator / Biased AmplifierTAC Range50 ns to 2 usBiased Amplifier Ga<strong>in</strong> 1 to 15Biased Amplifier Offset0 to 100% of TAC RangeTime Range <strong>in</strong>cl. Biased Amplifier3.3 ns to 2 usm<strong>in</strong>. Time / Channel813 fsADC Pr<strong>in</strong>ciple50 ns Flash ADC with Error CorrectionDiff. Nonl<strong>in</strong>earity< 0.5% rms, typ.
The <strong>TCSPC</strong> Microscopy SolutionSPC-830High Resolution Time-Correlated S<strong>in</strong>gle Photon Count<strong>in</strong>g Imag<strong>in</strong>g<strong>and</strong> FCS Module <strong>for</strong> Laser Scann<strong>in</strong>g Microscopesi Complete picosecond imag<strong>in</strong>g system on s<strong>in</strong>gle PC boardi Picosecond resolutioni Ultra-high sensitivityi Multi detector capabilityi High-speed on-board data acquisitioni Works at any scann<strong>in</strong>g speed of microscopei High resolution picosecond lifetime imag<strong>in</strong>gi <strong>FRET</strong> imag<strong>in</strong>gi High-resolution steady state imag<strong>in</strong>gi S<strong>in</strong>gle-po<strong>in</strong>t time-lapse lifetime analysisi FCS, FIDA, FILDA, BIFL measurementi Time channel width down to 813 fsi Image size up to 4096 x 4096 pixelsi Electrical time resolution down to 8 ps fwhm / 4 ps rmsi Reversed start/stop: Laser repetition rates up to 200 MHzi Useful detector count rate up to 8 MHz - dead time 125 nsi Active <strong>and</strong> passive scann<strong>in</strong>g controli Software versions <strong>for</strong> w<strong>in</strong>dows 95 / 98 / 2000 / NT0.3 Lifetime, ns 1.2CFP/YFP <strong>FRET</strong>0.5 <strong>FRET</strong> Intensity 2.0Becker & Hickl GmbHNahmitzer Damm 3012277 Berl<strong>in</strong>, Berl<strong>in</strong>Tel. +49 / 30 / 787 56 32Fax. +49 / 30 / 787 57 34email: <strong>in</strong>fo@becker-hickl.comwww.becker-hickl.comUS Representative:<strong>Boston</strong> <strong>Electronics</strong> Corptcspc@boselec.comwww.boselec.comUK Representative:Photonic Solutions PLCsales@psplc.comwww.psplc.comCovered by patents DE 43 39 784 <strong>and</strong> DE 43 39 787
The <strong>TCSPC</strong> Microscopy SolutionSPC-830Photon ChannelPr<strong>in</strong>cipleTime Resolution (FWHM / RMS, electr.)Opt. Input Voltage RangeM<strong>in</strong>. Input Pulse WidthLower ThresholdZero Cross AdjustConstant Fraction Discrim<strong>in</strong>ator7 ps / 4 ps- 50 mV to - 1 V400 ps- 20 mV to - 500 mV- 100 mV to + 100 mVSynchronisation ChannelPr<strong>in</strong>cipleConstant Fraction Discrim<strong>in</strong>atorOpt. Input Voltage Range- 50 mV to - 1 VM<strong>in</strong>. Input Pulse Width400 psThreshold- 20 mV to -500 mVFrequency Range0 to 200 MHzFrequency Divider 1-2-4-8-16Zero Cross Adjust-100 mV to + 100 mVTime-to-Amplitude Converter / ADCPr<strong>in</strong>cipleRamp Generator / Biased AmplifierTAC Range50 ns to 2 usBiased Amplifier Ga<strong>in</strong> 1 to 15Biased Amplifier Offset0 to 100% of TAC RangeTime Range <strong>in</strong>cl. Biased Amplifier3.3 ns to 2 usm<strong>in</strong>. Time / Channel813 fsTAC W<strong>in</strong>dow Discrim<strong>in</strong>atorAny W<strong>in</strong>dow <strong>in</strong>side TAC RangeADC Pr<strong>in</strong>ciple50 ns 12 bit Flash ADC with Error CorrectionDiff. Nonl<strong>in</strong>earity (dith width 1/8, 90% of TAC range)< 0.5% rms, typically
The <strong>TCSPC</strong> Imag<strong>in</strong>g PackageSPC-144Four-Channel Time-Correlated S<strong>in</strong>gle Photon Count<strong>in</strong>g <strong>FLIM</strong>Module <strong>for</strong> Laser Scann<strong>in</strong>g MicroscopesFour fully parallel <strong>TCSPC</strong> imag<strong>in</strong>g channelsPicosecond resolutionUltra-high sensitivityMulti-detector capability <strong>in</strong> all four channelsHigh-speed on-board data acquisitionWorks at any scann<strong>in</strong>g speed of CLSMs or MPLSMsTime channel width down to 813 fsLifetime image size up to 1024 x 1024 pixelsSteady-state image size up to 2048 x 2048 pixelsElectrical time resolution down to 8 ps fwhm / 4 ps rmsReversed start/stop: Laser repetition rates up to 150 MHzTotal useful recorded count rate up to 20 MHzDead time 100 nsMulti-wavelength picosecond lifetime imag<strong>in</strong>g<strong>FRET</strong> imag<strong>in</strong>gFCS, FIDA, FILDA, BIFLHigh-resolution steady state imag<strong>in</strong>gS<strong>in</strong>gle-po<strong>in</strong>t time-lapse lifetime analysis0.75 Lifetime, ns 2.25Becker & Hickl GmbHNahmitzer Damm 3012277 Berl<strong>in</strong>, Berl<strong>in</strong>Tel. +49 / 30 / 787 56 32Fax. +49 / 30 / 787 57 34email: <strong>in</strong>fo@becker-hickl.comwww becker-hickl comUS Representative:<strong>Boston</strong> <strong>Electronics</strong> Corptcspc@boselec.comwww boselec.comUK Representative:Photonic Solutions PLCsales@psplc comwww psplc comCovered by patents DE 43 39 784 <strong>and</strong> DE 43 39 787
SPC-144Photon ChannelsPr<strong>in</strong>cipleConstant Fraction Discrim<strong>in</strong>ator (CFD)Time Resolution (FWHM / RMS, electr.)8 ps / 5 psOpt. Input Voltage Range- 50 mV to - 1 VM<strong>in</strong>. Input Pulse Width400 psLower Threshold- 20 mV to - 500 mVUpper Threshold -Zero Cross Adjust- 100 mV to + 100 mVSynchronisation ChannelsPr<strong>in</strong>cipleConstant Fraction Discrim<strong>in</strong>ator (CFD)Opt. Input Voltage Range- 50 mV to - 1 VM<strong>in</strong>. Input Pulse Width400 psThreshold- 20 mV to -500 mVFrequency Range0 to 200 MHzFrequency Divider 1-2-4Zero Cross Adjust-100 mV to + 100 mVTime-to-Amplitude Converters / ADCsPr<strong>in</strong>cipleRamp Generator / Biased AmplifierTAC Range50 ns to 2 usBiased Amplifier Ga<strong>in</strong> 1 to 15Biased Amplifier Offset0 to 100% of TAC RangeTime Range <strong>in</strong>cl. Biased Amplifier3.3 ns to 2 usm<strong>in</strong>. Time / Channel813 fsADC Pr<strong>in</strong>ciple50 ns Flash ADC with Error CorrectionDiff. Nonl<strong>in</strong>earity< 0.5% rms, typ.
The <strong>TCSPC</strong> Imag<strong>in</strong>g PackageSPC-154Four-Channel Time-Correlated S<strong>in</strong>gle Photon Count<strong>in</strong>g ModuleFour fully parallel <strong>TCSPC</strong> channelsPicosecond resolutionUltra-high sensitivityMulti-detector capability <strong>in</strong> all four channelsHigh-speed on-board data acquisitionPhoton distribution <strong>and</strong> time-tag modesImage acquisition by synchronisation with ext. scannerUnlimited sequential record<strong>in</strong>g of curves or imagesImag<strong>in</strong>g <strong>in</strong> histogram mode <strong>and</strong> <strong>in</strong> time-tag modeWorks at any scan rate of CLSMs or MPLSMsTime channel width down to 813 fsElectrical time resolution down to 8 ps fwhm / 4 ps rmsReversed start/stop: Laser repetition rates up to 150 MHzTotal saturated count rate 40 MHzTotal useful recorded count rate up to 20 MHzChannel dead time 100 nsMulti-wavelength <strong>FLIM</strong>Double-exponential <strong>FLIM</strong>Fast-Acquisition <strong>FLIM</strong>Fast Sequential <strong>FLIM</strong>S<strong>in</strong>gle <strong>and</strong> double-exponential <strong>FRET</strong> imag<strong>in</strong>gFCS, FCCS, FIDA, FILDA, BIFLFCS Imag<strong>in</strong>gDOT, static <strong>and</strong> dynamic bra<strong>in</strong> imag<strong>in</strong>gTransient fluorescence lifetime effectsBecker & Hickl GmbHNahmitzer Damm 3012277 Berl<strong>in</strong>, Berl<strong>in</strong>Tel. +49 / 30 / 787 56 32Fax. +49 / 30 / 787 57 34email: <strong>in</strong>fo@becker-hickl.comwww becker-hickl comUS Representative:<strong>Boston</strong> <strong>Electronics</strong> Corptcspc@boselec.comwww boselec.comUK Representative:Photonic Solutions PLCsales@psplc comwww psplc comCovered by patents DE 43 39 784 <strong>and</strong> DE 43 39 787
SPC-154Photon ChannelsPr<strong>in</strong>cipleConstant Fraction Discrim<strong>in</strong>ator (CFD)Time Resolution (FWHM / RMS, electr.)8 ps / 5 psOpt. Input Voltage Range- 50 mV to - 1 VM<strong>in</strong>. Input Pulse Width400 psLower Threshold- 20 mV to - 500 mVUpper Threshold -Zero Cross Adjust- 100 mV to + 100 mVSynchronisation ChannelsPr<strong>in</strong>cipleConstant Fraction Discrim<strong>in</strong>ator (CFD)Opt. Input Voltage Range- 50 mV to - 1 VM<strong>in</strong>. Input Pulse Width400 psThreshold- 20 mV to -500 mVFrequency Range0 to 200 MHzFrequency Divider 1-2-4Zero Cross Adjust-100 mV to + 100 mVTime-to-Amplitude Converters / ADCsPr<strong>in</strong>cipleRamp Generator / Biased AmplifierTAC Range50 ns to 2 usBiased Amplifier Ga<strong>in</strong> 1 to 15Biased Amplifier Offset0 to 100% of TAC RangeTime Range <strong>in</strong>cl. Biased Amplifier3.3 ns to 2 usm<strong>in</strong>. Time / Channel813 fsADC Pr<strong>in</strong>ciple50 ns Flash ADC with Error CorrectionDiff. Nonl<strong>in</strong>earity< 0.5% rms, typ.
Multi-Spectral <strong>FLIM</strong> SystemMS-<strong>FLIM</strong>Fluorescence lifetime imag<strong>in</strong>g with spectral resolutionPicosecond time resolutionBased on BH’s multi-dimensional <strong>TCSPC</strong> techniqueUltra-high sensitivity due to simultaneous detection <strong>in</strong> all time <strong>and</strong> wavelength channelsAdapters <strong>for</strong> confocal microscopesAdapters <strong>for</strong> non-descanned outputs of multiphoton microscopesSeparation of fluorophores by fluorescence lifetime <strong>and</strong> spectrumAutofluorescence imag<strong>in</strong>g of tissuepH imag<strong>in</strong>g of tissue<strong>FRET</strong> experimentsComb<strong>in</strong>ed Lifetime / SHG imag<strong>in</strong>gThe MW-<strong>FLIM</strong> system is based on a 16-channel multianodePMT detector module <strong>in</strong> comb<strong>in</strong>ation with apolychromator <strong>and</strong> BH’s proprietary multi-dimensional<strong>TCSPC</strong> technique. A fibre bundle is used to transfer thelight from the microscope <strong>in</strong>to the entrance slit of thepolychromator. Due to the large light collection area ahigh efficiency is obta<strong>in</strong>ed both <strong>for</strong> confocal detection<strong>and</strong> <strong>for</strong> non-descanned (direct) detection <strong>in</strong> multiphotonmicroscopes. Typical applications are multi-spectralautofluorescence imag<strong>in</strong>g <strong>in</strong> deep tissue, pH imag<strong>in</strong>g <strong>in</strong>tissue, comb<strong>in</strong>ed <strong>FLIM</strong> <strong>and</strong> SHG imag<strong>in</strong>g, <strong>and</strong> <strong>in</strong>vestigationof prote<strong>in</strong> <strong>in</strong>teraction by <strong>FRET</strong>.Prote<strong>in</strong> <strong>in</strong>teraction <strong>in</strong> live cells: <strong>FRET</strong>, Cerulean-YFPDonor Acceptor Lifetime of donor Fraction of <strong>FRET</strong> EfficiencyCerulean YFP <strong>in</strong>teract<strong>in</strong>g prote<strong>in</strong>sBecker & Hickl GmbHNahmitzer Damm 3012277 Berl<strong>in</strong>, GermanyTel. +49 30 787 56 32 Fax +49 30 787 57 34<strong>in</strong>fo@becker-hickl com www becker-hickl comUS Representative:<strong>Boston</strong> <strong>Electronics</strong> Corp91 Boylston Street, Brookl<strong>in</strong>e.Massachusetts 02445 USATel: (800) 347 5445 or (617) 566 3821Fax: (617) 731 0935www.boselec com tcspc@boselec.comUK Representative:Photonic Solutions PLCsales@psplc.comwww.psplc.com
Multi-Spectral <strong>FLIM</strong> SystemMS-<strong>FLIM</strong>Part ListM-SHUT field lens <strong>and</strong> shutter assembly 1)MW-<strong>FLIM</strong> fibre adapterLOT MS125 spectrographPML-16-0 (300 to 600 nm) or PML-16-1 (300 to 800 nm) 16 channel PMT module, with MS125 adapterHigh-voltage power supply <strong>for</strong> PML-16SPC-830 <strong>TCSPC</strong> module 2) or Simple-Tau 830 st<strong>and</strong>-DCC-100 detector controller 2) alone <strong>TCSPC</strong> system 3)SPC-830 st<strong>and</strong>ard cable setSPC-830 scan control cable 1)SPCImage <strong>FLIM</strong> data analysis software1) please specify microscope type <strong>and</strong> configuration <strong>in</strong> your order2) PC cards, to be <strong>in</strong>serted <strong>in</strong> a Pentium PC3) Laptop based st<strong>and</strong>-alone system, conta<strong>in</strong>s SPC-830 <strong>and</strong> DCC-100Wavelength range <strong>and</strong> resolutionGrat<strong>in</strong>g Primary wavelength region Width of recorded wavelength Blaze WavelengthPart No. adjustable by set screw 4) <strong>in</strong>terval, channel 1 to 1677417 340-820 nm 300 nm 500 nm77414 (st<strong>and</strong>ard) 340-820 nm 200 nm 400 nm77411 340-820 nm 100 nm 350 nm4) <strong>for</strong> PML-16-1, may vary due to transmission range of microscope opticsThe setup employs BH’s multi-dimensional<strong>TCSPC</strong> technique featur<strong>in</strong>g multiwavelengthcapability, high count rate,near-ideal count<strong>in</strong>g efficiency, low differentialnonl<strong>in</strong>earity, <strong>and</strong> ultra-high timeresolution.It conta<strong>in</strong>s the usual build<strong>in</strong>gblocks (CFDs, TAC, ADC) <strong>in</strong> the ‘reversedstart-stop’ configuration together with ascann<strong>in</strong>g <strong>in</strong>terface <strong>and</strong> a large histogrammemory <strong>in</strong>tegrated on a s<strong>in</strong>gle PC board.For each photon the <strong>TCSPC</strong> module determ<strong>in</strong>esthe time with<strong>in</strong> the fluorescencedecay function, t, the wavelength, λ, <strong>and</strong>the location with<strong>in</strong> the scann<strong>in</strong>g area, x <strong>and</strong>y. These values are used to address a memory<strong>in</strong> which the events are accumulated.Thus, <strong>in</strong> the memory the distribution of thephoton density over X, Y, λ, <strong>and</strong> t buildsup. With a 16-channel detector, the resultconta<strong>in</strong>s 16 data sets <strong>for</strong> different wavelength,each conta<strong>in</strong><strong>in</strong>g a large number ofimages <strong>for</strong> different time <strong>in</strong> the fluorescencedecay curve. The record<strong>in</strong>g processruns at any scan rate, <strong>in</strong>clud<strong>in</strong>g ultra-highrates of resonance scanners.fromPolychromatorChannel Channel register n Channel / WavelengthDetectorPML-16TimeTim<strong>in</strong>g MeasurementCFDStartTAC ADC t Time with<strong>in</strong> decay curveStopCFDfrom LaserFrame SyncL<strong>in</strong>e SyncPixel ClockfromMicroscopeCounter YScann<strong>in</strong>gInterfaceCounter XMW-<strong>FLIM</strong>: Pr<strong>in</strong>ciple of data acquisitionFor more <strong>in</strong><strong>for</strong>mation please download or call <strong>for</strong>yxHistogramMemoryDetectorchannel 1HistogramMemoryDetectorchannel ...Location with<strong>in</strong> scann<strong>in</strong>g areaHistogramMemoryDetectorchannel ...Covered by patents DE 43 39 784 <strong>and</strong> DE 43 39 787HistogramMemoryDetectorchannel 16SPC-140 through SPC-830 <strong>TCSPC</strong> modules. Manual <strong>and</strong> <strong>TCSPC</strong> compendiumSPC-830 data sheetPML-16 data sheet, PML-16 manualBecker & Hickl GmbHNahmitzer Damm 3012277 Berl<strong>in</strong>, GermanyTel. +49 30 787 56 32 Fax +49 30 787 57 34<strong>in</strong>fo@becker-hickl.com www.becker-hickl.comUS Representative:<strong>Boston</strong> <strong>Electronics</strong> Corp91 Boylston Street, Brookl<strong>in</strong>e.Massachusetts 02445 USATel: (800) 347 5445 or (617) 566 3821Fax: (617) 731 0935www.boselec com tcspc@boselec.comUK Representative:Photonic Solutions PLCsales@psplc.comwww.psplc.com
Lifetime Upgrade Kit <strong>for</strong> Zeiss LSM-510Fluorescence lifetime imag<strong>in</strong>g with ps resolutionTwo-photon excitationNon descanned detectionUltra-high sensitivity due to <strong>TCSPC</strong> techniqueZoom <strong>and</strong> image rotation functions of LSM-510 applicable<strong>FRET</strong> experimentsFluorescence quench<strong>in</strong>gNew fluorescence probes based on lifetime changesSeparation of fluorophores by lifetimeAutofluorescenceCFP/YFF <strong>FRET</strong> <strong>in</strong> HEK CellAutofluorescence of human sk<strong>in</strong>0.5 <strong>FRET</strong> Intensity 2.0 0.5 Lifetime, ns2.5The setup employs an advanced multi-dimensional <strong>TCSPC</strong> techniquefeatur<strong>in</strong>g high count rate, near-ideal count<strong>in</strong>g efficiency, <strong>and</strong> multiwavelengthcapability. It conta<strong>in</strong>s the usual build<strong>in</strong>g blocks (CFDs, TAC,ADC) <strong>in</strong> the ‘reversed start-stop’ configuration together with a scann<strong>in</strong>g<strong>in</strong>terface <strong>and</strong> a large histogram memory <strong>in</strong>tegrated on a s<strong>in</strong>gle PC board.For each photon the <strong>TCSPC</strong> module determ<strong>in</strong>es the time with<strong>in</strong> thefluorescence decay function <strong>and</strong> the location with<strong>in</strong> the scann<strong>in</strong>g area.These values are used to address a histogram memory <strong>in</strong> which the eventsare accumulated. Thus, <strong>in</strong> the memory the distribution of the photon densityover X, Y, <strong>and</strong> the time with<strong>in</strong> the fluorescence decay function builds up.The result can be <strong>in</strong>terpreted as a two-dimensional (X, Y) array offluorescence decay curves or as a sequence of fluorescence images <strong>for</strong>different times (t) after the excitation pulse.Time MeasurementStartCFDFrom PMTTAC ADCStopCFDFrom LaserFrame SyncL<strong>in</strong>e SyncPixel ClockScann<strong>in</strong>gInterfaceFrom Scann<strong>in</strong>g UnitTimewith<strong>in</strong>decaycurveYBeamLocationXYtHistogramMemoryStack of images <strong>for</strong>subsequent times<strong>in</strong> decay curvesXRequirements to LSM-510 MicroscopeLSM-510 NLO with Ti:Sa LaserAxiovert or Axioplan versionNDD switch box <strong>in</strong>stalledBecker & Hickl GmbHNahmitzer Damm 3012277 Berl<strong>in</strong>, GermanyTel. +49 30 787 56 32 Fax +49 30 787 57 34<strong>in</strong>fo@becker-hickl.com www.becker-hickl.comUS Representative:<strong>Boston</strong> <strong>Electronics</strong> Corp91 Boylston Street, Brookl<strong>in</strong>e.Massachusetts 02445 USATel: (800) 347 5445 or (617) 566 3821, Fax: (617) 731 0935www.boselec.com tcspc@boselec.com
LSM 510 NLO <strong>FLIM</strong> Upgrade KitSPC-830 <strong>TCSPC</strong> moduleDCC-100 detector controllerDetector OptionsPMC-100 / M-SHUT-Z-NDD H7422-40 / M-SHUT-Z-NDD R3809U / M-SHUT-Z-NDDDetector / shutter assembly Detector / shutter assembly Detector / shutter assemblyCooled PMT Cooled GaAsP PMT Multichannel plate PMTIRF width 150 to 180 ps IRF width 300 to 350 ps IRF width < 30 psFor lifetimes down to 100 ps For lifetimes down to 200 ps For lifetimes down to 20 psDark counts typ. 20 to 50 s -1 Dark counts typ. 20 to 80 s -1 dark counts typ. 100 to 500 s -1PMC-0: 300 to 650 nm 300 to 690 nm, ultra-high sensitivity R3809U-52: 180 to 650 nmPMC-1: 300 to 820 nmR3809U-50: 180 to 820 nmLength 135 mm 1) Length without cables 195 mm 1) Length without cables 195 mm 1)Ga<strong>in</strong> control via DCC-100 Ga<strong>in</strong> control via DCC-100 Ga<strong>in</strong> control via DCC-100Overload shutdown via DCC-100 Overload shutdown via DCC-100 Overload shutdown via DCC-100no external components HFAC-26-2 preamplifier HFAD-26-01 preamplifierFuG HCN-14-3500A HV power supply1) Depend<strong>in</strong>g on the microscope configuration, space contsta<strong>in</strong>ts may preclude the use at one of the detector ports of the NDD switch boxDual Wavelength OperationHRT-41 RouterSimultaneous operation of twoPMC-100, H7422, or R3809Udetectors attached to the outputs ofthe Zeiss NDD switch boxUses BH‘s patented simultaneouslyrecord<strong>in</strong>g multi-detector <strong>TCSPC</strong>pr<strong>in</strong>ciple<strong>FLIM</strong> Data AnalysisSPCImage Data AnalysisS<strong>in</strong>gle <strong>and</strong> multi exponentialdecay analysisLifetime <strong>in</strong> pixels displayedas colourLifetime distribution<strong>FRET</strong> <strong>in</strong>tensity by doubleexponentialanalysis of donordecay functionFor more <strong>in</strong><strong>for</strong>mation please download or call <strong>for</strong>SPC-134 through SPC-830 <strong>TCSPC</strong> modules, Manual <strong>and</strong> <strong>TCSPC</strong> compendiumUpgrad<strong>in</strong>g <strong>TCSPC</strong> laser scann<strong>in</strong>g microscopes with the SPC-730 <strong>and</strong> SPC-830 <strong>TCSPC</strong> imag<strong>in</strong>g modulesW. Becker, A. Bergmann, Lifetime imag<strong>in</strong>g techniques <strong>for</strong> optical microscopyW. Becker, A. Bergmann, Detector assemblies <strong>for</strong> picosecond microscopyDCC-100 manualSPCImage manualSPC-830, DCC-100, PMC-100, HFAC-26 <strong>and</strong> HFAD-26 data sheetsBecker & Hickl GmbHTel. +49 30 787 56 32 Fax +49 30 787 57 34<strong>in</strong>fo@becker-hickl.com www.becker-hickl.com
<strong>FLIM</strong> Upgrade Kits <strong>for</strong> Olympus FV1000Fluorescence lifetime imag<strong>in</strong>g with ps resolutionExcitation by picosecond diode laserConfocal detectionMulti-dimensional <strong>TCSPC</strong> techniqueS<strong>in</strong>gle- or dual channel detectionMulti-wavelength lifetime imag<strong>in</strong>gExcellent sensitivity <strong>and</strong> time-resolutionFull range of zoom <strong>and</strong> image rotation functionsWorks at any scan rateSeparation of fluorophores by lifetimeAutofluorescence<strong>FRET</strong> experiments, prote<strong>in</strong>-prote<strong>in</strong> <strong>in</strong>teractionImag<strong>in</strong>g of pH, ion concentrations, or oxygen concentrationThe system is based on a picosecond diode laser of405 nm, 440 nm or 473 nm wavelength with highefficiencys<strong>in</strong>gle-mode fibre coupl<strong>in</strong>g, a s<strong>in</strong>gle-, dual-,or multi-wavelength detector module, <strong>and</strong> BH’sproprietary multi-dimensional <strong>TCSPC</strong> technique. Thepulsed laser light is fed <strong>in</strong>to the microscope via ast<strong>and</strong>ard s<strong>in</strong>gle-mode optical fibre. A high speeddetector assembly is attached to the optical output ofthe scan head. Both directly coupled <strong>and</strong> fibre-coupledversions are available. A large variety of detectormodules is available <strong>for</strong> s<strong>in</strong>gle-wavelength, dualwavelength,or multispectral detection <strong>in</strong> 16wavelength channels. The signals of all detectorchannels are recorded simultaneously by multidimensional<strong>TCSPC</strong>, result<strong>in</strong>g <strong>in</strong> excellent efficiency<strong>and</strong> time resolution. Typical applications are multispectralautofluorescence imag<strong>in</strong>g of tissue, pHimag<strong>in</strong>g <strong>in</strong> tissue, comb<strong>in</strong>ed <strong>FLIM</strong> <strong>and</strong> SHG imag<strong>in</strong>g,<strong>and</strong> <strong>in</strong>vestigation of prote<strong>in</strong> <strong>in</strong>teraction by <strong>FRET</strong>.Plant tissue, Mean lifetime of double-exponential decay. Courtesy of Dr.Neumann, Life & Bra<strong>in</strong>, Bonn, GermanyThe laser is a jo<strong>in</strong>t product of BH <strong>and</strong> LASOS<strong>TCSPC</strong> technique covered by patents DE 43 39 784 <strong>and</strong> DE 43 39 787Becker & Hickl GmbHNahmitzer Damm 3012277 Berl<strong>in</strong>, GermanyTel. +49 30 787 56 32Fax +49 30 787 57 34<strong>in</strong>fo@becker-hickl.comwww.becker-hickl.comLASOS Lasertechnik GmbHCarl-Zeiss-Promenade 1007745 Jena, GermanyTel. +49 3641-2944-54Fax +49 3641 2944-17lasos<strong>in</strong>fo@lasos.comwww.lasos.comUK Representative:Photonic SolutionsPLCTel. +44 1316648122sales@psplc.comwww.psplc.comUS Representative:<strong>Boston</strong> <strong>Electronics</strong> Corp91 Boylston Street, Brookl<strong>in</strong>e.Massachusetts 02445 USATel: (800) 347 5445 or (617) 566 3821Fax: (617) 731 0935tcspc@boselec com, www.boselec.com
<strong>FLIM</strong> Upgrade Kits <strong>for</strong> Olympus FV1000Computer Options<strong>TCSPC</strong> cards, to be placed <strong>in</strong> any Pentium computerLaptop-based systems, fully <strong>in</strong>stalledSPC-830 <strong>TCSPC</strong> moduleDCC-100 detector controllerDetector OptionsA wide selection of detector assemblies is available. The PMC-100 is recommended <strong>for</strong> st<strong>and</strong>ard applications, the H7422 <strong>for</strong> comb<strong>in</strong>ed<strong>FLIM</strong> <strong>and</strong> FCS experiments. The R3809U is recommneded <strong>for</strong> ultra-fast <strong>FLIM</strong> down to lifetimes of 30 ps. Due to its fast <strong>and</strong> clean responsethe R3809U is the ultimate solution <strong>for</strong> <strong>FRET</strong> imag<strong>in</strong>g. All these detectors are coupled directly to the scan head, thus avoid<strong>in</strong>g coupl<strong>in</strong>g lossor pulse dispersion <strong>in</strong> optical fibres. Dual-detector beamsplitter units are available <strong>for</strong> all these detectors.Multi-wavelength detection <strong>in</strong> 16 wavelength channels is obta<strong>in</strong>ed by us<strong>in</strong>g the PML-16 / MW-<strong>FLIM</strong> unit.PMC-100 / M-SHUT H7422-40 / M-SHUT R3809U / M-SHUT R3809U / M-SHUT-DUAL PML-16 / MW-<strong>FLIM</strong>Cooled PMT Cooled GaAsP PMT Multichannel plate PMT Two multichannel plate PMTs Spectrograph <strong>and</strong> 16 channel multi-anode PMTIRF width 150 to 180 ps IRF width 300 to 350 ps IRF width < 30 ps Simultaneous detection Simultaneous detection <strong>in</strong> 16 wavelength channelsFor lifetimes down to 100 ps For lifetimes down to 200 ps For lifetimes down to 50 ps <strong>in</strong> two wavelength <strong>in</strong>tervals For lifetimes down to 100 psPMC-0: 340 to 650 nm 340 to 690 nm, ultra-high sensitivity R3809U-52: 340 to 650 nm R3809U-52: 340 to 650 nm PML-16-0: 340 to 650 nmPMC-1: 340 to 820 nm R3809U-50: 340 to 820 nm R3809U-50: 340 to 820 nm PML-16-1: 340 to 820 nm<strong>FLIM</strong> Data AnalysisOther comb<strong>in</strong>ations: Please call bhSPCImage Data AnalysisS<strong>in</strong>gle- <strong>and</strong> multi-exponential decay analysisLifetime <strong>in</strong> pixels displayed as colourLifetime distributionSeparation of <strong>in</strong>teract<strong>in</strong>g <strong>and</strong> non-<strong>in</strong>teract<strong>in</strong>g donorfraction of <strong>FRET</strong>True <strong>FRET</strong> <strong>in</strong>tensity <strong>and</strong> fraction of <strong>in</strong>teract<strong>in</strong>gprote<strong>in</strong>sFor more <strong>in</strong><strong>for</strong>mation please download or call <strong>for</strong>W. Becker, The <strong>TCSPC</strong> H<strong>and</strong>book, Becker & Hickl GmbH 2005W. Becker, A. Bergmann, Detector assemblies <strong>for</strong> picosecond microscopyDCC-100 manualSPCImage manualData sheets: SPC-830, DCC-100, PMC-100, MW-<strong>FLIM</strong>, Simple-Tau, BDL-405-SMSupplementary <strong>FLIM</strong> LiteratureW. Becker, Adcanced time-correlated s<strong>in</strong>gle-photon count<strong>in</strong>g techniques. Spr<strong>in</strong>ger, Berl<strong>in</strong>, Heidelberg, New York, 2005Becker & Hickl GmbHNahmitzer Damm 3012277 Berl<strong>in</strong>, GermanyTel. +49 30 787 56 32Fax +49 30 787 57 34<strong>in</strong>fo@becker-hickl.comwww.becker-hickl.comLASOS Lasertechnik GmbHCarl-Zeiss-Promenade 1007745 Jena, GermanyTel. +49 3641-2944-54Fax +49 3641 2944-17lasos<strong>in</strong>fo@lasos.comwww.lasos.comUK Representative:Photonic SolutionsPLCTel. +44 1316648122sales@psplc.comwww.psplc.comUS Representative:<strong>Boston</strong> <strong>Electronics</strong> Corp91 Boylston Street, Brookl<strong>in</strong>e.Massachusetts 02445 USATel: (800) 347 5445 or (617) 566 3821Fax: (617) 731 0935tcspc@boselec com, www.boselec.com
DCS-120Confocal Scann<strong>in</strong>g SystemSystem Configuration <strong>and</strong> OptionsLasersScannerDetectors<strong>TCSPC</strong> OptionsScanner ControlAvailable Wavelengths405 nm, 440 nm, 473 nmRepetition rates20 MHz, 50 MHz, 80 MHz,, CWPulse widthtyp. 60 psIntensity control, electronical 1:10Beam correction opticsBeam-profile <strong>and</strong> astigmatism correctionFibre coupl<strong>in</strong>gS<strong>in</strong>gle-mode, <strong>in</strong>to Po<strong>in</strong>t-Source fibrePower delivered <strong>in</strong>to fibre:405 nm: 1 mW, 440 nm: 0.4 mW, 473 nm: 0.4 mWMultiplex<strong>in</strong>gPixel by pixel, l<strong>in</strong>e by l<strong>in</strong>e, or frame by frameBeam blank<strong>in</strong>gDur<strong>in</strong>g x <strong>and</strong> y flyback, via bh GVD-120 scan controllerLaser <strong>in</strong>putsPo<strong>in</strong>t-Source manipulator, push-<strong>and</strong> clickLaser power regulation, optical Attenuators, 1:1 to 1:50Laser beam comb<strong>in</strong>erDichroicScannerClose-coupled galvano mirrorsMa<strong>in</strong> beamsplitterDichroic 420 nm, dichroic 490 nm, or 80:20 mirror (fixed)Secondary beamsplitterBeamsplitter wheel. Dichroic 510 nm, Dichroic 560 nm,polaris<strong>in</strong>g beamsplitter, 100% channel 1, 100% channel 2.Other dichroics on requestP<strong>in</strong>holes From approx. 0.5 AU to 10 AU 1)FiltersFilter sliders, st<strong>and</strong>ard filters LP 435, LP 485, BP 480/40, BP535/30,BP 620/60. Other filters on request.St<strong>and</strong>ard PMTs PMC-100-1 or -20 cooled PMT modules. IRF width 180 ps 2)High-efficiency PMTs H7422P-40 GaAsP PMT modules. IRF width 200 to 350 ps 2)High-speed MCP-PMTs R3809U-50 MCP PMTs, IRF width 70 ps 2)S<strong>in</strong>gle-photon APDs id-100-50, IRF width 70 ps 2)Multi-wavelength detectorDetector controlbh MW <strong>FLIM</strong> detector. Please see <strong>in</strong>dividual data sheet.Ga<strong>in</strong>, cool<strong>in</strong>g, overload shutdown.Via bh DCC-100 detector controller, see <strong>in</strong>dividual data sheet1 SPC-830 <strong>TCSPC</strong> module High-speed, large image size with 1 detector.Multi-wavelength detector1 SPC-830 + HRT-41 router Medium speed acquisition with two detectors2 SPC-830 <strong>TCSPC</strong> modules High speed, large image size systems with 2 detectors1 SPC-150 <strong>TCSPC</strong> module High-speed medium image size systems with 1 detectorMedium speed ultra-large image size systems with 1 detector2 SPC-150 <strong>TCSPC</strong> modules High-speed systems with 2 detectorsMedium speed ultra-large image size systems with 2 detectorsPlease see <strong>in</strong>dividual data sheets or bh <strong>TCSPC</strong> H<strong>and</strong>bookScan controllerbh GVD-120 (s<strong>in</strong>gle-slot PCI module)Generation of scan signalsHardware, digital signal synthesisImage size 16 x 16 to 2048 x 2048Max. scan rate, time/frame 128x128: 0.32s, 256x256: 0.6s, 512x512: 1.5s 3)Zoom factor 1:1 to 1:10 4)Beam blank<strong>in</strong>gDur<strong>in</strong>g flyback, on / off selectableLaser multiplex<strong>in</strong>gPixel by pixel, l<strong>in</strong>e by l<strong>in</strong>e, or frame by frameBeam park functionany location with<strong>in</strong> scan areaScan control softwareIntegrated <strong>in</strong> st<strong>and</strong>ard SPCM <strong>TCSPC</strong> softwareGalvo driver amplifierbh GVP-1201) depends on microscope lens used2) Includes pulse width of ps diode laser3) maximum scan rate depends on zoom factor4) useful zoom range depends on microscopeRelated ProductsSPC-830, SPC-630, SPC-134, SPC-140/144, SPC-150/154 <strong>TCSPC</strong> modules, DCC-100 Detector controller, BDL-375, -405, -440, -473picosecond / CW diode lasers, id-100 SPAD modules, PMT detector modules, PML-SPEC <strong>and</strong> MW <strong>FLIM</strong> multi-wavelength detectionsystems.Please download <strong>in</strong>dividual data sheets <strong>and</strong> manuals, or see ‘The bh <strong>TCSPC</strong> H<strong>and</strong>book’, available on www.becker-hickl.com.Becker & Hickl GmbHNahmitzer Damm 3012277 Berl<strong>in</strong>, Berl<strong>in</strong>Tel. +49 / 30 / 787 56 32 Fax +49 / 30 / 787 57 34iwww.becker-hickl.com <strong>in</strong>fo@becker-hickl.com<strong>Boston</strong> <strong>Electronics</strong> <strong>Corporation</strong>91 Boylston Street, Brookl<strong>in</strong>e.Massachusetts 02445 USATel: (800) 347 5445 or (617) 566 3821, Fax: (617) 731 0935www.boselec.com tcspc@boselec.com
DCS-120Confocal Scann<strong>in</strong>g SystemConfocal Scanner <strong>for</strong> Fluorescence Lifetime Imag<strong>in</strong>g<strong>FLIM</strong> upgrade <strong>for</strong> conventional microscopesFully confocalScann<strong>in</strong>g by fast galvano mirrorsOne or two <strong>in</strong>put channels <strong>for</strong> bh BDL picosecond diode lasersLaser wavelengths 405 nm, 440 nm, or 473 nmHigh excitation power by beam-profile-corrected laser couplersOne or two detection channelsChannel separation by dichroic or polaris<strong>in</strong>g beamsplittersIndividually selectable p<strong>in</strong>holesIndividually selectable filtersHigh efficiency by direct-coupled detectorsPMC-100, H7422 or ultra-fast MCP detector modules16-channel multi-wavelength detector moduleCompatible with bh SPC-830, SPC-140, or SPC-150 <strong>TCSPC</strong> modulesScan control software <strong>for</strong> W<strong>in</strong>dows 2000, NT <strong>and</strong> XPHigh accuracy: Triple-exponential decayMulti-wavelength detectionBecker & Hickl GmbHNahmitzer Damm 3012277 Berl<strong>in</strong>, Berl<strong>in</strong>Tel. +49 / 30 / 787 56 32Fax. +49 / 30 / 787 57 34email: <strong>in</strong>fo@becker-hickl.comwww.becker-hickl.comUS Representative:<strong>Boston</strong> <strong>Electronics</strong> Corptcspc@boselec.comwww.boselec.comUK Representative:Photonic Solutions PLCsales@psplc.comwww.psplc.comHigh speed: Chloroplasts, acquisition <strong>in</strong> 1 second