Annual Report 2005 (6 MB) - Lundin Petroleum
Annual Report 2005 (6 MB) - Lundin Petroleum
Annual Report 2005 (6 MB) - Lundin Petroleum

You also want an ePaper? Increase the reach of your titles
YUMPU automatically turns print PDFs into web optimized ePapers that Google loves.
DIRECTORS’ REPORT<br />
Sudan<br />
A comprehensive peace agreement was signed in Sudan in early<br />
<strong>2005</strong> between the government and the Sudan People’s Liberation<br />
Army (SPLA). A new government has been formed containing<br />
representatives of the major political factions. In addition a<br />
National <strong>Petroleum</strong> Commission has been formed comprising<br />
of the President of Sudan, representatives of the National<br />
government and the government of Southern Sudan and<br />
representatives of the local area where oil activity is taking place.<br />
The National <strong>Petroleum</strong> Commission will oversee petroleum<br />
activities in Sudan.<br />
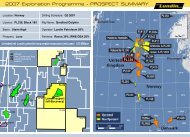
Mobilisation of equipment for a 1,100 kilometre 2D seismic<br />
acquisition is currently underway. Exploration drilling will<br />
commence in 2006 with a three well initial drilling programme to<br />
test the large prospectivity of Block 5B.<br />
Future Outlook<br />
The Company is actively pursuing opportunities to further expand<br />
its oil and gas portfolio and increasing its reserves through<br />
acquisition of producing properties, exploration activity and<br />
exploitation of existing assets.<br />
ENVIRONMENT<br />
<strong>Lundin</strong> <strong>Petroleum</strong> and its international exploration and production<br />
affi liates conduct their international exploration and production<br />
operations, at a minimum, in accordance with all applicable<br />
environmental procedures and programmes. The Group has no<br />
operations in Sweden.<br />
THE GROUP<br />
Result and cash fl ow<br />
<strong>Lundin</strong> <strong>Petroleum</strong> reports a net result for the year ended 31<br />
December <strong>2005</strong> of MSEK 994.0 (MSEK 605.3) representing earnings<br />
per share on a fully diluted basis of SEK 3.87 (SEK 2.37) for the year<br />
ended 31 December <strong>2005</strong>. Operating cashfl ow for the year ended<br />
31 December <strong>2005</strong> amounted to MSEK 2,627.4 (MSEK 1,502.8).<br />
Operating cashfl ow per share on a fully diluted basis amounted<br />
to SEK 10.22 (SEK 5.89) for the year ended 31 December <strong>2005</strong>.<br />
Revenue<br />
Net sales of oil and gas for the year ended 31 December <strong>2005</strong><br />
amounted to MSEK 3,995.5 (MSEK 2,344.0). Production for<br />
the period amounted to 12,083,451 (9,755,455) barrels of oil<br />
equivalent (boe) representing 33,190 (28,921) boe per day<br />
(boepd). The average price achieved for a barrel of oil equivalent<br />
for the year ended 31 December <strong>2005</strong> amounted to USD 52.93<br />
(USD 37.67).<br />
The average Dated Brent price for the year ended 31 December<br />
<strong>2005</strong> amounted to USD 54.54 (USD 38.27) per barrel resulting in a<br />
charge to the income statement for the post-tax negative hedge<br />
settlement of MSEK 261.7 (MSEK 97.1).<br />
> 40 <<br />
Other operating income for the year ended 31 December <strong>2005</strong><br />
amounted to MSEK 194.7 (MSEK 124.3). This amount includes tariff<br />
income from the United Kingdom, France and the Netherlands<br />
and income for maintaining strategic inventory levels in France.<br />
Tariff income has increased from the comparative period of 2004<br />
primarily due to the increased production from the Broom fi eld in<br />
the United Kingdom.<br />
Sales for the year ended 31 December <strong>2005</strong> were comprised as<br />
follows:<br />
Sales<br />
Average price per barrel *<br />
expressed in USD<br />
United Kingdom<br />
- Quantity in boe<br />
- Average price per boe<br />
France<br />
- Quantity in boe<br />
- Average price per boe<br />
Norway<br />
- Quantity in boe<br />
- Average price per boe<br />
Netherlands<br />
- Quantity in boe<br />
- Average price per boe<br />
Indonesia<br />
- Quantity in boe<br />
- Average price per boe<br />
Tunisia<br />
- Quantity in boe<br />
- Average price per boe<br />
Ireland<br />
- Quantity in boe<br />
- Average price per boe<br />
Total<br />
- Quantity in boe<br />
- Average price per boe<br />
Group<br />
<strong>2005</strong><br />
7,240,996<br />
54.56<br />
1,563,840<br />
53.75<br />
372,356<br />
51.45<br />
855,397<br />
37.45<br />
495,852<br />
48.90<br />
328,627<br />
62.53<br />
24,107<br />
33.31<br />
10,881,175<br />
52.93<br />
Group<br />
2004<br />
3,674,000<br />
41.75<br />
1,563,576<br />
36.90<br />
870,746<br />
37.92<br />
948,548<br />
25.43<br />
579,522<br />
34.79<br />
677,923<br />
38.65<br />
121,371<br />
26.24<br />
8,435,686<br />
37.67<br />
* The average sales price per barrel is excluding the result on the hedge settlement.<br />
Income from Venezuela is derived by way of a service fee and<br />
interest income. For the year ended 31 December <strong>2005</strong>, the<br />
service fee earned by <strong>Lundin</strong> <strong>Petroleum</strong> amounted to USD 22.16<br />
(USD 18.67) per barrel for the 771,146 boe (837,648 boe) that were<br />
sold.