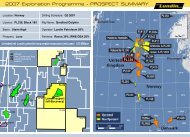
Annual Report 2005 (6 MB) - Lundin Petroleum
Annual Report 2005 (6 MB) - Lundin Petroleum
Annual Report 2005 (6 MB) - Lundin Petroleum

You also want an ePaper? Increase the reach of your titles
YUMPU automatically turns print PDFs into web optimized ePapers that Google loves.
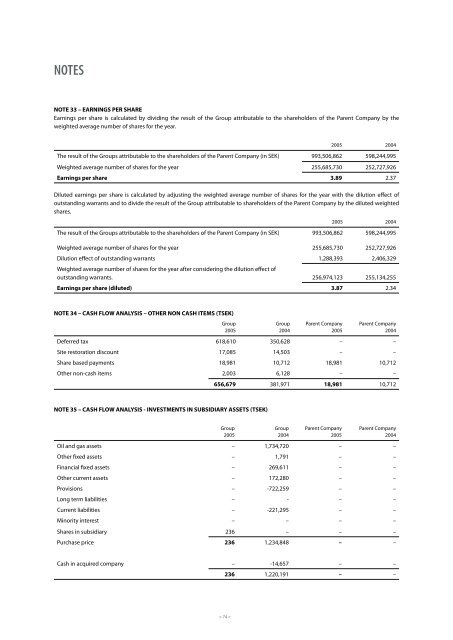
NOTES<br />
NOTE 33 – EARNINGS PER SHARE<br />
Earnings per share is calculated by dividing the result of the Group attributable to the shareholders of the Parent Company by the<br />
weighted average number of shares for the year.<br />
> 74 <<br />
<strong>2005</strong> 2004<br />
The result of the Groups attributable to the shareholders of the Parent Company (in SEK) 993,506,862 598,244,995<br />
Weighted average number of shares for the year 255,685,730 252,727,926<br />
Earnings per share 3.89 2.37<br />
Diluted earnings per share is calculated by adjusting the weighted average number of shares for the year with the dilution eff ect of<br />
outstanding warrants and to divide the result of the Group attributable to shareholders of the Parent Company by the diluted weighted<br />
shares.<br />
<strong>2005</strong> 2004<br />
The result of the Groups attributable to the shareholders of the Parent Company (in SEK) 993,506,862 598,244,995<br />
Weighted average number of shares for the year 255,685,730 252,727,926<br />
Dilution eff ect of outstanding warrants<br />
Weighted average number of shares for the year after considering the dilution eff ect of<br />
1,288,393 2,406,329<br />
outstanding warrants. 256,974,123 255,134,255<br />
Earnings per share (diluted) 3.87 2.34<br />
NOTE 34 – CASH FLOW ANALYSIS – OTHER NON CASH ITEMS (TSEK)<br />
Group<br />
<strong>2005</strong><br />
Group<br />
2004<br />
Parent Company<br />
<strong>2005</strong><br />
Parent Company<br />
2004<br />
Deferred tax 618,610 350,628 – –<br />
Site restoration discount 17,085 14,503 – –<br />
Share based payments 18,981 10,712 18,981 10,712<br />
Other non-cash items 2,003 6,128 – –<br />
656,679 381,971 18,981 10,712<br />
NOTE 35 – CASH FLOW ANALYSIS - INVESTMENTS IN SUBSIDIARY ASSETS (TSEK)<br />
Group<br />
<strong>2005</strong><br />
Group<br />
2004<br />
Parent Company<br />
<strong>2005</strong><br />
Parent Company<br />
2004<br />
Oil and gas assets – 1,734,720 – –<br />
Other fi xed assets – 1,791 – –<br />
Financial fi xed assets – 269,611 – –<br />
Other current assets – 172,280 – –<br />
Provisions – -722,259 – –<br />
Long term liabilities – - – –<br />
Current liabilities – -221,295 – –<br />
Minority interest – – – –<br />
Shares in subsidiary 236 – – –<br />
Purchase price 236 1,234,848 – –<br />
Cash in acquired company – -14,657 – –<br />
236 1,220,191 – –