Does Tail Dependence Make A Difference In the ... - Boston College
Does Tail Dependence Make A Difference In the ... - Boston College
Does Tail Dependence Make A Difference In the ... - Boston College

Create successful ePaper yourself
Turn your PDF publications into a flip-book with our unique Google optimized e-Paper software.
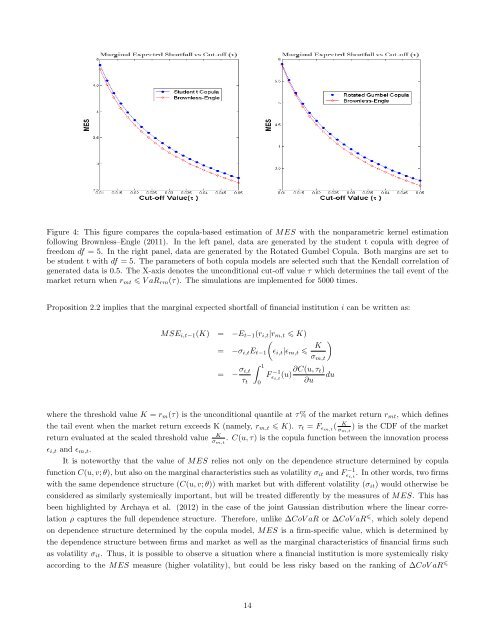
Figure 4: This figure compares <strong>the</strong> copula-based estimation of MES with <strong>the</strong> nonparametric kernel estimation<br />
following Brownless–Engle (2011). <strong>In</strong> <strong>the</strong> left panel, data are generated by <strong>the</strong> student t copula with degree of<br />
freedom df = 5. <strong>In</strong> <strong>the</strong> right panel, data are generated by <strong>the</strong> Rotated Gumbel Copula. Both margins are set to<br />
be student t with df = 5. The parameters of both copula models are selected such that <strong>the</strong> Kendall correlation of<br />
generated data is 0.5. The X-axis denotes <strong>the</strong> unconditional cut-off value τ which determines <strong>the</strong> tail event of <strong>the</strong><br />
market return when r mt V aR rm (τ). The simulations are implemented for 5000 times.<br />
Proposition 2.2 implies that <strong>the</strong> marginal expected shortfall of financial institution i can be written as:<br />
MSE i,t−1 (K) = −E t−1 (r i,t |r m,t K)<br />
(<br />
= −σ i,t E t−1 ɛ i,t |ɛ m,t <br />
K )<br />
σ m,t<br />
= − σ ∫ 1<br />
i,t<br />
τ t<br />
0<br />
ɛ i,t<br />
(u) ∂C(u, τ t)<br />
du<br />
∂u<br />
F −1<br />
where <strong>the</strong> threshold value K = r m (τ) is <strong>the</strong> unconditional quantile at τ% of <strong>the</strong> market return r mt , which defines<br />
<strong>the</strong> tail event when <strong>the</strong> market return exceeds K (namely, r m,t K). τ t = F ɛm,t ( K<br />
σ m,t<br />
) is <strong>the</strong> CDF of <strong>the</strong> market<br />
return evaluated at <strong>the</strong> scaled threshold value<br />
K<br />
σ m,t<br />
. C(u, τ) is <strong>the</strong> copula function between <strong>the</strong> innovation process<br />
ɛ i,t and ɛ m,t .<br />
It is noteworthy that <strong>the</strong> value of MES relies not only on <strong>the</strong> dependence structure determined by copula<br />
function C(u, v; θ), but also on <strong>the</strong> marginal characteristics such as volatility σ it and F −1<br />
ɛ i,t<br />
. <strong>In</strong> o<strong>the</strong>r words, two firms<br />
with <strong>the</strong> same dependence structure (C(u, v; θ)) with market but with different volatility (σ it ) would o<strong>the</strong>rwise be<br />
considered as similarly systemically important, but will be treated differently by <strong>the</strong> measures of MES. This has<br />
been highlighted by Archaya et al. (2012) in <strong>the</strong> case of <strong>the</strong> joint Gaussian distribution where <strong>the</strong> linear correlation<br />
ρ captures <strong>the</strong> full dependence structure. Therefore, unlike ∆CoV aR or ∆CoV aR , which solely depend<br />
on dependence structure determined by <strong>the</strong> copula model, MES is a firm-specific value, which is determined by<br />
<strong>the</strong> dependence structure between firms and market as well as <strong>the</strong> marginal characteristics of financial firms such<br />
as volatility σ it . Thus, it is possible to observe a situation where a financial institution is more systemically risky<br />
according to <strong>the</strong> MES measure (higher volatility), but could be less risky based on <strong>the</strong> ranking of ∆CoV aR <br />
14