Does Tail Dependence Make A Difference In the ... - Boston College
Does Tail Dependence Make A Difference In the ... - Boston College
Does Tail Dependence Make A Difference In the ... - Boston College
Create successful ePaper yourself
Turn your PDF publications into a flip-book with our unique Google optimized e-Paper software.
1 <strong>In</strong>troduction<br />
The financial crisis that occurred during 2007/2009 has spurred intensified research attempting to understand<br />
<strong>the</strong> interdependence of risk factors and <strong>the</strong> fragility of <strong>the</strong> financial system. <strong>In</strong> <strong>the</strong> past few years, <strong>the</strong><br />
distress associated with some individual financial institutions has spread throughout <strong>the</strong> entire financial system.<br />
An individual financial institution is considered of systemic importance 1 if its distress or failure increases <strong>the</strong> likelihood<br />
that o<strong>the</strong>r firms will go bankrupt and threatens <strong>the</strong> stability of <strong>the</strong> entire system, ei<strong>the</strong>r due to its size<br />
or its interconnectedness with <strong>the</strong> rest of <strong>the</strong> financial industry. Basel III had proposed a capital surcharge for<br />
Systemically Important Financial <strong>In</strong>stitutions (SIFIs). <strong>In</strong> December 2011, <strong>the</strong> Fed introduced such a surcharge<br />
for eight banks: Bank of America, Bank of New York Mellon, Citigroup, Goldman Sachs, JPMorgan, Morgan<br />
Stanley, State Street and Wells Fargo. As a result, <strong>the</strong> questions of how to accurately quantify <strong>the</strong> risk of spill-over<br />
effects and how to identify systemically important financial institutions have become crucial for macro-prudential<br />
regulators and supervision authorities.<br />
Value at Risk (VaR) and Expected Shortfall (ES), <strong>the</strong> most widely-used risk measures by financial institutions<br />
and academic researchers, have been criticized for <strong>the</strong>ir failure to take into account <strong>the</strong> escalated risk of spill-over<br />
effects among financial institutions during episodes of financial crisis. Ang, Chen and Xing (2006) documented<br />
that conditional correlations between assets are much higher in downturns of <strong>the</strong> financial market. More recently,<br />
Brunnmeier and Petersen (2008) show that <strong>the</strong> negative feedback of a “loss spiral” or “margin spiral” leads to<br />
<strong>the</strong> joint depression of asset prices. Systemic risk arises because of increasing co-movement and linkages among<br />
financial institutions’ assets and liabilities during a crisis. Therefore micro-prudential regulation, which historically<br />
focused on a bank’s risk in isolation, is not adequate to contain <strong>the</strong> contagion effects of an extreme tail event 2 .<br />
However, <strong>the</strong> co-movement of downside risk for financial institutions during a financial crisis cannot be completely<br />
captured by Pearson’s correlation ρ, which only provides <strong>the</strong> linear dependence but disregards nonlinear<br />
dependence between asset prices. It is widely accepted that <strong>the</strong> linear correlation ρ is inadequate to characterize<br />
<strong>the</strong> full dependence structure of non-normally distributed random variables such as <strong>the</strong> daily returns of financial<br />
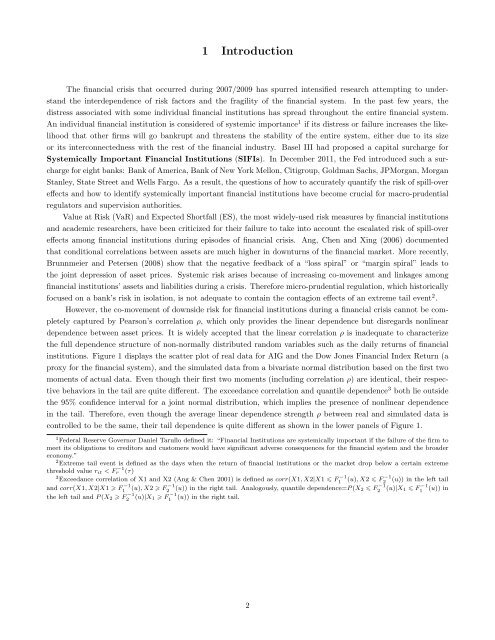
institutions. Figure 1 displays <strong>the</strong> scatter plot of real data for AIG and <strong>the</strong> Dow Jones Financial <strong>In</strong>dex Return (a<br />
proxy for <strong>the</strong> financial system), and <strong>the</strong> simulated data from a bivariate normal distribution based on <strong>the</strong> first two<br />
moments of actual data. Even though <strong>the</strong>ir first two moments (including correlation ρ) are identical, <strong>the</strong>ir respective<br />
behaviors in <strong>the</strong> tail are quite different. The exceedance correlation and quantile dependence 3 both lie outside<br />
<strong>the</strong> 95% confidence interval for a joint normal distribution, which implies <strong>the</strong> presence of nonlinear dependence<br />
in <strong>the</strong> tail. Therefore, even though <strong>the</strong> average linear dependence strength ρ between real and simulated data is<br />
controlled to be <strong>the</strong> same, <strong>the</strong>ir tail dependence is quite different as shown in <strong>the</strong> lower panels of Figure 1.<br />
1 Federal Reserve Governor Daniel Tarullo defined it: “Financial <strong>In</strong>stitutions are systemically important if <strong>the</strong> failure of <strong>the</strong> firm to<br />
meet its obligations to creditors and customers would have significant adverse consequences for <strong>the</strong> financial system and <strong>the</strong> broader<br />
economy.”<br />
2 Extreme tail event is defined as <strong>the</strong> days when <strong>the</strong> return of financial institutions or <strong>the</strong> market drop below a certain extreme<br />
threshold value r it < Fr<br />
−1 (τ)<br />
3 Exceedance correlation of X1 and X2 (Ang & Chen 2001) is defined as corr(X1, X2|X1 F −1<br />
1 (u), X2 F −1<br />
2 (u)) in <strong>the</strong> left tail<br />
1 (u)) in<br />
and corr(X1, X2|X1 F −1<br />
1 (u), X2 F −1<br />
2 (u)) in <strong>the</strong> right tail. Analogously, quantile dependence=P (X 2 F −1<br />
2 (u)|X 1 F −1<br />
<strong>the</strong> left tail and P (X 2 F −1<br />
2 (u)|X 1 F −1<br />
1 (u)) in <strong>the</strong> right tail.<br />
2


