Mastering product complexity (PDF, 3316 KB) - Roland Berger
Mastering product complexity (PDF, 3316 KB) - Roland Berger
Mastering product complexity (PDF, 3316 KB) - Roland Berger
You also want an ePaper? Increase the reach of your titles
YUMPU automatically turns print PDFs into web optimized ePapers that Google loves.
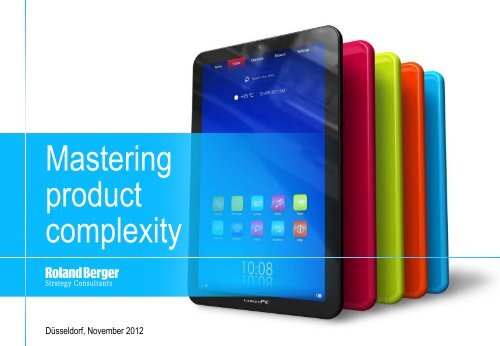
<strong>Mastering</strong><br />
<strong>product</strong><br />
<strong>complexity</strong><br />
Düsseldorf, November 2012
2<br />
Contents<br />
Page<br />
A. Key findings 3<br />
B. Examples of <strong>product</strong> <strong>complexity</strong> management in practice 17<br />
1. Customer-oriented car retailing 18<br />
2. Modularization strategy for a leading car manufacturer 23<br />
3. Complexity reduction for an FMCG company 31<br />
4. Product value management for a leading consumer goods manufacturer 38<br />
© <strong>Roland</strong> <strong>Berger</strong> Strategy Consultants GmbH
A.<br />
Key findings
4<br />
A. KEY FINDINGS<br />
Our study shows how different industries are coping with customer<br />
appetite for differentiation<br />
1<br />
Complexity has increased dramatically: The variety of <strong>product</strong>s has more than doubled in the past<br />
15 years, while <strong>product</strong> lifecycles have shortened significantly (by about 25%)<br />
2<br />
This raises challenges for manufacturers: Product variety drives costs throughout the entire value<br />
chain. Inventory management, more volatile demand and differentiation in customer requirements<br />
are key issues<br />
3<br />
Cross-industry comparison reveals different performance levels: In the discrete industries,<br />
automotive leads the field in <strong>product</strong> <strong>complexity</strong> management, while FMCG is the most advanced of<br />
the process industries<br />
4<br />
Four major optimization approaches have been confirmed across industry segments:<br />
Supply chain segmentation, supply chain integration, <strong>product</strong>ion flexibility and <strong>product</strong> structure<br />
optimization all rank as highly relevant. Although implementation still lags behind overall, automotive<br />
and FMCG are the most advanced industries in this respect. Other industries should adopt the best<br />
practices developed there<br />
5<br />
Huge savings potential: Examples in the automotive and consumer goods industries show that<br />
good <strong>complexity</strong> management reduces <strong>product</strong>ion and sourcing costs by roughly 2.5-3.5%.<br />
Machinery companies worldwide could save approx. EUR 39-54 bn, chemical companies EUR 29-49<br />
bn and the pharmaceutical industry EUR 6-9 bn
5<br />
A. KEY FINDINGS<br />
Product variety has more than doubled in the past 15 years –<br />
Product lifecycles have shortened by about 25%<br />
Increase of <strong>product</strong> variety across all industries 1)<br />
1<br />
250%<br />
200%<br />
220%<br />
185%<br />
250%<br />
215%<br />
No. of sales <strong>product</strong>s<br />
No. of raw materials and<br />
components<br />
> Complexity has increased<br />
dramatically. Product variety<br />
more than doubled between<br />
1997 and 2012, while the<br />
number of raw materials and<br />
components increased only to a<br />
lesser extent<br />
150%<br />
100%<br />
50%<br />
76%<br />
70%<br />
Duration of <strong>product</strong><br />
lifecycle<br />
> The smaller rate of increase in<br />
raw materials and components<br />
is due to the standardization and<br />
modularization efforts of leading<br />
industries such as automotive<br />
and FMCG<br />
0<br />
1997 2002 2007 2012 2015<br />
1) Automotive, chemicals, machinery, FMCG, pharmaceuticals
6<br />
A. KEY FINDINGS<br />
Increasing <strong>product</strong> variety drives costs and value – Operations and<br />
Sales have different views<br />
Cost and value of <strong>product</strong> variety<br />
2<br />
COST Versus VALUE<br />
"Operations view" on <strong>product</strong> variety<br />
> Higher raw material stock levels<br />
> Smaller purchasing lot sizes<br />
> More changeovers in <strong>product</strong>ion<br />
(scrap, downtime)<br />
> Higher stock levels of finished goods<br />
> More <strong>complexity</strong> in logistics<br />
> Higher planning <strong>complexity</strong><br />
> Lower service level<br />
> …<br />
"Sales view" on <strong>product</strong> variety<br />
> Conquer new customer groups<br />
> Have a complete portfolio<br />
(no gateway for competitors)<br />
> Improve brand image<br />
> Develop new <strong>product</strong> to be profitable in the<br />
medium/long term<br />
> Retailers demand complete <strong>product</strong><br />
portfolio<br />
> …<br />
> Increasing <strong>product</strong> variety drives<br />
value chain costs<br />
> On the other hand, <strong>product</strong><br />
variety is a key differentiator in<br />
the market. Using it can unlock<br />
further sales potential<br />
"You can paint it any color, as long<br />
as it's black."<br />
H. Ford<br />
"Endless choice is creating<br />
unlimited demand"<br />
C. Anderson
7<br />
A. KEY FINDINGS<br />
Product variety and ever shorter <strong>product</strong> lifecycles push up costs<br />
throughout the entire value chain<br />
Product variety costs in the value chain<br />
2<br />
Product<br />
development<br />
Planning<br />
Procurement<br />
Manufacturing<br />
Warehousing<br />
& distribution<br />
Marketing &<br />
sales<br />
> Additional<br />
design<br />
drawings<br />
> Additional bills<br />
of materials<br />
> More tests<br />
> Lower<br />
<strong>product</strong>ivity<br />
> Market testing<br />
> Product specs<br />
> Bill of<br />
materials<br />
> Decreased<br />
effectiveness<br />
– Multiple<br />
tasks<br />
– Crisis<br />
management<br />
> Systems maintenance<br />
> Forecasting<br />
> Planning tasks<br />
> Higher<br />
purchase<br />
prices on<br />
broader range<br />
of materials<br />
> Higher raw<br />
materials<br />
stocks and<br />
write-offs<br />
> Increased<br />
handling and<br />
inspection<br />
costs<br />
> Packaging<br />
> Scheduling<br />
> More frequent<br />
downtime<br />
– Changeover<br />
– Processrelated<br />
problems<br />
> Higher waste<br />
> Higher WIP 1)<br />
> Additional<br />
tools<br />
> Additional<br />
work<br />
schedules<br />
> More complex<br />
<strong>product</strong>ion<br />
control<br />
> Increased<br />
space and<br />
labor<br />
> Higher<br />
inventory<br />
levels (e.g.,<br />
safety stocks)<br />
> Increased<br />
handling and<br />
shipping costs<br />
(smaller<br />
quantities)<br />
> Inventories<br />
> Transport cost<br />
accounting<br />
> Additional<br />
staff training<br />
> Additional<br />
sales<br />
materials<br />
> Higher promotion<br />
costs and<br />
write-offs<br />
> More mistakes<br />
in order<br />
processing<br />
> Documentation<br />
> Availability/<br />
service level<br />
> Samples cost<br />
increase<br />
1) Work in progress
8<br />
A. KEY FINDINGS<br />
We identified inventory management, differentiation in customer<br />
requirements and more volatile demand as the key challenges facing<br />
manufacturers<br />
Relevance of <strong>complexity</strong> related challenges across all industries<br />
2<br />
Low<br />
1<br />
High<br />
3 4<br />
5<br />
1<br />
Increasing importance of inventory<br />
management<br />
4.1<br />
2<br />
3<br />
4<br />
5<br />
Stronger differentiation in customer<br />
requirements (delivery time, flexibility, etc.)<br />
More volatile demand driven by a more<br />
fragmented <strong>product</strong> portfolio<br />
Greater <strong>complexity</strong> in global supply chains<br />
(suppliers, customers)<br />
Rising process costs caused by more<br />
complex planning<br />
3.6<br />
3.5<br />
3.4<br />
3.3<br />
6<br />
More frequent <strong>product</strong> phase-in and phaseout,<br />
plus shorter <strong>product</strong> lifecycles<br />
3.1
9<br />
A. KEY FINDINGS<br />
In the discrete industries, automotive leads in mastering <strong>product</strong><br />
<strong>complexity</strong><br />
Increase of <strong>product</strong> variety in discrete industries [%]<br />
AUTOMOTIVE<br />
MACHINERY<br />
3<br />
Heavy investment in standardization<br />
and modularization in recent years<br />
has taken the automotive industry to<br />
a very mature level of <strong>product</strong><br />
<strong>complexity</strong> management<br />
450<br />
400<br />
350<br />
300<br />
250<br />
200<br />
170% 189%<br />
150<br />
127% 129%<br />
100<br />
91%<br />
93%<br />
50<br />
0<br />
'97 '02 '07 '12 '15<br />
Companies in the machinery<br />
industry started later but are<br />
adopting standardization and<br />
modularization concepts to cope<br />
with <strong>complexity</strong><br />
450<br />
400<br />
350<br />
300<br />
257%<br />
250<br />
216% 217%<br />
200<br />
150<br />
190%<br />
100<br />
50<br />
81% 76%<br />
0<br />
'97 '02 '07 '12 '15<br />
> The automotive industry started<br />
launching standardization and<br />
modularization efforts early on<br />
to fight increasing variety in raw<br />
materials and components.<br />
Machinery companies, on the<br />
other hand, started to optimize<br />
their <strong>product</strong> structure only in the<br />
past few years<br />
Lead industry<br />
No. of sales <strong>product</strong>s<br />
No. of raw materials and components<br />
Duration of <strong>product</strong> lifecycle
10<br />
A. KEY FINDINGS<br />
FMCG is most advanced in <strong>product</strong> <strong>complexity</strong> management in the<br />
process industries<br />
Increase of <strong>product</strong> variety in process industries [%]<br />
FMCG<br />
CHEMICALS<br />
PHARMA<br />
3<br />
In light of the economic crisis,<br />
FMCG companies have focused<br />
even more strongly on <strong>product</strong><br />
<strong>complexity</strong> management and are<br />
now ahead of other processes<br />
industries<br />
450<br />
400<br />
350<br />
300<br />
250<br />
200<br />
162% 163%<br />
150<br />
140%<br />
100<br />
135%<br />
50<br />
46%<br />
54%<br />
0<br />
'97 '02 '07 '12 '15<br />
Only in the past 10 years, strategic<br />
customer focus has led chemical<br />
companies to diversify their <strong>product</strong><br />
portfolio – Little <strong>complexity</strong><br />
management in place yet<br />
450<br />
442%<br />
400<br />
350<br />
313%<br />
300<br />
279%<br />
250<br />
204%<br />
200<br />
150<br />
100<br />
50<br />
50%<br />
63%<br />
0<br />
'97 '02 '07 '12 '15<br />
In the past, pharmaceutical<br />
companies have faced less severe<br />
economic pressure, and have<br />
therefore so far done less to reduce<br />
<strong>complexity</strong><br />
450<br />
400<br />
350<br />
315%<br />
300<br />
268%<br />
250<br />
225%<br />
223%<br />
200<br />
150<br />
100<br />
88%<br />
92%<br />
50<br />
0<br />
'97 '02 '07 '12 '15<br />
> The chemicals industry is late in<br />
the process – Product variety<br />
has exploded in the past 10<br />
years, little <strong>complexity</strong><br />
management in place yet<br />
> At pharmaceutical companies,<br />
raw materials/components have<br />
increased more strongly than<br />
sales <strong>product</strong>s due to a need for<br />
second sources and regulatory<br />
requirements (e.g. differentiated<br />
leaflets)<br />
Lead industry<br />
No. of sales <strong>product</strong>s<br />
No. of raw materials and components<br />
Duration of <strong>product</strong> lifecycle
11<br />
A. KEY FINDINGS<br />
Four optimization approaches improve companies' flexibility and<br />
responsiveness in light of increasing <strong>product</strong> variety<br />
4<br />
PRODUCT<br />
SUPPLY CHAIN<br />
PRODUCTION<br />
Approaches to optimization<br />
Approach Principle Effect<br />
PRODUCT<br />
STRUCTURE<br />
OPTIMIZATION 1)<br />
SUPPLY CHAIN<br />
SEGMENTATION<br />
SUPPLY CHAIN<br />
INTEGRATION<br />
PRODUCTION<br />
FLEXIBILITY<br />
> Share and increase common parts,<br />
e.g. through option pricing, and move<br />
the point of <strong>product</strong> differentiation<br />
toward the end of the supply chain<br />
> Split and adapt supply chains in line<br />
with customer requirements<br />
> Establish responsive supply chain<br />
design for highly differentiated<br />
<strong>product</strong> groups and volatile demand<br />
> Integrate processes and information<br />
flows across functions and supply<br />
chain partners<br />
> Establish end-to-end KPI system<br />
and common incentive system<br />
> Segment <strong>product</strong>ion and increase<br />
flexibility<br />
> Reduce cycle times in order<br />
processing, <strong>product</strong>ion and logistics<br />
> Economies of scale in upstream<br />
supply chain<br />
> Greater forecast accuracy for semifinished<br />
<strong>product</strong>s and enabling<br />
function for build-to-order strategies<br />
> Supply chain design fits <strong>product</strong> and<br />
demand characteristics<br />
> Superior supply chain performance<br />
> Greater transparency regarding<br />
supply performance<br />
> Integrated control makes firms more<br />
responsive to shifts in demand and<br />
optimizes global performance<br />
> Reduced delivery lead times<br />
> Larger part of supply chain can be<br />
controlled based on customer order<br />
1) Product portfolio streamlining not in scope, since a differentiated <strong>product</strong> portfolio is seen as a given framework condition<br />
for which appropriate <strong>complexity</strong> levers need to be established
12<br />
A. KEY FINDINGS<br />
Detailed levers for mastering <strong>product</strong> variety are addressed in our<br />
study<br />
4<br />
PRODUCT<br />
SUPPLY CHAIN<br />
Overview of levers<br />
Optimization<br />
approach<br />
PRODUCT<br />
STRUCTURE<br />
OPTIMIZATION<br />
SUPPLY CHAIN<br />
SEGMENTATION<br />
Levers<br />
1 Sharing common parts and processes<br />
2 Adopting modular <strong>product</strong> structures<br />
3 Differentiating <strong>product</strong>s after <strong>product</strong>ion, packaging or logistics processes<br />
1 Segmenting the <strong>product</strong> portfolio and identifying market characteristics for differentiated <strong>product</strong>s<br />
2 Segmenting and adopting the supply chain for differentiated processes<br />
PRODUCTION<br />
SUPPLY CHAIN<br />
INTEGRATION<br />
PRODUCTION<br />
FLEXIBILITY<br />
1 Measuring speed, efficiency and flexibility with a set of end-to-end performance KPIs<br />
2 Creating common incentives for all functions; SC partners to optimize supply chain performance<br />
3 Aligning roles and responsibilities to optimize collaboration between SC functions and partners<br />
4 Integrating global IT systems and sharing data platforms with customers and suppliers<br />
5 Operating supply hubs with vendor-managed inventory close to assembly plants<br />
1 Segmenting <strong>product</strong>ion and flexibilization of manufacturing equipment<br />
2 Reducing order throughput time<br />
3 Executing processes simultaneously
13<br />
A. KEY FINDINGS<br />
Relevance of optimization approaches was confirmed across all industry<br />
segments – Implementation still lags behind<br />
Optimization approaches across all industries<br />
4<br />
Low<br />
High<br />
1 3 4 5<br />
SUPPLY CHAIN SEGMENTATION<br />
Split and adapt supply chains in line with customer<br />
requirements<br />
SUPPLY CHAIN INTEGRATION<br />
Integrate processes and information flows across<br />
functions and supply chain partners<br />
PRODUCTION FLEXIBILITY<br />
Increase <strong>product</strong>ion flexibility and reduce cycle<br />
times in order processing and <strong>product</strong>ion<br />
PRODUCT STRUCTURE OPTIMIZATION<br />
Share common parts and move the point of<br />
<strong>product</strong> differentiation towards the end of the value<br />
chain<br />
2.7<br />
2.6<br />
2.8<br />
2.6<br />
3.4<br />
3.7<br />
3.7<br />
3.9<br />
Relevance<br />
Degree of implementation
14<br />
A. KEY FINDINGS<br />
The lead industries automotive and FMCG are superior in mastering<br />
<strong>complexity</strong> – Other industries can apply best practices to catch up<br />
Degree of implementation by industry<br />
DISCRETE INDUSTRIES<br />
PROCESS INDUSTRIES<br />
4<br />
SUPPLY CHAIN<br />
SEGMENTATION<br />
MACHI-<br />
NERY<br />
AUTO-<br />
MOTIVE<br />
CHEMI-<br />
CALS<br />
PHARMA<br />
FMCG<br />
> Whereas in discrete industries<br />
car companies are at the<br />
forefront in terms of level of<br />
implementation, in the process<br />
industries FMCG companies<br />
have reached a very high level<br />
of implementation<br />
SUPPLY CHAIN<br />
INTEGRATION<br />
PRODUCTION<br />
FLEXIBILITY<br />
PRODUCT<br />
STRUCTURE<br />
OPTIMIZATION<br />
> Machinery, chemical and<br />
pharmaceutical companies<br />
can learn from the best<br />
practices of front-runner<br />
industries to catch up with<br />
implementation, especially in<br />
terms of optimizing <strong>product</strong><br />
structures and supply chain<br />
integration<br />
Lead industry<br />
1 2 3 4 5 1 2 3 4 5<br />
Low<br />
High Low<br />
High
15<br />
A. KEY FINDINGS<br />
Automotive and FMCG demonstrate the savings impact of <strong>complexity</strong><br />
management – Huge potential exists for other industries too<br />
Examples<br />
5<br />
Car manufacturer<br />
Diary producer<br />
Chocolate manufacturer<br />
COGS reduction<br />
[%]<br />
Modular construction based<br />
on MQB platform and further<br />
standardization measures<br />
3.0%<br />
Complexity reduction based<br />
on single variant cost model<br />
2.8%<br />
Complexity reduction based<br />
on single variant cost model<br />
3.2%<br />
Approximation<br />
Projection for other<br />
global industries<br />
MACHINERY<br />
PHARMA<br />
CHEMICALS<br />
COGS reduction<br />
[EUR bn]<br />
[%]<br />
39-54<br />
6-9<br />
29-49<br />
(2.5-3.5%) (2.5-3.5%) (1.5-2.5%)
16<br />
A. KEY FINDINGS<br />
We investigated European companies in five industry clusters<br />
METHODOLOGY<br />
> Survey based on structured questionnaire<br />
> Three sections:<br />
– Development of <strong>complexity</strong> indicators<br />
from 1997 through 2015<br />
- No. of different sales <strong>product</strong>s<br />
- No. of different raw materials and<br />
components<br />
- Product lifecycle duration<br />
– Relevance of challenges to supply<br />
chain management<br />
– Relevance and degree of<br />
implementation of supply chain levers<br />
> Results, summarized on a global level and<br />
by industry<br />
SCOPE<br />
> Europe<br />
> More than 100 respondents<br />
> Five industry clusters<br />
Pharmaceuticals<br />
Chemicals<br />
Automotive<br />
16%<br />
17%<br />
13%<br />
21%<br />
33%<br />
FMCG<br />
Machinery
B.<br />
Examples of<br />
<strong>product</strong> <strong>complexity</strong><br />
management in<br />
practice
B.1<br />
Customer-oriented<br />
car retailing
19<br />
B.1 CUSTOMER-ORIENTED CAR RETAILING<br />
One leading car manufacturer optimized its supply chain to enable<br />
customer-oriented retailing<br />
OBJECTIVE<br />
CHALLENGES for a car manufacturer<br />
Customer-oriented car retailing<br />
New brands<br />
1960 Product offering<br />
2015<br />
> Constantly growing model variety and <strong>complexity</strong> of<br />
<strong>product</strong> offering<br />
> Limited space at dealerships – higher number of demo<br />
cars reduces space for unused stock cars<br />
> Sales planning focus has shifted toward mix<br />
optimization and contribution – decentralized stock<br />
management unable to tap market potential<br />
"The right car for my customer, not a<br />
customer for my car"<br />
A<br />
B<br />
Centralized stock management<br />
Retail-oriented planning and ordering
20<br />
B.1 CUSTOMER-ORIENTED CAR RETAILING<br />
Customer-oriented retailing was achieved through central stock<br />
management and retail-oriented planning and ordering<br />
A<br />
Pooling cars in central warehouses and<br />
optimizing the car mix improves availability<br />
in downstream warehouses and reduces<br />
swapping costs<br />
CENTRAL STOCK MANAGEMENT<br />
Supplier<br />
Car manufacturer Central warehouse Dealers<br />
B<br />
RETAIL-ORIENTED PLANNING AND ORDERING<br />
Integrated ordering and planning process makes the order<br />
pipeline more transparent, takes account of restrictions on the<br />
<strong>product</strong>ion and supply sides and creates a feasible supply plan<br />
in line with market demand
21<br />
B.1 CUSTOMER-ORIENTED CAR RETAILING<br />
Six levers allow car stock management to be centralized<br />
LEVERS<br />
BENEFITS<br />
Central<br />
stock<br />
management<br />
A 1<br />
2<br />
Template-based configuration<br />
Stock Advisory Circle<br />
> Optimized engine, model and option mix<br />
> Increased stock variety<br />
> Fewer specification mistakes<br />
> Ensures integration of market know-how/trends and future<br />
orientation for conscious decisions<br />
> Secures dealer buy-in for template generation process<br />
3<br />
Central compound logic<br />
> Reduces total stock<br />
> Increases variety offered to customer<br />
> Lowers amount of aging stock<br />
4<br />
Sales front-end enhancement<br />
> Optimized customer needs assessment for search inquiry<br />
5<br />
Pipeline search<br />
> Optimized offer for customer according to preferences<br />
> No or fewer ageing cars<br />
> FIFO principle enforced<br />
6<br />
Aging stock management<br />
> Aging stock more transparent<br />
> Incentive to sell aging stock (e.g. Dutch auction)
22<br />
B.1 CUSTOMER-ORIENTED CAR RETAILING<br />
Retail-oriented planning and ordering is based on full process<br />
integration to better coordinate demand and supply side factors<br />
LEVERS<br />
BENEFITS<br />
Retailoriented<br />
planning<br />
and<br />
ordering<br />
B<br />
1<br />
2<br />
Template-based Retail oriented ordering configuration<br />
Volume planning process<br />
> Orders can be better prioritized (no more automatic build-to-order<br />
prioritization)<br />
> Planning & order pipeline more transparent<br />
> Increased market transparency<br />
> Reduced planning effort<br />
3<br />
Option planning<br />
> Increased planning quality and efficiency<br />
> Restrictions are more transparent and can be detected earlier to<br />
reduce order delays<br />
4<br />
Market roundtable philosophy<br />
> Market trends and opportunities integrated into the planning process<br />
> Proactive measures coordinated to ensure volume and financial<br />
targets
B.2<br />
Modularization<br />
strategy for a<br />
leading car<br />
manufacturer
Magnitude of <strong>product</strong><br />
standardization impact<br />
24<br />
B.2 MODULARIZATION STRATEGY FOR A LEADING CAR MANUFACTURER<br />
Depending on their culture and past standardization strategy, OEMs<br />
pursue different modularization pathways<br />
OEM maturity level in modularization strategies<br />
Sharing<br />
complex components<br />
across<br />
platforms<br />
Most advanced<br />
OEMs<br />
Sharing<br />
complex components<br />
on one<br />
platform<br />
Sharing simple<br />
components<br />
PATHWAY<br />
1 Carry-over<br />
approaches<br />
2 Platform<br />
approaches<br />
3 Module<br />
approaches
25<br />
B.2 MODULARIZATION STRATEGY FOR A LEADING CAR MANUFACTURER<br />
The different pathways address different scopes of standardization<br />
Modularization pathways<br />
PATHWAY<br />
1 Carry-over<br />
approaches<br />
2 Platform<br />
approaches<br />
3 Module<br />
approaches<br />
SCOPE Basic components Common technical perimeter<br />
for several models<br />
(unperceived underbody)<br />
Complex systems or<br />
subsystems dedicated to an<br />
entire function<br />
PRINCIPLE<br />
Same component used<br />
across models or for model<br />
renewals to facilitate<br />
development and increase<br />
commonality<br />
Platforms with a maximum<br />
number of common parts<br />
shared between different<br />
models & brands<br />
Vehicle structure divided into<br />
modules, sharing standard<br />
interfaces and base<br />
components but allowing<br />
differentiation within variants<br />
GOVERNANCE<br />
Standardization plans<br />
managed by technical<br />
departments<br />
Engineering organized<br />
according to technical<br />
platforms<br />
Modular architecture<br />
organization
26<br />
B.2 MODULARIZATION STRATEGY FOR A LEADING CAR MANUFACTURER<br />
Modularization generates cost savings and speeds up time to market<br />
Modularization effects<br />
MODULARIZATION<br />
1<br />
Significant cost reduction in purchasing & manufacturing<br />
2<br />
Increased number and frequency of new model launches<br />
3<br />
Reduction of time to market and associated R&D spending<br />
4<br />
Improvement of <strong>product</strong>/process quality<br />
5<br />
Enables global engineering with module expert centers
27<br />
B.2 MODULARIZATION STRATEGY FOR A LEADING CAR MANUFACTURER<br />
A leading car manufacturer has successfully introduced a<br />
modularization strategy<br />
PROJECT PROFILE<br />
> Client: Leading car manufacturer<br />
> Goal: Significantly increase reuse<br />
of parts across vehicle lines<br />
by establishing a modular<br />
approach<br />
> Scope covered: All major<br />
modules and vehicle lines<br />
> <strong>Roland</strong> <strong>Berger</strong> support:<br />
Concept phase and implementation,<br />
in total more than<br />
1 year<br />
> Results I: Modular shelf<br />
established, variant/part numbers<br />
significantly reduced<br />
> Results II: Organization<br />
transformed – new methodology,<br />
processes and cross-functional<br />
collaboration established<br />
Modules developed<br />
specifically for a vehicle<br />
line/brand<br />
Vehicle architecture<br />
standardized<br />
Developing a module with<br />
derivatives/variants for specific<br />
standard architectures<br />
Module applied across vehicle<br />
lines/brands
28<br />
B.2 MODULARIZATION STRATEGY FOR A LEADING CAR MANUFACTURER<br />
The modularization concept is based on five elements<br />
Modularization concept<br />
1 Portfolio<br />
concept<br />
Brand, segment and<br />
<strong>product</strong> approach for<br />
the various markets<br />
2 Vehicle architecture 4 Module<br />
strategies<br />
Anchor points and interfaces<br />
designed to decouple vehicle and<br />
module development<br />
3 Functional strategies<br />
Modular shelf and<br />
cycle plan<br />
Functional requirements for vehicles,<br />
systems and modules<br />
5 Enablers<br />
Requirements for engineering framework, organization,<br />
governance and development process
29<br />
B.2 MODULARIZATION STRATEGY FOR A LEADING CAR MANUFACTURER<br />
The modular structure is the backbone of the approach<br />
Modularization scheme<br />
Modular <strong>product</strong> architecture<br />
Module substructure<br />
PRODUCT<br />
ARCHITECTURE<br />
EXTERIOR MIRROR (example)<br />
Blinker<br />
Housing<br />
MODULES<br />
(80-100)<br />
Frame<br />
Glass adjustment<br />
drive<br />
Glass<br />
SUB-<br />
MODULES<br />
(400-500)
30<br />
B.2 MODULARIZATION STRATEGY FOR A LEADING CAR MANUFACTURER<br />
The standardization of modules/components led to significant benefits<br />
Standardization/modularization – HVAC<br />
Heat<br />
exchanger<br />
Filter<br />
Fan<br />
Commonization of<br />
components<br />
Car segment 1<br />
Model 1 …<br />
Car segment 2<br />
Model 2 Model 3 Model …<br />
Step control<br />
motors<br />
Air distribution<br />
unit<br />
Fan control<br />
unit<br />
HVAC box<br />
Air distribution unit<br />
Heat exchanger<br />
Fan<br />
HVAC box<br />
Filter<br />
Fan control unit<br />
Step control motors<br />
Unique designs<br />
Part numbers<br />
Investment<br />
[EUR m/year]<br />
Variable costs<br />
[EUR/piece]<br />
7<br />
-86%<br />
1<br />
104<br />
-57%<br />
36<br />
5<br />
-40%<br />
3<br />
140<br />
-31%<br />
96<br />
> Engineering<br />
> Manufacturing<br />
– Production facilities<br />
– Tools<br />
> Material cost<br />
> Manufacturing cost<br />
> Warranty & goodwill<br />
> Logistics<br />
Actual<br />
Target
B.3<br />
Complexity<br />
reduction for an<br />
FMCG company
32<br />
B.3 COMPLEXITY REDUCTION FOR AN FMCG COMPANY<br />
For one leading FMCG manufacturer, <strong>complexity</strong> management was a<br />
key enabler to increase company performance<br />
> Performance<br />
improvement for leading<br />
chocolate manufacturer<br />
> Private label business<br />
dramatically increased<br />
<strong>complexity</strong><br />
> Of the ten identified<br />
improvement levers,<br />
<strong>complexity</strong> management<br />
was a key enabler to<br />
improve performance<br />
3<br />
R&D<br />
Target cost<br />
<strong>product</strong><br />
development<br />
Planning<br />
Controlling<br />
Administration, etc.<br />
2<br />
Product<br />
<strong>complexity</strong><br />
management<br />
Packaging<br />
development<br />
1<br />
Portfolio<br />
optimization<br />
Marketing & Sales<br />
Procurement Production Packaging Logistics<br />
STRATEGIC<br />
4 PURCHASING 5 OPERATIONS/LOGISTICAL EFFICIENCY<br />
6<br />
7<br />
COST<br />
ACCOUNTING<br />
8<br />
MASTER<br />
DATA<br />
VALUE CHAIN CONTROL<br />
9<br />
EFFICIENCY<br />
OVERHEAD<br />
Product development<br />
10<br />
SEGMEN-<br />
TATION/<br />
SYNER-<br />
GIES
Contribution margin<br />
33<br />
B.3 COMPLEXITY REDUCTION FOR AN FMCG COMPANY<br />
The company activated three levers to optimize <strong>complexity</strong><br />
Portfolio optimization<br />
1 2 3<br />
Product <strong>complexity</strong><br />
management<br />
Target cost <strong>product</strong><br />
development process<br />
DB2<br />
> Target%<br />
I<br />
Green Green Green Green<br />
Complexity reduction based on single<br />
variant cost model<br />
A target-cost-oriented process was<br />
defined<br />
DB2<br />
> 0%<br />
II<br />
Focus Focus Focus Focus<br />
Ideenfindung &<br />
-verdichtung<br />
Konzeptphase<br />
G3<br />
G3<br />
Entwicklungsund<br />
Testphase<br />
G3<br />
Einführungsphase<br />
5<br />
G4<br />
Launch und<br />
Erfolgskontrolle<br />
DB2<br />
< 0% III<br />
Exit Watch Watch Focus<br />
Grobkonzept EA<br />
Go/NoGo Liefertermin best. Erstauslieferung<br />
1 2 3 4<br />
6 7<br />
Idee Marketing-Konzept Offertkalk Absatzplan Erstproduktion<br />
Nachkalk<br />
DB1 var.<br />
< 0% IV<br />
Exit Exit Watch Watch<br />
Wirtschaftlichkeitsprüfung<br />
Wertorientierte<br />
Produktkonzeption<br />
Standardkatalog<br />
Kosten- und termingerechte<br />
Druckumsetzung<br />
Nachkalkulation<br />
D C B A<br />
< 50 TCHF > 50 TCHF > 100 TCHF > 500 TCHF<br />
< 100 TCHF < 500 TCHF<br />
Turnover<br />
Inhaltliche<br />
Koordination<br />
zwischen<br />
Projekten<br />
Detailierte<br />
Zielkostenvorgabe<br />
für Inhalt-, Pack-,<br />
Fertigungs-kosten<br />
Mengenabhängige<br />
Kalkulation aller<br />
Komponenten<br />
Ergebnisoffener<br />
Make or Buy<br />
Entscheid<br />
> Assessment of <strong>product</strong> portfolio<br />
based on contribution margin<br />
and turnover<br />
> Evaluation of scenarios for<br />
portfolio streamlining<br />
> Implementation of "exit" list<br />
> Optimization of <strong>product</strong> costs for<br />
top 25 SKUs<br />
> Product standardization across<br />
all links in value chain based on<br />
single variant cost model<br />
> Formulation of catalog for<br />
standard assortment<br />
> Implementation of a new<br />
organizational structure with a<br />
central <strong>product</strong> management<br />
department<br />
> Process integration<br />
> Adaptation of calculation design<br />
(volume-based)
34<br />
B.3 COMPLEXITY REDUCTION FOR AN FMCG COMPANY<br />
The variant tree highlights how <strong>complexity</strong> increases with each link in<br />
the value chain – 60% of SKUs represent only 20% of the total volume<br />
Variant tree analysis<br />
Chocolate bars<br />
Confectionery<br />
Cocoa mass<br />
80% of tonnage<br />
80% of tonnage<br />
[# of variants] [%] [# of variants] [%]<br />
5 83%<br />
5 83%<br />
Chocolate mass<br />
Fillings<br />
Semi-finished (unpacked)<br />
Primary packaging<br />
Secondary packaging<br />
Tertiary packaging<br />
30 37%<br />
46 45%<br />
134 31%<br />
320 45%<br />
23 35%<br />
3 21%<br />
17 31%<br />
20 34%<br />
62 25%<br />
134 31%<br />
13 27%<br />
4 29%<br />
SKU 364 39%<br />
182 45%<br />
Share of variants that account for 80% of volume produced<br />
Share of variants that account for 100% of volume produced
35<br />
B.3 COMPLEXITY REDUCTION FOR AN FMCG COMPANY<br />
The single variant cost model enables <strong>complexity</strong>-related cost<br />
increases to be evaluated<br />
Single-variant <strong>complexity</strong> cost model<br />
PURCHASING<br />
PURCHASING<br />
188 6%<br />
PLANT<br />
99 21%<br />
SUPPLY CHAIN<br />
39 34%<br />
Cocoa beans<br />
& butter<br />
Milk powder<br />
69<br />
22<br />
2%<br />
1%<br />
Cocoa<br />
mass<br />
Chocolate<br />
mass<br />
Fillings<br />
Primary<br />
packaging<br />
Semifinished<br />
Secondary<br />
packaging<br />
Tertiary<br />
packaging<br />
Co-packing<br />
7<br />
100%<br />
Sugar<br />
Hazelnuts<br />
Other raw<br />
materials<br />
Packaging<br />
materials<br />
17<br />
9<br />
33<br />
33<br />
1%<br />
4%<br />
19%<br />
6%<br />
11 16 19<br />
5%<br />
23%<br />
31%<br />
25 19<br />
23%<br />
19%<br />
6 4<br />
15%<br />
11%<br />
Warehousing<br />
21<br />
29%<br />
Transport<br />
11<br />
2%<br />
R&D 4 25%<br />
MARKETING<br />
TOTAL 330 TOTAL COST OF COMPLEXITY EUR 47 m 14% FTE impact<br />
xx COGS [EUR m]<br />
xx<br />
Share of COGS when more than one variant is produced<br />
D&A impact<br />
5<br />
17%<br />
19%<br />
27%
36<br />
B.3 COMPLEXITY REDUCTION FOR AN FMCG COMPANY<br />
COGS were cut by 3% for chocolate bars and confectionery<br />
COGS savings<br />
Chocolate bars<br />
Confectionery<br />
Achievable reduction<br />
[% of variants; EUR m]<br />
Achievable reduction<br />
[% of variants; EUR m]<br />
Cocoa mass<br />
4 6<br />
-33% 0.1<br />
4 6<br />
-33% 0.1<br />
Chocolate mass<br />
54 82<br />
-34% 0.8<br />
40 55<br />
-27% 0.6<br />
Fillings<br />
62 102<br />
-39% 1.7<br />
41 60<br />
-31% 1.3<br />
Semi-finished (unpacked)<br />
328 432<br />
-24% 1.7<br />
195 247<br />
-21% 1.2<br />
Primary packaging<br />
598 712<br />
-16% 1.0<br />
358 279<br />
-17% 0.6<br />
Secondary packaging<br />
48 67<br />
-28% 0.2<br />
43 49<br />
-23% 0.1<br />
Tertiary packaging<br />
11 15<br />
-30% 0.1<br />
12 14<br />
-40% 0.1<br />
SKU<br />
794 939 -15% 1) 0.5<br />
360 405 -11% 1) 0.3<br />
EUR 6.0 m/3.1% COGS<br />
EUR 4.4 m/3.5% COGS<br />
% of full potential: 22%<br />
% of full potential: 22%<br />
No of variants in 2010<br />
Minimum achievable no. of variants<br />
1) Affects supply chain and marketing only; purchasing and plant already taken into account in reduction of variants
37<br />
B.3 COMPLEXITY REDUCTION FOR AN FMCG COMPANY<br />
Complexity management generated savings of EUR 17 m<br />
Total savings [EUR m]<br />
5.0 17.2<br />
10.4<br />
1.8<br />
Product<br />
portfolio<br />
optimization<br />
Product<br />
<strong>complexity</strong><br />
management<br />
Target cost<br />
<strong>product</strong><br />
development<br />
Total savings
B.4<br />
Product value<br />
management for a<br />
leading consumer<br />
goods manufacturer
39<br />
B.4 PRODUCT VALUE MANAGEMENT FOR A LEADING CONSUMER GOODS MANUFACTURER<br />
One leading consumer goods manufacturer introduced <strong>product</strong> value<br />
management to increase its profitability<br />
SITUATION<br />
OBJECTIVE: Introduce <strong>product</strong> value management<br />
Leading consumer goods<br />
manufacturer<br />
> Net sales growth<br />
significantly below<br />
benchmark<br />
> Return on sales clearly<br />
below competitors<br />
> Potential from <strong>product</strong><br />
performance<br />
improvement not<br />
leveraged<br />
VALUE<br />
COST<br />
FUNCTIONAL<br />
COST<br />
REDUCTION<br />
Product<br />
Value<br />
Management<br />
(PVM)<br />
> Optimize overall <strong>product</strong><br />
value (cost/performance)<br />
and improve <strong>product</strong><br />
profitability<br />
APPROACH:<br />
> Definition of 23 methods to be<br />
applied during the <strong>product</strong><br />
development process<br />
> Systematic application of<br />
methods in cross-functional<br />
teams (R&D, Procurement, SC,<br />
Quality, Controlling, etc.) in pilot<br />
projects<br />
> Methods solidly anchored by<br />
communication, training, etc.<br />
TODAY<br />
TOMORROW
40<br />
B.4 PRODUCT VALUE MANAGEMENT FOR A LEADING CONSUMER GOODS MANUFACTURER<br />
A four-step approach was used to integrate customer and company<br />
perspectives – Customer view as starting point and end point<br />
Approach<br />
Customer<br />
view<br />
A<br />
Which features<br />
do customers<br />
prefer<br />
In which order<br />
of priority<br />
At what cost<br />
> Feature check<br />
> Focus groups<br />
> …<br />
D<br />
What<br />
alternatives<br />
are valued by<br />
customers and<br />
maximize<br />
profitability<br />
> Sales volume<br />
testing<br />
> Price positioning<br />
> …<br />
> We started by analyzing customer<br />
preferences<br />
> We then identified cost drivers<br />
> In a <strong>product</strong> workshop, we<br />
defined alternative solutions to<br />
reduce <strong>product</strong> costs and<br />
increase performance<br />
Company<br />
view<br />
B<br />
What drives<br />
cost and how<br />
can we influence<br />
it early on<br />
> Value-based<br />
featuring<br />
> Cost driver<br />
analysis<br />
> …<br />
C<br />
What alternatives<br />
can optimize<br />
<strong>product</strong> cost/<br />
performance<br />
> Product teardown<br />
> Product<br />
convention<br />
> …<br />
> Lastly, the solution was evaluated<br />
and optimized from the<br />
customer's perspective<br />
Customer/external view<br />
Company/internal view<br />
Sample methods
41<br />
B.4 PRODUCT VALUE MANAGEMENT FOR A LEADING CONSUMER GOODS MANUFACTURER<br />
The company applied a broad range of tools to optimize <strong>product</strong> value<br />
in all four steps<br />
Methods (excerpt)<br />
CUSTOMER<br />
TRANSPARENCY ALTERNATIVES VALUE<br />
A PREFERENCES B C D MAXIMIZATION<br />
Customer observation<br />
Cost driver analysis<br />
Product teardown<br />
Sales volume testing<br />
Focus<br />
groups<br />
Linear performance<br />
pricing<br />
Commonality<br />
Value engineering<br />
Part Functions Sub-Functions<br />
Fuel Fuel Tank Tank Fuel Total<br />
Pump Valves Shell Straps Gauge<br />
Value Added 1) [EUR]<br />
100<br />
90<br />
80<br />
70<br />
60<br />
50<br />
40<br />
30<br />
Supplier 2<br />
Supplier 3<br />
Supplier 1<br />
Target<br />
corridor<br />
Fuel Tanks<br />
SAFETY<br />
STORE FUEL<br />
DELIVER FUEL<br />
GAUGE FUEL<br />
Crash Worthiness 2 2 2 4 0 10<br />
Fire Proof 0 0 1 2 0 3<br />
Durability 2 0.5 0.5 12 0 15<br />
Maximise volume 0 2 1 0 0 3<br />
Easy to fill 0 1 1 0 0 2<br />
Vent fuel gas 0 2 3 0 0 5<br />
Provide supply at pressure 28 0 0 0 0 28<br />
Maximize fuel suck up 2 0 1 0 0 3<br />
Deliver while dynamic driving 3 0 1 0 0 4<br />
Supply clean fuel 8 0 0 0 0 8<br />
Tell customer whats left 0 0 0 0 7 7<br />
Warn customer running out 0 0 0 0 1 1<br />
20<br />
10<br />
0<br />
Stop air in system 1 0 0 0 1 2<br />
Emissions compliance 1 1 3 0 0 5<br />
Fire proof 0 0 0 0 0 0<br />
LEGAL COMPLIANCE<br />
Crash proof 0 0 0 0 0 0<br />
0 9 10 11 12 13 14 15 16 17 18<br />
Durability 0 0 0 0 0 0<br />
Weight [kg]<br />
TOTAL<br />
47 8 13 18 9 96<br />
Cost drivers
42<br />
B.4 PRODUCT VALUE MANAGEMENT FOR A LEADING CONSUMER GOODS MANUFACTURER<br />
Examples demonstrate that <strong>product</strong> value management reduces<br />
<strong>product</strong> costs and drives sales<br />
Benefits (excerpt)<br />
BODY CARE<br />
COSTS DOWN!<br />
FACIAL CARE<br />
SALES UP!<br />
HAIR COLORING PRODUCTS<br />
-10-15% of packaging costs<br />
> Switch from silk screen printing<br />
technology to offset printing<br />
> No negative impact on<br />
consumer value perception<br />
(no visible difference)<br />
-15% folding box costs<br />
> Size of folding box reduced by<br />
20%<br />
> Positive effect on logistics costs<br />
> Optimization of interior design,<br />
elimination of glue dots, etc.<br />
> Positive customer impact<br />
(driven by sustainability)<br />
+ 1.6% market share<br />
> Differentiation of hair coloring<br />
<strong>product</strong>s by market to meet<br />
local price standards and<br />
consumer needs<br />
– Smaller packaging and<br />
elimination of deep<br />
conditioner inserts in CEE,<br />
India, for example<br />
– Lower cost of goods sold<br />
– Lower price points
43<br />
B.4 PRODUCT VALUE MANAGEMENT FOR A LEADING CONSUMER GOODS MANUFACTURER<br />
Implementing 10 pilot projects enabled the company to reduce the cost<br />
of sales by EUR 60 m<br />
Impact of 10 pilot projects on cost of sales [EUR m]<br />
480<br />
62<br />
418<br />
RESULTS:<br />
> Products with the right features at<br />
the right cost thanks to<br />
– Better transparency<br />
– Better alternatives<br />
– Better decisions<br />
> >100 people from various<br />
functions involved in pilot projects<br />
> Savings potential of over<br />
EUR 60 m identified and realized<br />
> Additional potential through sales<br />
push<br />
Before PVM 1) Savings After PVM 1)<br />
1) Product value management


