Low-bond axisymmetric drop shape analysis for surface tension ...
Low-bond axisymmetric drop shape analysis for surface tension ...
Low-bond axisymmetric drop shape analysis for surface tension ...

Create successful ePaper yourself
Turn your PDF publications into a flip-book with our unique Google optimized e-Paper software.
76 A.F. Stalder et al. / Colloids and Surfaces A: Physicochem. Eng. Aspects 364 (2010) 72–81<br />
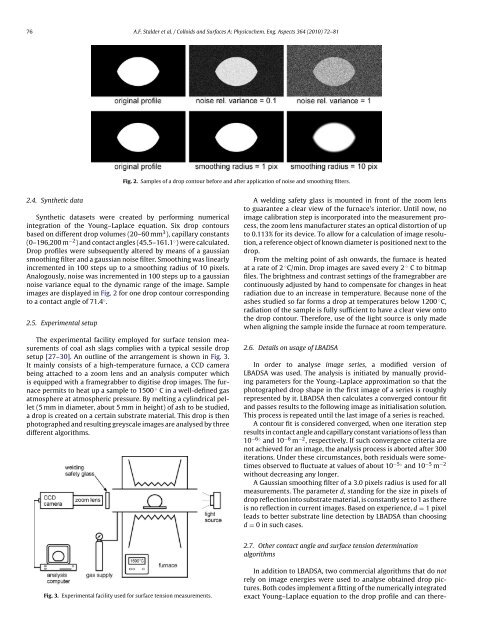
Fig. 2. Samples of a <strong>drop</strong> contour be<strong>for</strong>e and after application of noise and smoothing filters.<br />
2.4. Synthetic data<br />
Synthetic datasets were created by per<strong>for</strong>ming numerical<br />
integration of the Young–Laplace equation. Six <strong>drop</strong> contours<br />
based on different <strong>drop</strong> volumes (20–60 mm 3 ), capillary constants<br />
(0–196,200 m −2 ) and contact angles (45.5–161.1 ◦ ) were calculated.<br />
Drop profiles were subsequently altered by means of a gaussian<br />
smoothing filter and a gaussian noise filter. Smoothing was linearly<br />
incremented in 100 steps up to a smoothing radius of 10 pixels.<br />
Analogously, noise was incremented in 100 steps up to a gaussian<br />
noise variance equal to the dynamic range of the image. Sample<br />
images are displayed in Fig. 2 <strong>for</strong> one <strong>drop</strong> contour corresponding<br />
to a contact angle of 71.4 ◦ .<br />
2.5. Experimental setup<br />
The experimental facility employed <strong>for</strong> <strong>surface</strong> <strong>tension</strong> measurements<br />
of coal ash slags complies with a typical sessile <strong>drop</strong><br />
setup [27–30]. An outline of the arrangement is shown in Fig. 3.<br />
It mainly consists of a high-temperature furnace, a CCD camera<br />
being attached to a zoom lens and an <strong>analysis</strong> computer which<br />
is equipped with a framegrabber to digitise <strong>drop</strong> images. The furnace<br />
permits to heat up a sample to 1500 ◦ C in a well-defined gas<br />
atmosphere at atmospheric pressure. By melting a cylindrical pellet<br />
(5 mm in diameter, about 5 mm in height) of ash to be studied,<br />
a <strong>drop</strong> is created on a certain substrate material. This <strong>drop</strong> is then<br />
photographed and resulting greyscale images are analysed by three<br />
different algorithms.<br />
A welding safety glass is mounted in front of the zoom lens<br />
to guarantee a clear view of the furnace’s interior. Until now, no<br />
image calibration step is incorporated into the measurement process,<br />
the zoom lens manufacturer states an optical distortion of up<br />
to 0.113% <strong>for</strong> its device. To allow <strong>for</strong> a calculation of image resolution,<br />
a reference object of known diameter is positioned next to the<br />
<strong>drop</strong>.<br />
From the melting point of ash onwards, the furnace is heated<br />
at a rate of 2 ◦ C/min. Drop images are saved every 2 ◦ C to bitmap<br />
files. The brightness and contrast settings of the framegrabber are<br />
continuously adjusted by hand to compensate <strong>for</strong> changes in heat<br />
radiation due to an increase in temperature. Because none of the<br />
ashes studied so far <strong>for</strong>ms a <strong>drop</strong> at temperatures below 1200 ◦ C,<br />
radiation of the sample is fully sufficient to have a clear view onto<br />
the <strong>drop</strong> contour. There<strong>for</strong>e, use of the light source is only made<br />
when aligning the sample inside the furnace at room temperature.<br />
2.6. Details on usage of LBADSA<br />
In order to analyse image series, a modified version of<br />
LBADSA was used. The <strong>analysis</strong> is initiated by manually providing<br />
parameters <strong>for</strong> the Young–Laplace approximation so that the<br />
photographed <strong>drop</strong> <strong>shape</strong> in the first image of a series is roughly<br />
represented by it. LBADSA then calculates a converged contour fit<br />
and passes results to the following image as initialisation solution.<br />
This process is repeated until the last image of a series is reached.<br />
A contour fit is considered converged, when one iteration step<br />
results in contact angle and capillary constant variations of less than<br />
10 −6◦ and 10 −6 m −2 , respectively. If such convergence criteria are<br />
not achieved <strong>for</strong> an image, the <strong>analysis</strong> process is aborted after 300<br />
iterations. Under these circumstances, both residuals were sometimes<br />
observed to fluctuate at values of about 10 −5◦ and 10 −5 m −2<br />
without decreasing any longer.<br />
A Gaussian smoothing filter of a 3.0 pixels radius is used <strong>for</strong> all<br />
measurements. The parameter d, standing <strong>for</strong> the size in pixels of<br />
<strong>drop</strong> reflection into substrate material, is constantly set to 1 as there<br />
is no reflection in current images. Based on experience, d = 1 pixel<br />
leads to better substrate line detection by LBADSA than choosing<br />
d = 0 in such cases.<br />
2.7. Other contact angle and <strong>surface</strong> <strong>tension</strong> determination<br />
algorithms<br />
Fig. 3. Experimental facility used <strong>for</strong> <strong>surface</strong> <strong>tension</strong> measurements.<br />
In addition to LBADSA, two commercial algorithms that do not<br />
rely on image energies were used to analyse obtained <strong>drop</strong> pictures.<br />
Both codes implement a fitting of the numerically integrated<br />
exact Young–Laplace equation to the <strong>drop</strong> profile and can there-