Performance assessment of tendon support systems submitted to ...
Performance assessment of tendon support systems submitted to ...
Performance assessment of tendon support systems submitted to ...

You also want an ePaper? Increase the reach of your titles
YUMPU automatically turns print PDFs into web optimized ePapers that Google loves.
<strong>Performance</strong> <strong>assessment</strong> <strong>of</strong> <strong>tendon</strong> <strong>support</strong> <strong>systems</strong> <strong>submitted</strong> <strong>to</strong><br />
dynamic loading<br />
D. Gaudreau<br />
Noranda Inc. Brunswick Mine, Bathurst, NB, Canada<br />
M. Aubertin & R. Simon<br />
École Polytechnique de Montréal, Montréal, QC, Canada<br />
ABSTRACT: An approach is proposed in this paper <strong>to</strong> assess the performance <strong>of</strong> <strong>tendon</strong> <strong>support</strong> <strong>systems</strong><br />
<strong>submitted</strong> <strong>to</strong> dynamic loading. The approach was developed subsequent <strong>to</strong> the quasi-static and impact pullout<br />
testing data assembled during the MCB (Modified Cone Bolt) pro<strong>to</strong>type <strong>tendon</strong> <strong>support</strong> validation. It consists in<br />
the calculation <strong>of</strong> the displacement <strong>of</strong> <strong>tendon</strong> <strong>support</strong> <strong>systems</strong> when subjected <strong>to</strong> dynamic loading using experimental<br />
data from the <strong>tendon</strong>’s response <strong>to</strong> quasi-static loading. The proposed displacement evaluation method<br />
could provide a means <strong>of</strong> calculating the maximum capacity range <strong>of</strong> <strong>tendon</strong>s for rockburst <strong>support</strong> design.<br />
1 TUNNELS IN HIGHLY STRESSED<br />
GROUND<br />
1.1 Introduction<br />
Deep mines and underground operations with a high<br />
extraction ratio are sensitive <strong>to</strong> ground stresses. Increasing<br />
stresses in a mining area can cause the failure<br />
<strong>of</strong> rock masses around openings and convergence<br />
<strong>of</strong> rock <strong>to</strong>wards the exposed surfaces <strong>of</strong><br />
excavations. Under a combination <strong>of</strong> circumstances<br />
such as the presence <strong>of</strong> strong and brittle rock and<br />
high stresses, it is possible for the rock mass <strong>to</strong> fail<br />
violently thus causing a rockburst. Reinforcement<br />
and tunnel <strong>support</strong> techniques such as the use <strong>of</strong><br />
rock bolts, reaction plates and mesh are well suited<br />
for gravity driven situations when the <strong>support</strong> <strong>systems</strong><br />
are subjected <strong>to</strong> static and quasi-static loading.<br />
The performance <strong>of</strong> the <strong>systems</strong> can be at any time<br />
verified, through pull out testing <strong>of</strong> the <strong>tendon</strong> <strong>support</strong><br />
elements and the meshing units for example.<br />
Bolting patterns and <strong>support</strong> system design can be<br />
inspired from a number <strong>of</strong> published references <strong>to</strong><br />
meet specific performance requirements.<br />
The design <strong>of</strong> <strong>support</strong> strategies for dynamic<br />
loading is less obvious. Published guidelines suggest<br />
adopting a <strong>tendon</strong> burden as well as an arbitrary<br />
ejection velocity. These fac<strong>to</strong>rs can be used <strong>to</strong> calculate<br />
the energy absorption capacity requirements<br />
<strong>of</strong> a <strong>support</strong> system so that it can be compared <strong>to</strong> the<br />
work energy during a pull out test in quasi-static<br />
loading mode. In this article a different approach is<br />
proposed based on quasi-static and impact pullout<br />
testing data assembled during the MCB (Modified<br />
Cone Bolt) pro<strong>to</strong>type <strong>tendon</strong> <strong>support</strong> validation. Results<br />
and observations from the testing phase were<br />
used <strong>to</strong> derive a simple displacement evaluation<br />
method for <strong>tendon</strong>s <strong>submitted</strong> <strong>to</strong> impact loading.<br />
The proposed displacement evaluation method could<br />
provide a means <strong>of</strong> calculating the maximum capacity<br />
range <strong>of</strong> <strong>tendon</strong>s for rockburst <strong>support</strong> design.<br />
1.2 Background<br />
The <strong>tendon</strong> energy absorption testing methodology<br />
presented in this paper was developed concurrently<br />
with Noranda Inc.’s Technology Centre (NTC) research<br />
project R2-9684. The project related <strong>to</strong> the<br />
design <strong>of</strong> <strong>support</strong> <strong>systems</strong> able <strong>to</strong> sustain rapid loading<br />
conditions. In 2002, a patent application (US<br />
6,390,735 B1) has been granted for Noranda Inc. regarding<br />
a new bolt called MCB for “Modified Cone<br />
Bolt”. This new <strong>tendon</strong> can yield in its polyester<br />
resin grout matrix. The bolt’s mechanical response<br />
<strong>to</strong> rapid loading has been evaluated using an impact<br />
test rig located inside its NTC premises. Impact testing<br />
on different bolt types called for an energy absorption<br />
calculation method that could describe the<br />
<strong>tendon</strong>’s impact behaviour through time for two reasons.<br />
The first is due <strong>to</strong> limitations on the test rig’s<br />
maximum drop weight load and height. Certain<br />
types <strong>of</strong> <strong>support</strong> require more than one impact <strong>to</strong><br />
break the <strong>tendon</strong>. Thus drop heights and impact velocities<br />
were not constant from one test <strong>to</strong> another.<br />
The second reason pertains <strong>to</strong> the purpose <strong>of</strong> the impact<br />
testing. The characteristic response <strong>of</strong> each<br />
<strong>tendon</strong> had <strong>to</strong> be summarised in such a fashion that it<br />
could be used for rockburst load simulation purposes.<br />
This paper focuses on the selected method<br />
for testing and assessing the response <strong>of</strong> different
<strong>systems</strong> <strong>to</strong> impact loading, by proposing a methodology<br />
for the verification <strong>of</strong> the MCB capabilities<br />
(Gaudreau 2004).<br />
Tendon <strong>support</strong> is most <strong>of</strong>ten used with other<br />
<strong>support</strong> elements, such as wire mesh and straps, as a<br />
system for tunnel <strong>support</strong> in mines. Tendon <strong>support</strong><br />
consists <strong>of</strong> a stiff rod <strong>of</strong> a given geometry, length<br />
and diameter installed in a borehole. Different <strong>tendon</strong><br />
<strong>support</strong> <strong>systems</strong> are available, for example cable<br />
bolts, rock bolts, rebars and Split Sets (e.g. Hoek et<br />
al. 1995). Each type <strong>of</strong> <strong>tendon</strong> will react differently<br />
when subjected <strong>to</strong> slow or rapid loading.<br />
Stiffer <strong>support</strong> <strong>systems</strong> can provide immediate resistance<br />
<strong>to</strong> the deformation <strong>of</strong> openings. If the deformations<br />
become <strong>to</strong>o large or if the drift sustained<br />
damage, the tunnel is rehabilitated, usually by removing<br />
loose parts and installing new rock <strong>support</strong><br />
devices. Certain <strong>support</strong> <strong>systems</strong> are better suited <strong>to</strong><br />
carry massive deformation through time, and can<br />
avoid the rehabilitation process. By definition, a<br />
yielding <strong>tendon</strong> <strong>support</strong> system has enhanced loadtime<br />
distribution properties when subjected <strong>to</strong> large<br />
displacements, while providing resistance <strong>to</strong> the<br />
movement. An example is given for clarity. A massive<br />
impact load is suffered by a <strong>support</strong>ing structure<br />
at the periphery <strong>of</strong> a tunnel, due <strong>to</strong> the violent failure<br />
<strong>of</strong> a wall. If the wall <strong>support</strong> system is stiff, it will<br />
carry the full load in a very short amount <strong>of</strong> time.<br />
Hence, the steel <strong>tendon</strong>s will elongate elastically and<br />
plastically then break, leaving a large amount <strong>of</strong> energy<br />
available that may be imparted <strong>to</strong> mobile rock<br />
particles. The smaller ejected masses will likely be<br />
ejected at high velocity, the heavier ones will be<br />
found near the <strong>to</strong>e <strong>of</strong> the wall. If this wall was <strong>support</strong>ed<br />
using yielding <strong>support</strong>, the impact load received<br />
by the reaction plates through strapping and<br />
screening materials will be transferred <strong>to</strong> the <strong>tendon</strong><br />
unit. If the <strong>tendon</strong> unit can move and follow the<br />
wall displacement with some resistance, the load<br />
will be transferred <strong>to</strong> the <strong>tendon</strong>, until the wall<br />
comes <strong>to</strong> a full s<strong>to</strong>p. It is near the end <strong>of</strong> the deceleration<br />
that the <strong>tendon</strong> will sustain the most damage<br />
if the dynamic load is <strong>to</strong>o large. But during the controlled<br />
movement <strong>of</strong> the wall, a quantity <strong>of</strong> work energy<br />
will have been absorbed, which could decrease<br />
the damage <strong>to</strong> the opening. The load absorbed inside<br />
the <strong>tendon</strong> is a complex mechanism dependent<br />
on the characteristics <strong>of</strong> the <strong>support</strong> system and <strong>of</strong><br />
the bonding materials inside the borehole. One can<br />
speculate that the pressure <strong>of</strong> the reaction plate and<br />
straps on the wall in reaction <strong>to</strong> the <strong>tendon</strong> displacement<br />
inside the borehole can reduce the size <strong>of</strong><br />
the failure zone since rock is stronger when confined.<br />
The extra confinement given by the movement<br />
resistance <strong>of</strong> the <strong>tendon</strong>s could change the size<br />
<strong>of</strong> the failure zone during the impact.<br />
All <strong>support</strong> <strong>systems</strong> available commercially have<br />
limitations, and the choice <strong>of</strong> the proper one depends<br />
on fac<strong>to</strong>rs such as the in-situ stresses, the expected<br />
rate and amount <strong>of</strong> deformation <strong>of</strong> the drift walls, the<br />
nature and quality <strong>of</strong> the rock mass, as well as the<br />
tunnel function and utilization time.<br />
Cook and Ortlepp (1968) suggested the use <strong>of</strong><br />
yielding <strong>support</strong> in the deep gold mines <strong>of</strong> South Africa.<br />
The concept was further developed by Jager et<br />
al. (1990), who introduced the South African Cone<br />
Bolt (Jager 1992), a groutable <strong>tendon</strong> equipped with<br />
a cone anchor. Preliminary impact testing <strong>of</strong> resin<br />
and cement grouted Cone Bolts was conducted in<br />
May <strong>of</strong> 1998 at the Noranda Inc. Technology Centre.<br />
Testing results and other industry results suggested<br />
that the Cone Bolt was not reliable when installed<br />
with cartridged polyester resin, but seemed effective<br />
for use with cement grout. This was mainly due <strong>to</strong><br />
the bolt’s inability <strong>to</strong> mix the cartridged resin in a<br />
reproducible fashion.<br />
1.3 Scope <strong>of</strong> work<br />
This paper presents experimental procedures and results<br />
pertaining <strong>to</strong> the evaluation <strong>of</strong> <strong>tendon</strong> <strong>support</strong><br />
performance in impact loading. More specifically,<br />
the experimental results and procedures will be descriptive<br />
<strong>of</strong> the validation tests for the Modified<br />
Cone Bolt (MCB) developed at Noranda Inc. Technology<br />
Centre (NTC).<br />
Section 2 contains a literature review on seismicity<br />
in mines, load-deformation-time behavior <strong>of</strong> <strong>tendon</strong><br />
<strong>support</strong>, and testing methods thereafter. Section<br />
3 contains experimental procedures used <strong>to</strong> test<br />
MCB pro<strong>to</strong>type <strong>tendon</strong>s at various loading rates, as<br />
well as testing results and analysis. Section 4 elaborates<br />
on a proposed displacement evaluation method<br />
for <strong>tendon</strong>s <strong>submitted</strong> <strong>to</strong> dynamic loading based on<br />
observations from impact testing <strong>of</strong> MCB <strong>tendon</strong>s.<br />
2 LOADING MECHANISMS AND<br />
REQUIRED PERFORMANCE OF<br />
TENDON SUPPORT<br />
2.1 Rockbursts and seismicity in mines<br />
In Eastern Canada rockbursts are <strong>of</strong>ten called<br />
“bumps”. A 1920 definition <strong>of</strong> a bump is “a sudden<br />
breaking sometimes accompanied by a setting or upheaval<br />
<strong>of</strong> the strata in the mine, accompanied by a<br />
loud report. (...) <strong>of</strong>ten interpreted as a sudden<br />
squeeze, or buckling <strong>of</strong> the floor or walls <strong>of</strong> the mine<br />
passage-ways. It has its origin in the shocks accompanying<br />
earth movements” (Fay 1947).<br />
Rockbursts are violent failures <strong>of</strong> rock that result<br />
in damage <strong>to</strong> excavations (e.g. Cook 1965). Only<br />
those events that cause damage in accessible areas <strong>of</strong><br />
the mine are called rockbursts (Gibowicz 1993).<br />
Out <strong>of</strong> thousands <strong>of</strong> bumps recorded in Canadian<br />
mine seismic networks, only a few can be considered
as rockbursts. A seismic event is a broader term referring<br />
<strong>to</strong> all occurrences that are associated with the<br />
release <strong>of</strong> kinetic energy, with the exclusion <strong>of</strong> blasting.<br />
Salamon (1974) suggested that a rockburst<br />
could be described as a seismic event that adversely<br />
affects the operation.<br />
INDUCED STRESS<br />
FRACTURING<br />
A<br />
sigma2<br />
sigma3<br />
sigma1<br />
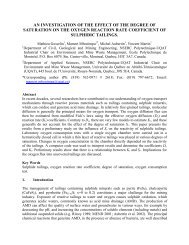
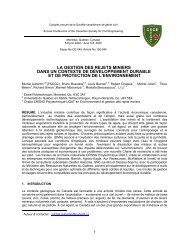
2.2 Rockburst source mechanisms, size and<br />
classification<br />
A rockburst mechanism classification is suggested in<br />
Table 1. This classification was derived from<br />
Ortlepp (1992) <strong>to</strong> better reflect the relative calibration<br />
<strong>of</strong> Noranda Inc.’s mine seismic <strong>systems</strong>. The<br />
classification is illustrated in Figure 1. Note that this<br />
classification is somewhat arbitrary. Its intent is<br />
only <strong>to</strong> illustrate the relative magnitude <strong>of</strong> what<br />
could be “felt” by someone near the affected area, in<br />
terms <strong>of</strong> a fairly well known moment magnitude<br />
scale, namely the Richter scale.<br />
As illustrated in the classification, different rockburst<br />
mechanisms have different associated “burden”<br />
on the <strong>tendon</strong> <strong>support</strong> system used in the tunnel. For<br />
example, the mechanism “face crush”, is probably<br />
the one which could have the highest individual <strong>tendon</strong><br />
burden and impact velocity on the <strong>support</strong> system.<br />
The size <strong>of</strong> the volume <strong>of</strong> rock that violently<br />
fails and its proximity <strong>to</strong> an open face can cause a lot<br />
<strong>of</strong> damage. On the other hand, the mechanism<br />
“fault-slip”, although corresponding <strong>to</strong> the highest<br />
probable moment magnitude, is the one less likely <strong>to</strong><br />
induce a large burden or impact velocity on the <strong>support</strong><br />
system. Its incidence on tunnel stability is most<br />
likely <strong>to</strong> be due <strong>to</strong> shake damage or spalling <strong>of</strong> loose<br />
and poorly <strong>support</strong>ed material.<br />
Table 1. Proposed classification for rockburst source mechanisms<br />
and associated damage.<br />
Type <strong>of</strong> failure Postulated mechanism at<br />
the source <strong>of</strong> the seismic<br />
event<br />
Local Richter<br />
Magnitude<br />
Stress-induced<br />
fracture<br />
Strain bursting<br />
Buckling<br />
Face<br />
crush/Pillar<br />
burst<br />
Shear rupture<br />
Fault-slip<br />
Energy dissipation in the<br />
rock mass by creation <strong>of</strong><br />
new fractures<br />
Superficial spalling <strong>of</strong><br />
tunnel surface and violent<br />
ejection <strong>of</strong> rock particles.<br />
Bending <strong>of</strong> rock slabs<br />
inwards the tunnel due <strong>to</strong><br />
the pressure on both<br />
ends<br />
Violent and deep expulsion<br />
<strong>of</strong> rock from a tunnel<br />
surface or multifaceted<br />
structure (pillar, rib,<br />
“skin” pillar, remnant)<br />
Violent propagation <strong>of</strong> a<br />
shear surface in a solid<br />
or healed area<br />
Violent slip on a preexisting<br />
shear surface.<br />
-3.0 <strong>to</strong> –1.0<br />
-2.0 <strong>to</strong> 0.0<br />
0.0 <strong>to</strong> 1.5<br />
1.0 <strong>to</strong> 2.5<br />
1.0 <strong>to</strong> 3.0<br />
2.0 <strong>to</strong> 3.0<br />
FACE CRUSH<br />
due <strong>to</strong> stress rotation<br />
B<br />
STRAIN BURSTING<br />
C<br />
BUCKLING<br />
D<br />
SHEAR RUPTURE<br />
(2 TYPES)<br />
E<br />
F<br />
FAULT SLIP<br />
(MINE WIDE)<br />
OR<br />
sigma2<br />
sigma2<br />
sigma1<br />
sigma1<br />
sigma3<br />
sigma3<br />
sigma3<br />
sigma1<br />
sigma2<br />
Figure 1. Tunnel damage classification (Gaudreau, 2004).
2.3 <strong>Performance</strong> requirements <strong>of</strong> yielding <strong>support</strong><br />
Tunnels driven in<strong>to</strong> highly stressed ground typically<br />
suffer from stress-induced damage (e.g. Wagner<br />
1984, Mühlhaus 1990, Ortlepp 1992a, Dyskin &<br />
Germanovich 1993, Langille et al. 1995, Maxwell &<br />
Young 1997). Stress-induced damage can form<br />
from either creation <strong>of</strong> new fractures or reactivation<br />
<strong>of</strong> existing fractures in the rock mass. This phenomenon<br />
is depicted in Figure 1a, showing an exaggerated<br />
pr<strong>of</strong>ile <strong>of</strong> the induced fracture lines relative<br />
<strong>to</strong> the influence <strong>of</strong> the principal stress direction.<br />
The extent <strong>of</strong> the induced fracture zone can affect<br />
the amount <strong>of</strong> “dead load” in the back <strong>of</strong> the tunnel.<br />
Static loading performance <strong>of</strong> tunnel <strong>support</strong> in<br />
highly stressed ground must reflect this aspect. Further<br />
<strong>to</strong> this, the tunnel <strong>support</strong> must be able <strong>to</strong> <strong>to</strong>lerate<br />
relative convergence <strong>of</strong> tunnel walls, or swelling<br />
and squeezing rock conditions (Stillborg 1986).<br />
Sidewall dilations in excess <strong>of</strong> 500 mm have been<br />
recorded under both static and dynamic conditions.<br />
However, when such large movements occur, the<br />
dimensions <strong>of</strong> conventional tunnels are reduced <strong>to</strong><br />
such an extent that the basic functions <strong>of</strong> these tunnels<br />
cannot be maintained. Wojno et al. (1987) recommended<br />
a static <strong>tendon</strong> yield force greater than<br />
100 kN <strong>to</strong> control wall movement. Moreover, these<br />
same authors suggested that the distribution <strong>of</strong> the<br />
dilation within the fractured zone is an important<br />
fac<strong>to</strong>r <strong>to</strong> the design <strong>of</strong> <strong>support</strong> <strong>tendon</strong>s for yielding<br />
ground. They observed average values <strong>of</strong> dilation in<br />
a highly stressed tunnel <strong>to</strong> be such that 46% occurred<br />
within 2 m <strong>of</strong> the tunnel wall, 16% between 2-3 m<br />
and 38% at depths greater than 3 m from the tunnel<br />
sidewall. They thus recommended that the yielding<br />
range due <strong>to</strong> sidewall/hangingwall movement within<br />
the <strong>support</strong>ed rock thickness for non-rockburst conditions<br />
be:<br />
− 230 mm for a <strong>tendon</strong> length <strong>of</strong> less than 2 m,<br />
− 310 mm for a <strong>tendon</strong> length <strong>of</strong> 2 m <strong>to</strong> 3 m,<br />
− 500 mm for a <strong>tendon</strong> longer than 3 m.<br />
Langille et al. (1995) have set the following criteria<br />
for the selection <strong>of</strong> a one-pass <strong>support</strong> system<br />
(i.e. installed in one cycle) for use in a high stress<br />
mining environment at Creigh<strong>to</strong>n Mine in Sudbury:<br />
− immediate <strong>support</strong> <strong>of</strong> loose rock blocks for protection<br />
<strong>of</strong> men and equipment at the face,<br />
− yieldability <strong>of</strong> at least 50 mm in the short term,<br />
− long term rigid reinforcement <strong>of</strong> the broken rock<br />
mass,<br />
− corrosion resistance <strong>to</strong> heat, humidity, fumes,<br />
smoke and percolating mine water.<br />
The quantity <strong>of</strong> material that could potentially be<br />
statically contained by a rockburst <strong>support</strong> package<br />
after a dynamic event will depend on the bolting pattern<br />
at the periphery <strong>of</strong> the opening, or more specifically<br />
the <strong>tendon</strong> burden. Tendon loads can easily<br />
reach the order <strong>of</strong> 100 kN. Kaiser et al. (1992) have<br />
proposed a Rock Damage Scale for which levels <strong>of</strong><br />
displaced rock range from a few kilograms <strong>to</strong><br />
amounts greater than 10,000 kg.<br />
Further <strong>to</strong> quasi-static considerations pertaining<br />
<strong>to</strong> “dead load” on <strong>tendon</strong> <strong>support</strong>, one must consider<br />
dynamic effects if a tunnel is <strong>to</strong> be subjected <strong>to</strong> high<br />
stresses. Dynamic loading implies physical forces<br />
producing motion. Stress changes and blast vibrations<br />
after mining <strong>to</strong> a new s<strong>to</strong>pe geometry can produce<br />
dynamic loading <strong>of</strong> a nearby tunnel. The stress<br />
regime at its periphery can fluctuate rapidly.<br />
Wojno et al. (1987) have set these guidelines for<br />
the capacity <strong>of</strong> <strong>tendon</strong>s in dynamic loading:<br />
− The amount <strong>of</strong> work <strong>to</strong> be done during yielding <strong>of</strong><br />
the <strong>tendon</strong> must be greater than 25 kJ.<br />
− The mean dynamic yield force must be in excess<br />
<strong>of</strong> 50 kN.<br />
− The maximum dynamic yielding range must not<br />
exceed 500 mm <strong>of</strong> displacement.<br />
− The dynamic strength <strong>of</strong> the <strong>tendon</strong> should exceed<br />
the static yield load <strong>of</strong> the <strong>tendon</strong> by at least<br />
25 per cent.<br />
Gaudreau (2000) set the design criteria for the<br />
components <strong>of</strong> a yielding <strong>support</strong> system for Noranda<br />
Inc. at:<br />
− peak reaction load <strong>of</strong> less than 11.3 <strong>to</strong>ns and<br />
greater than 6.8 <strong>to</strong>ns for an impact energy <strong>of</strong> 15<br />
kJ,<br />
− <strong>tendon</strong> system plasticity limit at load greater than<br />
6.8 <strong>to</strong>ns,<br />
− pull-out displacement greater than 150 mm (at<br />
maximum static capacity and at impact loading <strong>of</strong><br />
15 kJ),<br />
− ability <strong>to</strong> install in cement or polyester resin grout<br />
using mechanized or non-mechanized means <strong>of</strong><br />
installation,<br />
− <strong>support</strong> must not creep if load below plasticity<br />
limit after initial movement <strong>of</strong> the anchor,<br />
− better corrosion resistance than resin-rebar<br />
installation,<br />
− <strong>support</strong> can be pre-tensioned at installation,<br />
− <strong>support</strong> <strong>to</strong> be installed in a 38 mm hole with a 17<br />
mm smooth bar <strong>of</strong> grade C1060.<br />
These criteria were set <strong>to</strong> match energy absorption<br />
and wall control requirements from damage observed<br />
underground at Brunswick Mine and from<br />
other operational restrictions including compatibility<br />
with the mine’s machinery and rapidity <strong>of</strong> installation.<br />
The choice <strong>of</strong> the smooth bar was made based<br />
on two assumptions:<br />
− it is preferable for the full rock load transfer in the<br />
steel rod from the reaction plate <strong>to</strong> the bolt’s inner<br />
end,<br />
− there is a possibility for creating an “active” <strong>support</strong><br />
effect, i.e., additional clamping charge transferred<br />
<strong>to</strong> the rock mass during the event <strong>of</strong> a<br />
strain burst from a tunnel face.<br />
The latter assumption could be verified provided<br />
the demonstration that the volume <strong>of</strong> rock subjected
<strong>to</strong> failure decreases with the instantaneous clamping<br />
provided by the bolt during the burst.<br />
The use <strong>of</strong> energetic absorption requirements in<br />
the formulation <strong>of</strong> yielding <strong>support</strong> performance requirements<br />
can be estimated by different means. For<br />
example, one can use case analysis <strong>of</strong> rockbursts, or<br />
published data pertaining <strong>to</strong> average ejection velocity<br />
(Yu 1980, Wagner 1984, Stillborg 1986, Wojno<br />
et al. 1987, Ortlepp 1993, Kaiser et al. 1996). A different,<br />
and perhaps more pro-active method could be<br />
<strong>to</strong> evaluate the ERP (Evaluation <strong>of</strong> Rockburst Potential)<br />
for the mining area and calculate (Simon et al.<br />
1998, Simon 1999) the quantity <strong>of</strong> excess energy<br />
available after rupture using stiffness comparisons.<br />
Once the quantity <strong>of</strong> excess energy is approximated,<br />
and given a <strong>tendon</strong> <strong>support</strong> burden, one can calculate<br />
the average possible impact velocity on the <strong>support</strong><br />
system. The importance <strong>of</strong> the proper selection <strong>of</strong> the<br />
impact velocity will be demonstrated in section 4.<br />
2.4 <strong>Performance</strong> <strong>of</strong> yielding <strong>support</strong><br />
Commercially available <strong>tendon</strong>s have been tested for<br />
their plausible reaction <strong>to</strong> impact loading using different<br />
methods. Tendons are <strong>of</strong>ten pull-tested and<br />
the load-displacement curve can be utilised <strong>to</strong> calculate<br />
the work spent during the test. Tannant & Buss<br />
(1994), Langille et al. (1995), Kaiser et al. (1996)<br />
and Hoek (2000) published pull strength parameters<br />
for <strong>tendon</strong> <strong>support</strong> and mesh. The different <strong>tendon</strong>s<br />
are classified by their ability <strong>to</strong> yield. Split Sets,<br />
Swellex and Cone Bolts were classified within the<br />
best yielding <strong>tendon</strong>s available on the Canadian<br />
market, thus would be better suited for use in rockburst-prone<br />
areas <strong>to</strong> prevent damage.<br />
Tendons can also be directly tested in rapid loading.<br />
Most <strong>tendon</strong> rapid loading testing methods depicted<br />
in the literature can be classified under explosive<br />
loading or impact loading categories.<br />
Ortlepp (1992) discussed the blast testing approach<br />
where a tunnel half-section is bolted with<br />
conventional end-anchored bolts and the other half<br />
with yielding end-anchored bolts. These trials were<br />
conducted by Ortlepp in 1969. The test was used <strong>to</strong><br />
demonstrate the relative performance <strong>of</strong> both <strong>support</strong><br />
<strong>systems</strong> under dynamic loading. Another widely<br />
published experiment concerns the explosive testing<br />
<strong>of</strong> the COMRO Cone Bolt, developed and manufactured<br />
by Strata Control Systems, and now manufactured<br />
by Steeldale in South Africa (see Ortlepp 1994,<br />
Stacey & Ortlepp 1994, 1999, 2000, Ortlepp & Stacey<br />
1998). In this experiment, six different sets <strong>of</strong><br />
<strong>support</strong> <strong>tendon</strong>s, namely two distinct sets <strong>of</strong> 16 mm<br />
Cone Bolts, and one set <strong>of</strong> each 16 mm rebars, 16<br />
mm smooth bars, 25 mm rebars and 22 mm Cone<br />
Bolts were installed in a quarry. Each set was installed<br />
and grouted in<strong>to</strong> bedrock through an independent<br />
concrete slab. Explosive charges were then<br />
inserted in horizontal cavities consisting <strong>of</strong> rows <strong>of</strong><br />
PVC pipes laid on the bedrock before the casting <strong>of</strong><br />
concrete. Each slab was tested separately and moni<strong>to</strong>red<br />
using a high-speed camera and a velocity<br />
transducer consisting <strong>of</strong> a velocity <strong>of</strong> de<strong>to</strong>nation<br />
electronic timer. The objective <strong>of</strong> the experiment<br />
was mainly <strong>to</strong> compare the performance <strong>of</strong> a stiff<br />
<strong>support</strong> system <strong>to</strong> a yielding one. The explosive jolt<br />
was not the same from one test <strong>to</strong> another, making it<br />
difficult <strong>to</strong> estimate the energy absorption <strong>of</strong> each<br />
set. Gases from explosive charges did not burst out<br />
from the fractured ground in exactly the same way<br />
every time, thus inducing a different energy at each<br />
test.<br />
Tannant et al. (1992) used a different approach<br />
when a test drift, located near a large s<strong>to</strong>pe, was instrumented<br />
in the expectation <strong>of</strong> a large blast susceptible<br />
<strong>of</strong> triggering seismic activity. Accelerometers<br />
were set up directly on Split Sets, mechanical bolts<br />
and Swellex bolts. The performance <strong>of</strong> <strong>tendon</strong> <strong>support</strong><br />
under these events was thus measured. The<br />
peak particle velocity measured was in the range <strong>of</strong><br />
millimetres per second, whereas ejection velocities<br />
during a rockburst are in the order <strong>of</strong> 1 <strong>to</strong> 10 metres<br />
per second. Although this technique measures the<br />
impact <strong>of</strong> real seismic events on <strong>tendon</strong> <strong>support</strong>, it<br />
carries a disadvantage, the uncertainty <strong>of</strong> expectation.<br />
One must wait until a natural seismic event<br />
hits a particular instrumented area <strong>to</strong> get results.<br />
Ansell (1999) and Tannant et al. (1994) have<br />
worked on an approach were the dynamic damage is<br />
simulated in a tunnel by using a blasthole drilled at a<br />
small angle <strong>to</strong> the axis <strong>of</strong> the haulage. The maximum<br />
ejection velocities were no greater than 2 metres<br />
per second, but were successful in creating damage<br />
<strong>to</strong> the haulage. The tests showed that loading by<br />
explosives close <strong>to</strong> bolts causes cracking <strong>of</strong> the surrounding<br />
rock and thereby inadequate loading <strong>of</strong> the<br />
bolts. Furthermore, it would be preferable <strong>to</strong> test<br />
<strong>support</strong> packages at velocities higher than 2 m/s for<br />
rockburst <strong>support</strong> design.<br />
Special impact test rigs have been used <strong>to</strong> test<br />
<strong>tendon</strong>s at impact velocities and loads that are comparable<br />
<strong>to</strong> these <strong>of</strong> yielding <strong>support</strong> system requirements.<br />
Ansell (1999) grouted yielding <strong>tendon</strong> <strong>support</strong><br />
inside a large cylindrical concrete mass. The<br />
mass, attached <strong>to</strong> an horizontal H-beam, was<br />
dropped from the ceiling <strong>of</strong> a two s<strong>to</strong>ry high pilot<br />
plant, <strong>to</strong> a receiving structure were it was suddenly<br />
s<strong>to</strong>pped. The set-up was used for fully grouted bolts<br />
and for ungrouted steel bars coupled <strong>to</strong> steel weights.<br />
Stacey & Ortlepp (1999) used a swing-beam<br />
mechanism and a large mass <strong>to</strong> provoke the separation<br />
<strong>of</strong> a test tube where the tested <strong>tendon</strong> is installed.<br />
Maloney & Kaiser (1996) have designed the<br />
test rig that has been installed at Brunswick mine in<br />
1997 and was later modified by Noranda Inc. The<br />
test rig was never used at the mine site due <strong>to</strong> operational<br />
difficulties.
Tendons have also been tested in shear and dynamic<br />
shear. Tendons can be loaded not only in pure<br />
traction, but also in shear or by a combination <strong>of</strong><br />
both loading modes. This can occur during the<br />
course <strong>of</strong> induced stress fracturing (Figure 1a) and<br />
dislocation <strong>of</strong> fracture surfaces thereafter. The shear<br />
movement can be significant if combined with stress<br />
changes due <strong>to</strong> mining <strong>of</strong> excavations in proximity.<br />
Haile et al. (1995) have studied the phenomenon using<br />
two types <strong>of</strong> shear inducing apparatus <strong>to</strong> perform<br />
shear tests on <strong>tendon</strong> <strong>support</strong>. The tests were performed<br />
under both static and dynamic loading. It<br />
appears from the results that the 16 mm Cone Bolt<br />
and the 16 mm smooth bar performed equally well<br />
under dynamic shear. The 16 mm Cone Bolt<br />
showed better shear resistance in static shear than<br />
the smooth bar. The authors have recommended the<br />
Cone Bolt over the smooth bar, rebar, Split Set and<br />
twist bar in applications where shear movements in<br />
the rock are predicted. They recommended further<br />
work before using larger diameter bars for shear<br />
loading but argued that it would not be necessary <strong>to</strong><br />
increase the diameter size <strong>of</strong> the Cone Bolt for such<br />
a use. The strength <strong>of</strong> the Cone Bolt in shear loading<br />
mode lies in its ability <strong>to</strong> alter the loading mode.<br />
In essence, the Cone Bolt installed in a dislocating<br />
wall would be loaded in a combined shear and traction<br />
mode.<br />
Gillerstedt (1999) experimented on the ability <strong>of</strong><br />
the 22 mm Cone Bolt <strong>to</strong> perform in mixed loading<br />
mode. The bolts were installed through two concrete<br />
blocks and loaded in shear. The resulting axial load<br />
on the <strong>tendon</strong> was measured using a load cell<br />
mounted under the bolt’s reaction plate. Electronic<br />
displacement transducers were used <strong>to</strong> measure the<br />
cone displacement in the grouted bore hole and the<br />
crack aperture. Wire potentiometers were used <strong>to</strong><br />
moni<strong>to</strong>r shear movement <strong>of</strong> the concrete block. The<br />
deformation rate was approximately 0.1 mm/s. Results<br />
indicate that the Cone Bolts did transfer some<br />
<strong>of</strong> the shear load in<strong>to</strong> axial loading. One particular<br />
Cone Bolt sample broke in shear after 226 mm <strong>of</strong><br />
shear displacement having locked in place in its encapsulating<br />
matrix. The compressive strength <strong>of</strong> the<br />
cement grout did not seem <strong>to</strong> influence the Cone<br />
Bolt’s behavior by comparing results.<br />
3 EXPERIMENTAL PROCEDURES AND<br />
MAIN RESULTS<br />
3.1 Quasi-static underground pull-testing <strong>of</strong> MCB<br />
<strong>tendon</strong><br />
Quasi-static pull testing is generally used <strong>to</strong> evaluate<br />
the in-situ reaction <strong>of</strong> <strong>tendon</strong> <strong>support</strong>. This consists<br />
in extracting pre-installed rock <strong>support</strong> from its installation<br />
site using a hydraulic ram while measuring<br />
the force given <strong>to</strong> the ram and the displacement <strong>of</strong><br />
Figure 2. Diagram <strong>of</strong> pull test assembly.<br />
the <strong>tendon</strong> at the collar <strong>of</strong> the hole. A schematic <strong>of</strong><br />
the pull testing assembly used for the pro<strong>to</strong>type<br />
MCB tests is illustrated in Figure 2.<br />
Pull testing was performed in April 2000 at<br />
Brunswick mine on MCB pro<strong>to</strong>types <strong>of</strong> 2.1m length.<br />
Displacement was measured through a potentiometer<br />
and load using an electronic pressure transducer, as<br />
illustrated in Figure 2. The polyester resin used was<br />
Fosroc 35 mm diameter cartridges. A summary <strong>of</strong><br />
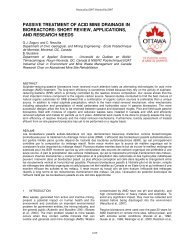
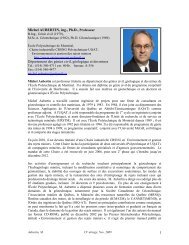
quasi-static pull test results is illustrated in Figure 3.<br />
The testing results showed good agreement with the<br />
design criteria. The bolting system was neither <strong>to</strong>o<br />
stiff nor <strong>to</strong>o flexible.<br />
The instrumented pull test result consists <strong>of</strong> a<br />
load-displacement characteristic curve representing<br />
the possible performance <strong>of</strong> <strong>tendon</strong>s under the same<br />
relative displacement. Such a schematic characteristic<br />
curve is illustrated in Figure 4.<br />
Typical rock <strong>tendon</strong> behavior under quasi-static<br />
loading show an elastic displacement phase and a<br />
plastic displacement phase. For the benefit <strong>of</strong> this<br />
study, the idealized <strong>tendon</strong> reaction will be said <strong>to</strong><br />
have an elastic stiffness K e and a plastic stiffness K p .<br />
Some permanent displacement is said <strong>to</strong> occur when<br />
a <strong>tendon</strong> has been pulled past its elastic displacement<br />
Load (kN)<br />
160<br />
140<br />
120<br />
100<br />
80<br />
60<br />
40<br />
20<br />
Brunswick Mine MCB Pullout Tests Results<br />
0<br />
0 20 40 60 80 100<br />
Displacement (mm)<br />
*bolts not tested <strong>to</strong> failure<br />
bolt2sulph bolt4sulph bolt5sulph bolt6sulph bolt3seds<br />
Figure 3. Summary <strong>of</strong> quasi-static pullout test results performed<br />
at Brunswick mine.
Figure 4. Schematic <strong>of</strong> typical pull test result curve.<br />
range in<strong>to</strong> its plastic deformation range. The plastic<br />
stiffness K p as can be measured in a quasi-static pull<br />
tests will be used later <strong>to</strong> estimate the <strong>tendon</strong> <strong>support</strong>’s<br />
reaction <strong>to</strong> impact loading. If a pull test is<br />
done for that purpose, it is important <strong>to</strong> pull the <strong>tendon</strong><br />
long enough <strong>to</strong> gather a significant part <strong>of</strong> the<br />
plastic deformation behavior without necessarily carrying<br />
it <strong>to</strong> failure which can be hazardous.<br />
3.2 Impact testing<br />
The impact testing facility located at NTC used a<br />
drop weight <strong>to</strong> induce displacement <strong>of</strong> the tested<br />
<strong>tendon</strong> at a fixed initial impact velocity. For impact<br />
testing, the rig can be set for a drop mass <strong>of</strong> a maximum<br />
<strong>of</strong> 1000 kg over a fall distance <strong>of</strong> no more than<br />
2 m. The potential energy is thus <strong>of</strong> a maximum <strong>of</strong><br />
20 kJ. Figure 5 illustrates the details <strong>of</strong> the impact<br />
test rig.<br />
The drop weight is attached <strong>to</strong> a release system<br />
located on the <strong>to</strong>p part <strong>of</strong> the facility. Once released,<br />
the annular shaped impact mass slides along the test<br />
tube until it collides with the reaction plate. The latter<br />
is <strong>support</strong>ed by the <strong>tendon</strong> installed in a test tube<br />
<strong>of</strong> an internal diameter <strong>of</strong> 38 mm and <strong>of</strong> 9.5 mm wall<br />
thickness. Each sample is prepared and installed as<br />
it would be underground using a s<strong>to</strong>per mounted<br />
horizontally on a track. A s<strong>to</strong>per is a hand-held mining<br />
drill that can be used <strong>to</strong> drill boreholes and install<br />
ro<strong>of</strong> <strong>support</strong>.<br />
All tests were instrumented using a load cell located<br />
on the <strong>to</strong>p part <strong>of</strong> the machine, reading load on<br />
the test tube, a load cell underneath the reaction plate,<br />
reading load on the <strong>tendon</strong>, and a potentiometer attached<br />
on the <strong>tendon</strong> <strong>to</strong> read displacement <strong>of</strong> the bar.<br />
The steel mass is hoisted in<strong>to</strong> position using a 5 <strong>to</strong>n<br />
capacity crane. All 1.7 m long MCB pro<strong>to</strong>type samples<br />
were spun in<strong>to</strong> two Fosroc 915 mm length and 35<br />
mm diameter resin cartridges. The first cartridge has<br />
a speed index <strong>of</strong> 30 (for fast), and is <strong>of</strong> type<br />
35915M35. The second has a speed index <strong>of</strong> 240 (for<br />
slow), and is <strong>of</strong> type 35910LIF90. All samples were<br />
Figure 5. NTC Impact test rig schematic.<br />
1-Load cell 1<br />
2-Load cell 2<br />
3-Drop weight<br />
4-Sample holder<br />
5-Holding rods<br />
6-Spacer<br />
7-Coupling<br />
8-Frame<br />
9-Tendon<br />
(in sample holder)<br />
10-Displacement<br />
transducer<br />
pushed through the slow setting resin, then pushed<br />
and rotated through the fast setting resin, <strong>to</strong> simulate<br />
a jackleg/s<strong>to</strong>per installation underground. Loaddisplacement<br />
curves generated from the tests are<br />
based on the measurements made from the superposition<br />
<strong>of</strong> load curves from the <strong>to</strong>p and bot<strong>to</strong>m load<br />
cells. The surface area under the load-displacement<br />
curve representing the work energy dissipated is<br />
typically calculated from the bot<strong>to</strong>m load cell when<br />
available.<br />
Data was recorded using a LeCroy 9424E Quad<br />
350 MHz oscilloscope. Three channels were used<br />
for the test, two for the load cells, and one for the<br />
displacement transducer. The <strong>to</strong>p load cell was an<br />
RST model SGA-75-1.30 <strong>of</strong> 34 <strong>to</strong>n capacity. The<br />
bot<strong>to</strong>m load cell was a Sensotec model TH/1591-01<br />
<strong>of</strong> 90 <strong>to</strong>n capacity. Each cell was connected <strong>to</strong> a<br />
Vishay P-3500 strain indica<strong>to</strong>r. The amplified signal<br />
was recorded using the oscilloscope. The displacement<br />
transducer was a UniMeasure P-20A potentiometer.<br />
Although a large number <strong>of</strong> data points were collected<br />
in little time (40, 000 data points in 0.2 seconds),<br />
the waveform recorded was noisy. The<br />
source <strong>of</strong> the noise is assumed <strong>to</strong> be due <strong>to</strong> environmental<br />
electrical and magnetic disturbances whose<br />
source was generated by machines and power distribution<br />
around the pilot plant at NTC. Voltage jolts<br />
<strong>of</strong>ten triggered the oscilloscope, and the amplitude<br />
and frequency <strong>of</strong> the ambient noise was erratic. A<br />
wavelet filter provided the ability <strong>of</strong> rejecting the<br />
white noise and was considered well suited for the<br />
transient nature <strong>of</strong> the recorded displacement and<br />
load waveforms. The removal <strong>of</strong> noise from noisy<br />
data <strong>to</strong> obtain the unknown signal is referred <strong>to</strong> as<br />
denoising. The wavelet shrinkage method (Wolfram<br />
Research, 1996) was used <strong>to</strong> suppress the white<br />
noise.
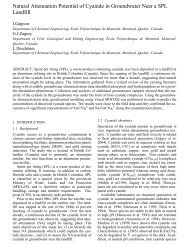
25<br />
20<br />
Sample 17-1-1<br />
4 PROPOSED DISPLACEMENT<br />
EVALUATION METHOD FOR<br />
TENDONS SUBMITTED TO IMPACT<br />
LOADING<br />
Load (<strong>to</strong>ns)<br />
15<br />
10<br />
In this section, a displacement evaluation method is<br />
proposed for <strong>tendon</strong>s <strong>submitted</strong> <strong>to</strong> impact loading,<br />
given a <strong>tendon</strong> burden, impact velocity, the <strong>tendon</strong>’s<br />
5<br />
0<br />
0 50 100 150<br />
Displacement (mm)<br />
force1 (metric<strong>to</strong>n)<br />
Figure 6. Impact test result on specimen 17-1-1.<br />
force2 (metric<strong>to</strong>n)<br />
Figure 6 illustrates one impact test result on a<br />
MCB specimen. The figure illustrates processed filtered<br />
signals from one test, in load-displacement<br />
form. Displacements and loads have been combined<br />
on the graph from which work energy can be calculated<br />
as the area under the curve. The oscillations,<br />
mostly detectable on the <strong>to</strong>p frame load cell (force1),<br />
may correspond <strong>to</strong> the natural frequency <strong>of</strong> the <strong>tendon</strong>-tube-impact<br />
machine system.<br />
Specimens were typically tested numerous times,<br />
thus using numerous cycles <strong>of</strong> loading. Permanent<br />
damage <strong>to</strong> the steel was only detectable if the load<br />
measurement at the end <strong>of</strong> each loading run exceeded<br />
the elastic limit <strong>of</strong> the steel material.<br />
Impact tests demonstrated that the MCB pro<strong>to</strong>type<br />
could absorb an impact load <strong>of</strong> 1000 kg over<br />
1.5 m drop height, resulting in an impact speed <strong>of</strong><br />
5.4 m/s. Multiple impacts were imparted on each<br />
specimen. Since the specimen’s reaction plate was<br />
driven further down at each test, the impact velocity<br />
was changed at each loading cycle. Can one add the<br />
absorbed energy from each test <strong>to</strong> conclude on the<br />
energy absorption capacity <strong>of</strong> the MCB <strong>tendon</strong> It<br />
appears that testing results are influenced by the impact<br />
speed and the size <strong>of</strong> the drop weight, but <strong>to</strong><br />
which extent Table 2 contains a brief summary <strong>of</strong><br />
testing results on five different MCB samples. In<br />
section 4 a method is proposed <strong>to</strong> calculate the energy<br />
absorption capacity <strong>of</strong> <strong>tendon</strong> <strong>support</strong> <strong>systems</strong><br />
<strong>submitted</strong> <strong>to</strong> dynamic loading as a function <strong>of</strong> <strong>tendon</strong><br />
burden and impact velocity.<br />
It will be demonstrated using the methodology<br />
presented in section 4 that the choice <strong>of</strong> the drop<br />
mass and impact velocity can affect the <strong>to</strong>tal additive<br />
energy calculated for a <strong>tendon</strong> <strong>support</strong> system.<br />
Table 2. Tendons tested <strong>to</strong> failure and <strong>tendon</strong> load measured<br />
during last cycle <strong>of</strong> loading.<br />
Sample Cycles <strong>to</strong><br />
failure<br />
17-3 4 at 1000<br />
kg<br />
17-11 4 at 1000<br />
kg<br />
17-12 4 at 750<br />
kg<br />
17-13 4 at 750<br />
kg (no<br />
failure)<br />
17-14 5 at 750<br />
kg<br />
Energy<br />
absorption<br />
by cycle<br />
(kJ)<br />
16.4+17.5+<br />
18.3+7.4<br />
17.3+17.0+<br />
12.7+3.2<br />
11.0+12.0+<br />
12.3+10.6<br />
11.6+12.1+<br />
12.9+14.2<br />
10.6+11.4+<br />
12.3+13.0+<br />
12.4<br />
Total<br />
additive<br />
energy<br />
(kJ)<br />
Load at<br />
failure<br />
(<strong>to</strong>ns)<br />
59.6 Not<br />
available<br />
50.3 19.6<br />
thread failed<br />
45.9 23.7<br />
nut slipped<br />
50.8 Not<br />
applicable<br />
59.6 23.0<br />
thread failed<br />
yield point and its plastic stiffness under quasi-static<br />
loading. The method can be used <strong>to</strong> estimate the<br />
tensile load within a <strong>tendon</strong> <strong>submitted</strong> <strong>to</strong> axial impact<br />
loading. The proposed calculation method<br />
could be used <strong>to</strong> interpret the maximum energy absorption<br />
capacity <strong>of</strong> the <strong>tendon</strong> for a single impact,<br />
and <strong>to</strong> evaluate the maximum load in the <strong>tendon</strong> for<br />
a given choice <strong>of</strong> ejection velocity and <strong>tendon</strong> burden.<br />
The ejection velocity could be derived from energetic<br />
considerations equations, given a plausible violent<br />
rock mass failure <strong>of</strong> a given depth and expected<br />
energy. The burden <strong>of</strong> the <strong>tendon</strong>, or impact mass,<br />
can be estimated from the depth <strong>of</strong> failure expected<br />
in the rock mass and the bolting pattern applied.<br />
One could evaluate if the <strong>tendon</strong> can withstand the<br />
given impact, by verifying if the axial load in the<br />
bolt exceeds its ultimate tensile strength.<br />
An adequate model for <strong>tendon</strong> displacement <strong>submitted</strong><br />
<strong>to</strong> impact loading is required <strong>to</strong> analyze impact<br />
test results and could ultimately be used <strong>to</strong> predict<br />
the energy absorption capacity <strong>of</strong> <strong>support</strong><br />
<strong>systems</strong>. Cyclic impact testing was performed on<br />
the MCB bolting system. Although it would have<br />
been interesting <strong>to</strong> set the impact testing for higher<br />
impact energy, so as <strong>to</strong> break the <strong>tendon</strong> on first impact<br />
and directly evaluate its maximum energy absorption<br />
capacity, the available equipment could not<br />
be set for higher drop heights nor bigger drop<br />
weights. The relative effect <strong>of</strong> an increase <strong>of</strong> the<br />
impact velocity and/or the drop height in the testing<br />
pro<strong>to</strong>col on the <strong>tendon</strong>’s response must also be assessed.<br />
For the benefit <strong>of</strong> the MCB testing program,<br />
the velocity for all tests was higher than 5 m/s, and
increasing at every cycle <strong>of</strong> loading for one sample<br />
since the <strong>tendon</strong> reaction plate was pushed further<br />
down with each blow. Drop loads were varied between<br />
750 kg and 1000 kg. The impact tests on the<br />
MCB pro<strong>to</strong>types have provided valuable information<br />
useful for the selection <strong>of</strong> a calculation method for<br />
the displacement <strong>of</strong> <strong>tendon</strong> <strong>support</strong> <strong>submitted</strong> <strong>to</strong> impact<br />
loading.<br />
The following phenomena were observed during<br />
the impact tests pro<strong>to</strong>col:<br />
− The impact load-displacement curves show an oscilla<strong>to</strong>ry<br />
behavior, possibly representing the exchange<br />
<strong>of</strong> load from the nut <strong>to</strong> the cone in a number<br />
<strong>of</strong> pulses through time. Ideally, the<br />
calculation method should reflect the oscilla<strong>to</strong>ry<br />
behavior.<br />
− When the so-called maximum load reaches a<br />
value larger than the static yield point <strong>of</strong> the steel,<br />
the carbon coating on the steel bar flakes <strong>of</strong>f,<br />
suggesting plastic deformation <strong>of</strong> the <strong>tendon</strong>.<br />
Ideally, the model should be applicable beyond<br />
the elastic range.<br />
− There are no signs <strong>of</strong> plastic deformation on steel<br />
bars for which the initial impact peak load (see<br />
Figure 6) was larger than the static yield point <strong>of</strong><br />
the steel.<br />
− The bar can slide further in<strong>to</strong> the test tube even at<br />
the last impact cycle on a sample, when the yield<br />
point <strong>of</strong> the steel is almost equal <strong>to</strong> the ultimate<br />
tensile strength.<br />
− Discrepancies in yield load were observed at the<br />
onset <strong>of</strong> movement.<br />
The discrepancies in yield load from one test <strong>to</strong><br />
the next can be due <strong>to</strong> the adhesion <strong>of</strong> the <strong>tendon</strong> in<br />
the resin matrix. If the adhesion is strong, the load<br />
transfer from the reaction plate <strong>to</strong> the conical anchor<br />
is not completely achieved before the plastic deformation<br />
wave travels back <strong>to</strong> its origin. This would<br />
result in premature deformation near the collar <strong>of</strong> the<br />
test tube, and a higher load response than normally<br />
measured at the onset <strong>of</strong> movement. This can momentarily<br />
create uneven steel properties over the<br />
<strong>tendon</strong> length. Overall, the observed phenomena<br />
suggest that the <strong>tendon</strong> <strong>support</strong> system materials can<br />
be hardened due <strong>to</strong> plastic strain, and that the impact<br />
cycles have no apparent effect on Young’s modulus<br />
or on the ultimate tensile strength <strong>of</strong> the steel.<br />
The proposed calculation method for the displacement<br />
evaluation <strong>of</strong> <strong>tendon</strong> <strong>support</strong> <strong>submitted</strong> <strong>to</strong><br />
impact loading is based on critically damped harmonic<br />
motion (Engel 1978, Derrick & Grossman<br />
1987, Thomas and Finney 1992, Van Sint Jan 1994)<br />
and incorporates a so-called “friction fac<strong>to</strong>r” and a<br />
yield point <strong>of</strong>fset. The critically damped harmonic<br />
motion model consists in a single spring and a dashpot<br />
attached <strong>to</strong> fixed points at each distant end and <strong>to</strong><br />
a mass at the inner end. A spring and a dashpot in series<br />
constitutes a Maxwell model (Mase 1970; Gibowicz<br />
1993). A Maxwell substance, or an elasticoviscous<br />
material, behaves differently under rapidly<br />
changing stress in contrast with slow loading. The<br />
MCB <strong>support</strong> system behavior displays this characteristic.<br />
The friction fac<strong>to</strong>r is a force referring <strong>to</strong><br />
friction loss and heat dissipation during impact loading;<br />
it is not a yield point. Thus unlike a true Maxwell<br />
substance, the proposed model incorporates the<br />
combination <strong>of</strong> the so-called friction force <strong>of</strong> the<br />
<strong>tendon</strong> in the holding matrix and the action <strong>of</strong> the<br />
yield point when the <strong>tendon</strong> goes beyond the plastic<br />
range.<br />
The proposed calculation method consists <strong>of</strong> two<br />
main steps. The first relies on a rheological model<br />
used <strong>to</strong> simulate the displacement <strong>of</strong> a <strong>tendon</strong> under<br />
impact loading. The second involves potential energy<br />
and work balanced with the friction fac<strong>to</strong>r imparted<br />
<strong>to</strong> the rheological model. The outcome is the<br />
approximation <strong>of</strong> the maximum <strong>tendon</strong> displacement<br />
under impact loading, or alternatively its maximum<br />
axial load for a given mass, impact velocity and<br />
characteristic plastic stiffness. The rheological<br />
model chosen <strong>to</strong> simulate the displacement <strong>of</strong> <strong>tendon</strong><br />
<strong>support</strong> under impact loading consists <strong>of</strong> a mass attached<br />
<strong>to</strong> a slider, a spring, and a dashpot in series<br />
(Figure 7). The mass m is impacted at initial velocity<br />
and displacement v 0 and x 0 . The spring has a<br />
plastic stiffness <strong>of</strong> k p <strong>to</strong> which is added a constant<br />
yield force <strong>of</strong> F y when displaced. The dashpot has a<br />
damping fac<strong>to</strong>r c, proportional <strong>to</strong> the plastic stiffness<br />
<strong>of</strong> the spring and <strong>to</strong> the size <strong>of</strong> the impact mass.<br />
Positive displacement x is downwards.<br />
Figure 7. Rheological model.<br />
The overall constant yield force value Fy (N) consists<br />
<strong>of</strong>:<br />
F y = YieldLoad + F f (1)<br />
where YieldLoad is the yield load (N) <strong>of</strong> the <strong>tendon</strong><br />
material and F f is the friction fac<strong>to</strong>r (N) representing<br />
all sources <strong>of</strong> friction losses.<br />
The model should then require only input parameters<br />
that are known a priori from quasi-static pull<br />
testing results and specifics, such as the impact mass<br />
and initial velocity, the <strong>tendon</strong> <strong>support</strong> system plastic<br />
stiffness, and the yield load <strong>of</strong> the <strong>tendon</strong> material.
Solving the equilibrium <strong>of</strong> this model (e.g. Figure<br />
7) for forces, we have:<br />
2<br />
d x dx<br />
m + c + k<br />
p<br />
x + Fy<br />
= 0<br />
2<br />
(2)<br />
dt dt<br />
where m is the mass (N), c the damping fac<strong>to</strong>r, k p<br />
the plastic system stiffness (N/m) as evaluated from<br />
pull testing <strong>of</strong> the <strong>tendon</strong>, and F y the overall constant<br />
yield force (N) for the displacement <strong>of</strong> the system,<br />
calculated as the addition <strong>of</strong> the <strong>tendon</strong> material’s<br />
yield load and the friction fac<strong>to</strong>r (eq. 1).<br />
Assuming a critically damped system, the solution<br />
<strong>to</strong> the second order non-homogeneous differential<br />
equation is:<br />
F<br />
−wt y<br />
xg<br />
= ( C1<br />
⋅t<br />
+ C2<br />
) ⋅ e −<br />
(3)<br />
k<br />
w =<br />
k p<br />
m<br />
F<br />
C1 = v0<br />
+ w ⋅ (x<br />
0<br />
+<br />
k<br />
C<br />
2<br />
F<br />
= x<br />
0<br />
+<br />
k<br />
y<br />
p<br />
y<br />
p<br />
)<br />
p<br />
(4)<br />
(5)<br />
(6)<br />
where x g (m) is the model’s calculated <strong>tendon</strong><br />
head displacement (3), k p (N/m) the plastic stiffness<br />
<strong>of</strong> the <strong>tendon</strong> <strong>support</strong> system, m is the mass (N), x 0<br />
(m) and v 0 (m/s) the initial displacement and speed<br />
respectively, t is the time (s) and C 1 and C 2 the particular<br />
solution constants.<br />
The force in the <strong>tendon</strong> F bar (N) can be calculated<br />
using:<br />
F bar<br />
x ⋅ k p<br />
(7)<br />
= g<br />
and the potential energy absorption (J) can be calculated<br />
as:<br />
m ⋅ v<br />
2 0<br />
E bar<br />
= + m ⋅ g ⋅ max x<br />
(8)<br />
2<br />
where g is the gravitational constant (m/s 2 ) and<br />
max x (m) the maximum displacement calculated.<br />
The work We (J) required <strong>to</strong> pull out the <strong>tendon</strong><br />
in impact load can be calculated from the load displacement<br />
graph:<br />
We = Fdx<br />
(9)<br />
∫<br />
The variables for the rheological model equations<br />
(3-6) are parameters m (N), x 0 (m) and v 0 (m/s)<br />
which must be defined by the user. The yield load <strong>of</strong><br />
the <strong>tendon</strong> material, consisting <strong>of</strong> part <strong>of</strong> the overall<br />
yield force value F y (N), as well as the plastic stiffness<br />
<strong>of</strong> the system k p (N/m), are fac<strong>to</strong>rs specific <strong>to</strong><br />
the <strong>tendon</strong> <strong>support</strong> system. They can be drawn preferably<br />
from quasi-static pull testing and materials<br />
specifications, or alternatively from impact tests results.<br />
In the latter case, the plastic impact stiffness<br />
can be calculated from the end <strong>of</strong> the load displacement<br />
curve at small impact weight velocity, where<br />
the peak may appear if the impact load was sufficiently<br />
strong <strong>to</strong> deform the <strong>tendon</strong>. In normal conditions,<br />
the initial displacement is set <strong>to</strong> zero and the<br />
initial velocity corresponds <strong>to</strong> the impact velocity or<br />
block ejection velocity. The mass corresponds <strong>to</strong> the<br />
impact weight or the <strong>tendon</strong> burden.<br />
In order <strong>to</strong> obtain the axial load in the <strong>tendon</strong> as<br />
well as the energy quantity absorbed through the<br />
<strong>tendon</strong>’s movement in impact load, one can follow<br />
the following steps (the use <strong>of</strong> a spreadsheet is recommended):<br />
1 Define an arbitrary friction force F f representing<br />
the friction losses and other energy dissipation<br />
sources. For the first iteration, it is suggested <strong>to</strong><br />
use the <strong>tendon</strong> <strong>support</strong> system’s yield load measured<br />
with pull tests, if not available the yield load<br />
<strong>of</strong> the <strong>tendon</strong> material.<br />
2 Calculate the axial displacement x g for different<br />
time increments, typically in the order <strong>of</strong> milliseconds,<br />
using equations (1), (3), (4), (5) and (6).<br />
3 Calculate the axial force in the <strong>tendon</strong> F bar using<br />
equation (7).<br />
4 Construct a load displacement graph for the reaction<br />
<strong>of</strong> the <strong>tendon</strong>. The graph must be set so that<br />
if the axial force in the <strong>tendon</strong> F bar is not greater<br />
than the friction force F f , then the force in the<br />
<strong>tendon</strong> F bar equals the friction force F f .<br />
5 Calculate the potential energy dissipated through<br />
the <strong>tendon</strong> E bar using equation (8).<br />
6 Calculate the work done during the pull We using<br />
equation (9).<br />
7 Repeat steps 1 <strong>to</strong> 6 until the potential energy Ebar<br />
is approximately equal <strong>to</strong> the work We.<br />
For modeling <strong>of</strong> the MCB system in single impact,<br />
the fac<strong>to</strong>r k p can be estimated at 775 kN/m,<br />
which corresponds <strong>to</strong> the possible stiffest response<br />
calculated from the quasi-static loading tests<br />
(Gaudreau 2004). Higher values <strong>of</strong> k p are required<br />
<strong>to</strong> calculate the MCB system’s reaction <strong>to</strong> multiple<br />
impacts. The plastic stiffness k p as measured from<br />
impact load-displacement graphs <strong>of</strong> a number <strong>of</strong> test<br />
specimens falls within the range <strong>of</strong> 760 <strong>to</strong> 1050<br />
kN/m. The quasi-static evaluation <strong>of</strong> k p from test<br />
specimens is in the range <strong>of</strong> 630 <strong>to</strong> 775 kN/m. It<br />
could be argued that the stiffest potential quasi-static<br />
k p is within the range <strong>of</strong> the impact plastic stiffness.<br />
The steel yield load has a value <strong>of</strong> 112 kN for the<br />
17.2 mm diameter MCB. Since the energy balance<br />
exercise is an iterative process, any value close <strong>to</strong> the<br />
<strong>tendon</strong>’s yield load is considered satisfac<strong>to</strong>ry as a<br />
first trial for the friction force.<br />
Figures 8 <strong>to</strong> 10 show the <strong>tendon</strong> load evaluation<br />
result for a sample having a k p value <strong>of</strong> 1050 kN/m,<br />
a yield load <strong>of</strong> 112 kN, and a friction force F f <strong>of</strong> 93<br />
kN, at an impact weight <strong>of</strong> 1000 kg and initial impact<br />
velocity <strong>of</strong> 5.7 m/s. This impact velocity corresponds<br />
<strong>to</strong> a drop height <strong>of</strong> 1.66 m and the k p value <strong>to</strong><br />
a <strong>tendon</strong> whose grout matrix could have stiffened
under a first large impact. The maximum load<br />
evaluated in the bar is 169 kN (see Figures 8 <strong>to</strong> 10),<br />
and the simulated impact time <strong>to</strong> the onset <strong>of</strong> elastic<br />
recovery is 70 ms (see Figure 8). On a similar set<br />
up, 163 kN was measured for maximum <strong>tendon</strong> load<br />
on sample 17-11-2 (Gaudreau 2004) and the impact<br />
duration was 61.2 ms <strong>to</strong> elastic recovery and 74 ms<br />
FORCE (kN)<br />
1<br />
180<br />
170<br />
160<br />
150<br />
140<br />
130<br />
120<br />
110<br />
100<br />
90<br />
80<br />
70<br />
60<br />
50<br />
40<br />
30<br />
20<br />
10<br />
0<br />
0<br />
FRICTION<br />
FORCE<br />
0.01<br />
Calculated <strong>tendon</strong> axial load vs time<br />
0.02<br />
0.03<br />
0.04<br />
0.05<br />
TIME (s)<br />
0.06<br />
Figure 8. Calculated <strong>tendon</strong> axial load graph.<br />
LOAD (kN)<br />
250<br />
200<br />
150<br />
100<br />
50<br />
0<br />
30<br />
59<br />
88<br />
117<br />
146<br />
175<br />
FORCE 1<br />
204<br />
233<br />
262<br />
FORCE 2<br />
291<br />
320<br />
349<br />
378<br />
407<br />
436<br />
Filtered data representation<br />
465<br />
494<br />
523<br />
552<br />
581<br />
610<br />
639<br />
668<br />
697<br />
726<br />
755<br />
784<br />
813<br />
842<br />
871<br />
900<br />
929<br />
958<br />
987<br />
0.07<br />
1016<br />
1045<br />
1074<br />
1103<br />
1132<br />
0.08<br />
1161<br />
1190<br />
1219<br />
1248<br />
1277<br />
0.09<br />
RHEO_F2<br />
Time step<br />
RHEO_F2 FORCE1 FORCE2<br />
Figure 9. Filtered data representation for instrument signals<br />
during test 17-11-2.<br />
Force (kN)<br />
180<br />
170<br />
160<br />
150<br />
140<br />
130<br />
120<br />
110<br />
100<br />
90<br />
80<br />
70<br />
60<br />
50<br />
40<br />
30<br />
20<br />
10<br />
0<br />
0<br />
Calculated <strong>tendon</strong> axial load vs displacement<br />
0.02<br />
0.04<br />
0.06<br />
0.08<br />
0.1<br />
Displacement (m)<br />
Figure 10. Calculated load-displacement graph.<br />
for the complete test. The friction force <strong>of</strong> 93 kN<br />
falls in<strong>to</strong> the tested labora<strong>to</strong>ry measured range <strong>of</strong> 80<br />
<strong>to</strong> 154 kN.<br />
Figure 9 contains a superposition <strong>of</strong> impact test<br />
results for sample number 17-11-2 and that <strong>of</strong> the<br />
proposed calculation model. Force 1 is the measured<br />
0.12<br />
0.14<br />
1306<br />
1335<br />
0.16<br />
1364<br />
1393<br />
1422<br />
0.1<br />
1451<br />
1480<br />
0.18<br />
250<br />
200<br />
150<br />
100<br />
50<br />
0<br />
load on the <strong>to</strong>p <strong>of</strong> the load frame, Force 2 is the load<br />
measured just underneath the reaction plate and<br />
Rheo_F2 is the calculated reaction from the model.<br />
The model is in good agreement with the experimental<br />
data, notably for the calculation <strong>of</strong> the maximum<br />
load in the <strong>tendon</strong> at the onset <strong>of</strong> elastic recovery<br />
(end <strong>of</strong> the loading cycle).<br />
The proposed displacement evaluation method for<br />
<strong>tendon</strong>s <strong>submitted</strong> <strong>to</strong> impact loading can be used <strong>to</strong><br />
estimate the maximum energy absorption capacity <strong>of</strong><br />
a given <strong>tendon</strong> <strong>submitted</strong> <strong>to</strong> impact load. The potential<br />
energy absorption <strong>of</strong> a <strong>tendon</strong> can be estimated by<br />
matching the calculated maximum load <strong>to</strong> the known<br />
ultimate tensile capacity <strong>of</strong> the <strong>tendon</strong>. The latter can<br />
be measured from cyclic impact testing or simply<br />
taken from the <strong>tendon</strong> material’s specifications.<br />
For example, if the model is used for a plastic<br />
stiffness range corresponding <strong>to</strong> that <strong>of</strong> the quasistatic<br />
pull out testing results <strong>of</strong> the program, the calculated<br />
single impact absorption capacity <strong>of</strong> the pro<strong>to</strong>type<br />
MCB ranges from 32 <strong>to</strong> 40 kJ. This result<br />
was attained by fixing the impact mass velocity at<br />
5.4 m/s and by increasing the impact weight only <strong>to</strong><br />
match the ultimate tensile strength <strong>of</strong> the <strong>tendon</strong>.<br />
With the same range <strong>of</strong> plastic stiffness and drop<br />
weight <strong>of</strong> 1000 kg, one can calculate the capacity<br />
range <strong>of</strong> the MCB <strong>tendon</strong> system by modifying the<br />
impact speed. The result <strong>of</strong> such an approach ranges<br />
from 29 <strong>to</strong> 35 kJ. It appears that there is no particular<br />
solution <strong>to</strong> the energy absorption capacity <strong>of</strong> a<br />
<strong>tendon</strong>. The latter depends on the combination <strong>of</strong><br />
ejection speed and <strong>tendon</strong> burden. Further <strong>to</strong> this,<br />
one can consider that the choice <strong>of</strong> the potential ejection<br />
speed is critical <strong>to</strong> the evaluation <strong>of</strong> the level <strong>of</strong><br />
energy absorption capacity <strong>of</strong> a <strong>tendon</strong>. For example,<br />
if an ejection velocity <strong>of</strong> 3.0 m/s is selected,<br />
comparable <strong>to</strong> that selected in the literature review<br />
as responsible for the onset <strong>of</strong> damage in headings,<br />
the minimum MCB system capacity becomes 45 kJ.<br />
By lowering the plastic stiffness <strong>of</strong> the bolting system<br />
within the range found in quasi-static testing,<br />
the bolt reacts entirely in “friction” energy dissipation<br />
and its capacity is 50 kJ. The friction energy<br />
dissipation in the proposed model equations could<br />
include energy losses due <strong>to</strong> mechanisms other than<br />
friction such as heat losses and noise. Also, more<br />
representative equations could also be used <strong>to</strong> represent<br />
the high strain rate behavior <strong>of</strong> steel (e.g. Uenishi<br />
& Teodosiu, 2004), but this aspect was deemed<br />
unnecessary at this point <strong>of</strong> our investigation.<br />
After cyclic impact testing <strong>to</strong> the failure <strong>of</strong> the <strong>tendon</strong>,<br />
samples 17-11 and 17-14 were sawed apart <strong>to</strong><br />
measure the amount <strong>of</strong> displacement <strong>of</strong> the cone inside<br />
the resin. These two samples were chosen because they<br />
had been tested using two different drop masses. Figure<br />
11 and 12 illustrate the split test tube samples. Figure<br />
11 shows the cone moved 127 mm in<strong>to</strong> the resin matrix.<br />
The drop mass used for cyclic impact tests on this<br />
sample weighed 1000 kg. Figure 12 shows the cone
moved 177 mm in<strong>to</strong> the resin matrix. The mass used<br />
for these cyclic impact tests weighed 750 kg. The figures<br />
and the proposed calculation method for the <strong>tendon</strong><br />
displacement under impact loading demonstrate<br />
that the pro<strong>to</strong>type MCB both plastically elongates and<br />
“plows” through the resin at different degrees depending<br />
on the mass-ejection velocity couple.<br />
An application <strong>of</strong> the proposed displacement<br />
evaluation method on cyclic impact testing was considered<br />
in context <strong>of</strong> this study (Gaudreau, 2004).<br />
However, once the first impact has proceeded, it becomes<br />
difficult <strong>to</strong> evaluate with certainty what the<br />
effect <strong>of</strong> each impact cycle is on the material properties<br />
imparted <strong>to</strong> the model, particularly for the plastic<br />
stiffness <strong>of</strong> the <strong>tendon</strong> <strong>support</strong> system. For example,<br />
one can refer <strong>to</strong> the estimated load for the second<br />
impact test on sample 17-12 shown in Figures 8 <strong>to</strong><br />
10 where the plastic stiffness <strong>of</strong> the <strong>support</strong> reaction<br />
was chosen <strong>to</strong> be the maximum plastic impact stiffness<br />
measured for all tests.<br />
It is clear that the choice <strong>of</strong> <strong>tendon</strong> burden and<br />
impact velocity has the greatest influence on the<br />
overall calculated or estimated performance <strong>of</strong> <strong>tendon</strong><br />
<strong>support</strong> under impact loading. The phenomenon<br />
is accentuated when using small impact velocities or<br />
small drop masses. According <strong>to</strong> the modeled response,<br />
more energy could be dispersed by other<br />
means than plastic elongation. Note that steel also<br />
exhibits non-linear plastic deformation characteristics<br />
under impact load (e.g. Ansell 1999, Figure 9).<br />
This is not accounted for in the proposed calculation<br />
method.<br />
There is no consideration in the calculation<br />
method for the adhesion <strong>of</strong> the <strong>tendon</strong> inside a holding<br />
matrix. The overall work required <strong>to</strong> debond the<br />
<strong>tendon</strong> from the holding matrix could be added <strong>to</strong><br />
the work required <strong>to</strong> pull it in eq. (8). A greater adhesion<br />
would increase the energy absorption capacity<br />
<strong>of</strong> the <strong>tendon</strong> but could reduce its ability <strong>to</strong> slide.<br />
Thus, it was not incorporated in<strong>to</strong> the proposed calculation<br />
method.<br />
5 DISCUSSION AND CONCLUSION<br />
Figure 11. Split test tube for sample 17-11.<br />
In essence, simple pull out testing <strong>of</strong> <strong>tendon</strong> <strong>support</strong><br />
could be envisioned as a means <strong>of</strong> constructing a set<br />
<strong>of</strong> observations that can be used <strong>to</strong> approximate the<br />
reaction <strong>of</strong> <strong>tendon</strong> <strong>support</strong> in impact load given a<br />
simple calculation method such as that presented in<br />
section 4. The impact testing rig at NTC premises<br />
was quite useful in understanding controlling parameters<br />
for the performance <strong>of</strong> <strong>tendon</strong> <strong>support</strong><br />
<strong>submitted</strong> <strong>to</strong> impact loading. Although simplified,<br />
the displacement evaluation method for <strong>tendon</strong>s<br />
<strong>submitted</strong> <strong>to</strong> impact loading could be an asset <strong>to</strong> the<br />
engineer wishing <strong>to</strong> postulate on the best choice <strong>of</strong> a<br />
<strong>support</strong> system for a given failure mechanism. The<br />
model is valid for a velocity range corresponding <strong>to</strong><br />
that <strong>of</strong> plausible rockbursts.<br />
REFERENCES<br />
Figure 12. Split test tube for sample 17-14.<br />
Ansell, A. 1999. Dynamically Loaded Rock Reinforcement.<br />
Doc<strong>to</strong>ral Thesis, Royal Institute <strong>of</strong> Technology, Sweden,<br />
Bulletin 52, 185 p.<br />
Cook, N.G.W. 1965. A note on rockbursts considered as a<br />
problem <strong>of</strong> stability. J. S. Afr. Inst. Min. Metall., pp. 437-<br />
446.<br />
Cook, N.G.W. & Ortlepp, W.D. 1968. A yielding rockbolt.<br />
Chamber <strong>of</strong> Mines <strong>of</strong> South Africa. Research Organization<br />
Bulletin, no. 14, Aug. 1968.<br />
Derrick, W.R. & Grossman, S.I. 1987. A first course in differential<br />
equations with applications, 3rd edition. West Publishing<br />
Company.<br />
Dyskin, A.V. & Germanovich, L.N. 1993. Model <strong>of</strong> rockburst<br />
caused by cracks growing near free surface. Rockbursts<br />
and Seismicity in Mines, Young (ed.). Balkema, Rotterdam.<br />
pp. 169-174.<br />
Engel, P.A. 1978. Impact Wear <strong>of</strong> Materials. Eslevier Scientific<br />
Publishing Company, 339 p.<br />
Fay, A.H. 1947. A glossary <strong>of</strong> the mining and mineral industry.<br />
United States Bureau <strong>of</strong> Mines Bulletin 95 (reprinted<br />
from 1920 edition without changes).<br />
Gaudreau, D. 2000. Yieldable Tendon Support, report on Q4-<br />
2000 MCB impact testing. Noranda Inc. Technology Centre<br />
internal report, project R2-9684.
Gaudreau, D. 2004. <strong>Performance</strong> Assessment <strong>of</strong> Tendon Support<br />
Systems Submitted <strong>to</strong> Dynamic Loading. Masters Degree<br />
Thesis, École Polytechnique de Montréal.<br />
Gibowicz, S.J. 1993. An introduction <strong>to</strong> mining seismology.<br />
Academic Press. 399p.<br />
Gillerstedt, P. 1999. Full scale pull- and shear labora<strong>to</strong>ry tests<br />
<strong>of</strong> conebolts (unpubl.). Boliden Ltd.<br />
Haile, A.T., Jager, A.J. & Wojno, L. 1995. Strata control in<br />
tunnels and an evaluation <strong>of</strong> <strong>support</strong> units and <strong>systems</strong> currently<br />
used with a view <strong>to</strong> improving the effectiveness <strong>of</strong><br />
<strong>support</strong> stability and safety <strong>of</strong> tunnels. Simrac report<br />
GAP026, CSIR Division <strong>of</strong> Mining Technology.<br />
Hoek, E. 2000. Rock engineering. Course notes by Evert<br />
Hoek, 264 p.<br />
Hoek, E., Kaiser, P.K. & Bawden, W.F. 1995. Support <strong>of</strong> Underground<br />
Excavations in Hard Rock. Balkema, Rotterdam,<br />
215 p.<br />
Jager, A.J., Wojno, L.S. & Dawe, S.G. 1990. Rock Support<br />
Tendons which May be Caused <strong>to</strong> Yield. South African<br />
patent application 90/4879.<br />
Jager, A.J. 1992. Two new <strong>support</strong> units for the control <strong>of</strong><br />
rockburst damage. Proc. Rock Support in Mining and Underground<br />
Construction, Balkema, Rotterdam, pp. 621-631.<br />
Kaiser, P.K., Tannant, D.D., McCreath, D.R. & Jesenak, P.<br />
1992. Rockburst damage <strong>assessment</strong> procedure. Rock<br />
Support in Mining and Underground Contstruction, Kaiser<br />
& McCreath (eds), Balkema, Rotterdam, pp. 639-647.<br />
Kaiser, P., McCreath, D.R. & Tannant, D.D. 1996. Canadian<br />
Rockburst Support Handbook. Geomechanics Research<br />
Centre.<br />
Langille, C.C., Tannant, D.D. & Galbraith, J. 1995. Investigation<br />
<strong>of</strong> One-pass Grouted Support Systems for use in a High<br />
Stress Mining Environment. 97th Annual General Meeting<br />
<strong>of</strong> C.I.M. Rock Mechanics and Strata Control Session, Halifax,<br />
Nova Scotia, pp. 162-171.<br />
Maloney, S. & Kaiser, P.K. 1996. Evaluation <strong>of</strong> the Support<br />
Characteristics <strong>of</strong> Resin Grouted Conebolts at Brunswick<br />
Mine, a research proposal. Geomechanics Research Centre,<br />
Laurentian University, Submitted <strong>to</strong> Don Peterson, Ground<br />
Control Engineer, Noranda Mining and Exploration Limited,<br />
Brunswick Mining Division, 7 p.<br />
Mase, G.E. 1970. Continuum mechanics. Schaum’s outline<br />
series, McGraw-Hill, pp. 196-216.<br />
Maxwell, S.C. & Young, R.P. 1997. Assessing induced fracturing<br />
around underground excavations using velocity imaging<br />
and induced seismicity. Rockbursts and Seismicity in<br />
Mines, Gibowicz and Lasocki (eds), Balkema, Rotterdam,<br />
pp. 179-183.<br />
Mühlhaus, H.-B. 1990. Exfoliation phenomena in pre-stressed<br />
rock. Rockbursts and Seismicity in Mines, Fairhurst (edi<strong>to</strong>r),<br />
Balkema, Rotterdam, pp. 101-107.<br />
Ortlepp, W.D. 1992. Implosive-load testing <strong>of</strong> tunnel <strong>support</strong>.<br />
Rock Support in Mining and Underground Construction,<br />
Balkema, Rotterdam, pp. 675-682.<br />
Ortlepp, W.D., 1992a. Invited lecture: The design <strong>of</strong> <strong>support</strong><br />
for the containment <strong>of</strong> rockburst damage in tunnels – An<br />
engineering approach. Rock Support in Mining and Underground<br />
Construction, Kaiser and McCreath (eds),<br />
Balkema, Rotterdam.<br />
Ortlepp, W.D. 1993. High ground displacement velocities associated<br />
with rockburst damage. Rockbursts and Seismicity<br />
in Mines, Young ed., Balkema, pp. 101-106.<br />
Ortlepp, W.D. 1994. Grouted rock-studs as rockburst <strong>support</strong>:<br />
A simple design approach and an effective test procedure.<br />
The Journal <strong>of</strong> the South African Institute <strong>of</strong> Mining and<br />
Metallurgy, February 94, pp. 47-63.<br />
Ortlepp, W.D. & Stacey, T.R. 1998. <strong>Performance</strong> <strong>of</strong> Tunnel<br />
Support under Large Deformation Static and Dynamic<br />
Loading. Tunnelling and Underground Space Technology,<br />
Vol. 13, No. 1, pp. 15-21.<br />
Salamon, M.D.G. 1974. Rock mechanics <strong>of</strong> underground excavations.<br />
Advances in Rock Mechanics, Proc. 3rd Cong.<br />
Int. Soc. Rock Mech., Vol 1-B, pp. 951-1099.<br />
Simon, R., Aubertin, M. & Gill, D.E. 1998. Guide d’évaluation<br />
du potentiel de coups de terrain dans les mines à l’aide de la<br />
méthode ERP. IRSST, research report R-182.<br />
Simon, R. 1999. Analysis <strong>of</strong> fault-slip mechanisms in hard<br />
rock mining. Doc<strong>to</strong>ral Thesis, McGill University.<br />
Stacey, T.R. & Ortlepp, W.D. 2000. Support Appropriate for<br />
Dynamic Loading and Large Static Loading in Block Cave<br />
Mining Openings. MassMin 2000, Brisbane, Qld, pp. 783-<br />
789.<br />
Stacey, T.R. & Ortlepp, W.D. 1999. Retainment <strong>support</strong> for<br />
dynamic events in mines. Rock Support and Reinforcement<br />
Practice in Mining. Balkema, Rotterdam, pp.329-333.<br />
Stacey, T.R. & Ortlepp, W.D. 1994. Rockburst mechanisms<br />
and tunnel <strong>support</strong> in rockburst conditions. Geomechanics<br />
93, Rakowski (ed.). Balkema, Rotterdam.<br />
Stillborg, B. 1986. Pr<strong>of</strong>essional users handbook for rock bolting.<br />
Series on Rock and Soil Mechanics, Vol. 15. Trans<br />
Tech Publications, pp. 48-51.<br />
Tannant, D.D., Kaiser, P.K. & McDowell, G.M. 1992. Dynamic<br />
<strong>support</strong> moni<strong>to</strong>ring. Rock Support in Mining and<br />
Underground Construction, Kaiser & McCreath (eds).<br />
Balkema, Rotterdam, pp. 657-664.<br />
Tannant, D.D., Brummer, R.K. & Kaiser, P.K. 1994. Response<br />
<strong>of</strong> rockbolts <strong>to</strong> nearby blasts. International Workshop on<br />
Applied Rockburst Research, May 12, 1994, Santiago, pp.<br />
257-264.<br />
Tannant, D.D. & Buss, B.W. 1994. Yielding rockbolt anchors<br />
for high convergence or rockburst conditions. Proc. 47th<br />
Canadian Geotechnical Conference, Halifax.<br />
Thomas, G.B. & Finney, R.L. 1992. Calculus and Analytic<br />
Geometry, 8th edition. Addison-Wesley Publishing Company.<br />
Uenishi,A. & Teodosiu, C. 2004. Constitutive modeling <strong>of</strong> the<br />
high strain rate behaviour <strong>of</strong> interstitial-free steel. Int. J.<br />
Plasticity, Vol. 20, pp. 915-936.<br />
Van Sint Jan F., M. 1994. A Procedure <strong>to</strong> Design Tunnel Support<br />
for Rockburst Conditions. International Workshop on<br />
Applied Rockburst Research, Santiago, Chile, pp. 277-286.<br />
Wagner, H. 1984. Support requirements for rockburst conditions.<br />
Proceedings <strong>of</strong> the 1st International Congress on<br />
Rockbursts and Seismicity in Mines, Johannesburg, 1982.<br />
SAIMM, Johannesburg.<br />
Wolfram Research 1996. Mathematica Wavelet Explorer.<br />
S<strong>of</strong>tware reference manual.<br />
Woyno, L., Jager, A.J. & Roberts, M.K.C. 1987. Recommended<br />
performance requirements for yielding rock <strong>tendon</strong>s.<br />
SANGORM Symposium – Design <strong>of</strong> Rock Reinforcing:<br />
Components and Systems, Johannesburg, pp. 71-74.<br />
Yu, T.R. 1980. Ground Control at Kidd Creek Mine. Underground<br />
Rock Engineering, CIM Special Volume 22, The<br />
Canadian Institute for Mining and Metallurgy, pp. 73-79.